Week - 4
1. Aim: To control logic of a “washing machine” using Stateflow
Objective:
- If the power supply is available, the system gets activated.
- If the Water supply is not available, stop the process & indicate through LED.
- Soaking time should be 200s followed by Washing time of 100s.
- Then rinsing happens for next 20s & dryer runs for 50s.
state Flow:
A Stateflow flow chart is a graphical construct that models logic patterns such as decision trees and iterative loops. With Stateflow, you model combinatorial and sequential decision logic that can be simulated as a block within a Simulink model or executed as an object in MATLAB.
Control logic:
Control logic is the part of a controller that defines how a reactive system responds to events or conditional changes.
OR
Control logic is the part of software program that controls its execution.
Simulink Model:
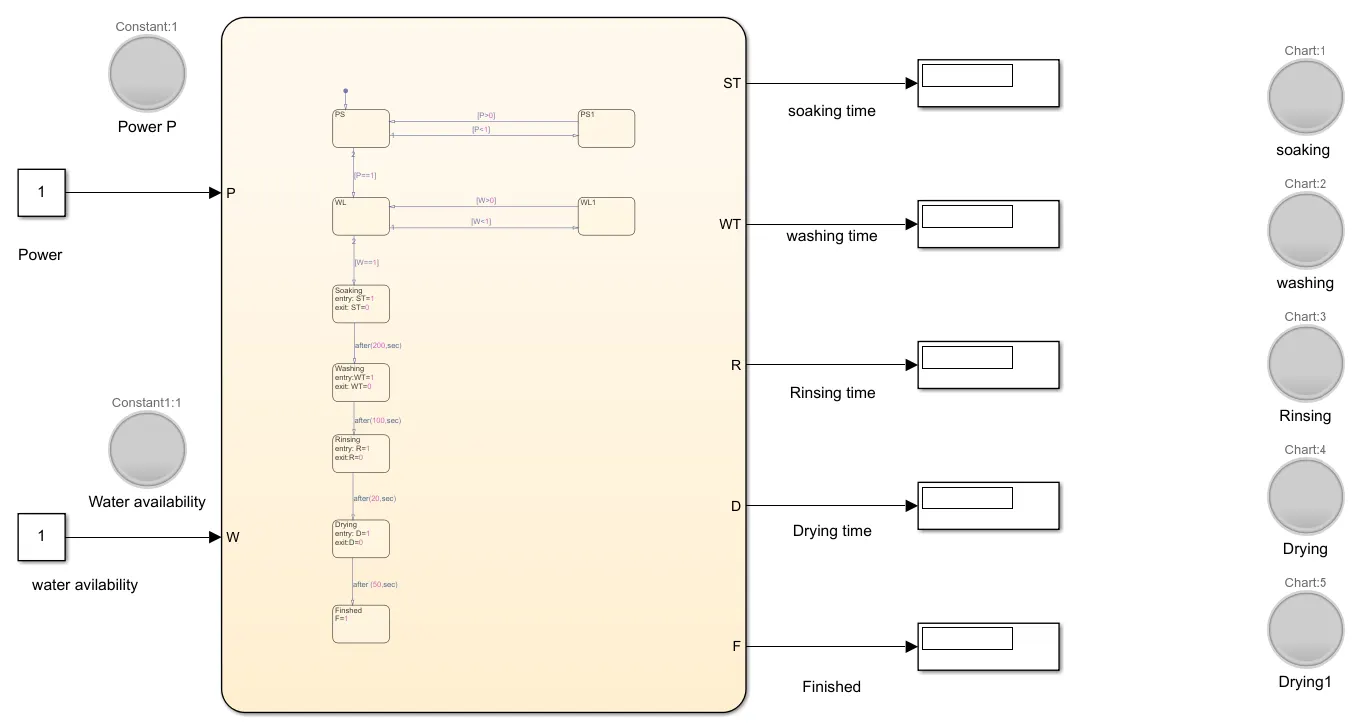
Fig.1 Simulink model of washing machine using state flow.
Blocks used:
1. Constant.
2. Lamp.
3. Chart.
4. Display.
State diagram using Chart:
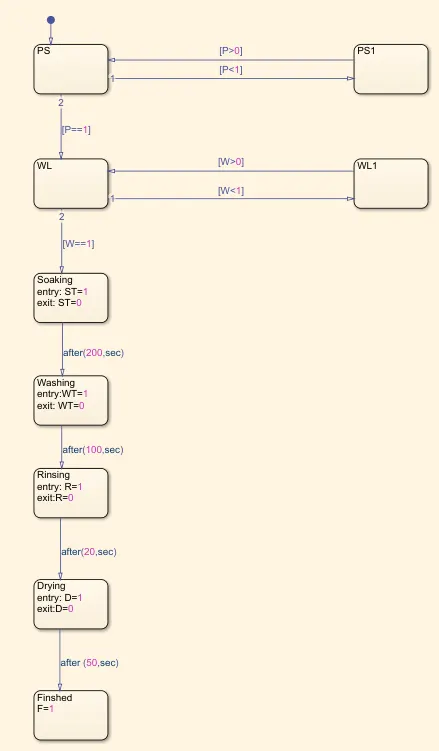
Fig.2 Control Logic of Washing machine based on the objectives.
PS-----> Power Source.
PS1----->Power Source1.
WL----->Water level.
WL1---->Water level1.
ST----->Soaking Time.
WT----->Washing Time.
R-----> Rinsing Time.
D----> Drying Time.
F-----> Finished.
Procedure and Results:
Case i(Based on Power Input):If the power supply is available, the system gets activated.
Because of the 'If' conditions mentioned in the objective,we need to consider two states one is PS and another one is PS1.
PS----> Power Source is a state which will be highlighted when the input P(Power is=1).
PS1---->Power Source1 is a state which will be highlighted when the input P(Power is =0).
Case ii(Based on Water Input):If the Water supply is not available, stop the process & indicate through LED.
Because of the 'If' conditions mentioned in the objective,we need to consider two states one is WL and another one is WL1.
WL----->Water level is a state which will be highlighted when the input W(Water availability=1).
WL1---->Water level1 is a state which will be highlighted when the input W(Water availability=0).
Based on the above two cases the simulink images shown below
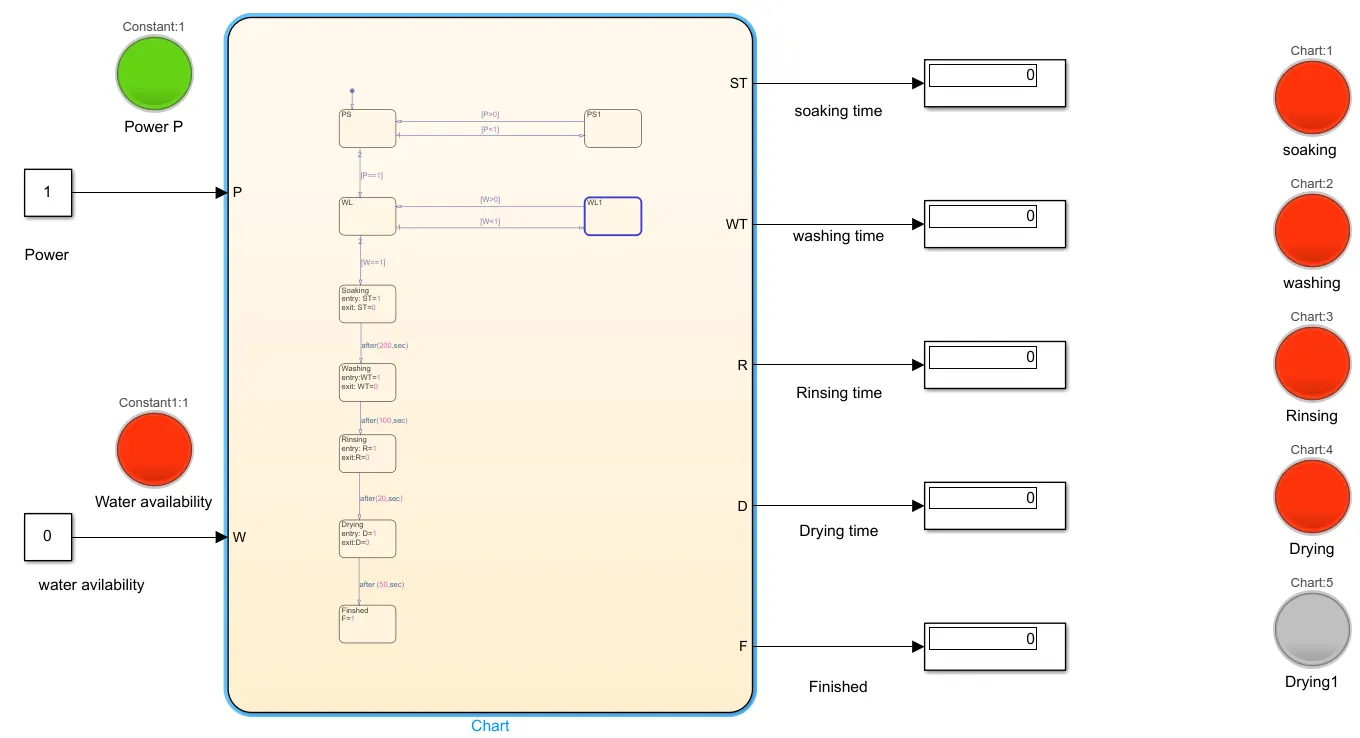
Fig.3 Simulink Diagram for Case i and Case ii.
If input Power P=1 then the green colour will be displayed and corresponding block is highlighted at t=0 and remaining blocks are displayed with red colour because of other Inputs or Output conditions mentioned as 0.
At t=0 if we run simulation using step forward then PS block is highlighted because if Input power P=1 then PS state must be highlighted as per the conditions discussed above and where as remaining all blocks are unhighlighted. The corresponding state flow is shown in fig.4
Using step forward again if we run simulation for the next 10 sec the control will moves from PS state to WL since condition is satisfied at PS State. The corresponding state flow is shown in fig.5
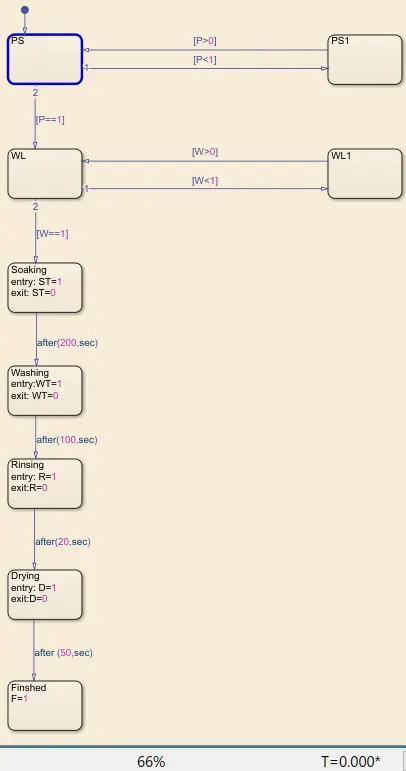
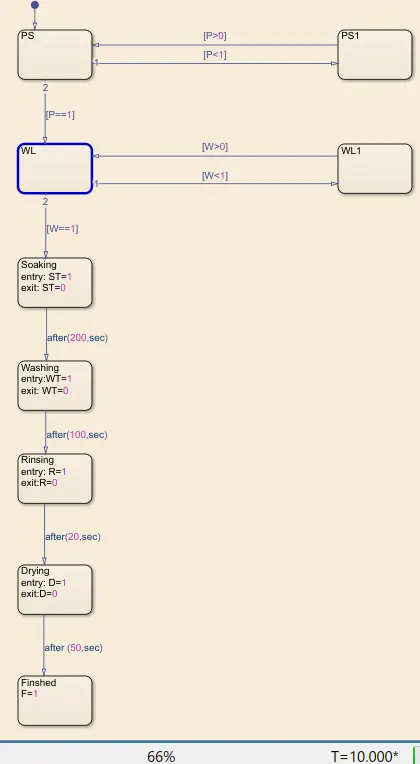
Fig.4 state flow when t=0 sec. Fig.5 state flow when t=10 sec.
From fig.5 it is observed that control is presented at state WL and now it verifies the input and conditions specified. The input W(water availbility) mentioned as 0 then then control will moves to WL1 for next 10sec. The corresponding state flow at t=20sec is shown in Fig.6.
Once the control reaches WL1 state it will not moves to further state(soaking) since the WL==1 is not satisfied.The corresponidng state flow at t=50sec as shown in Fig.7.
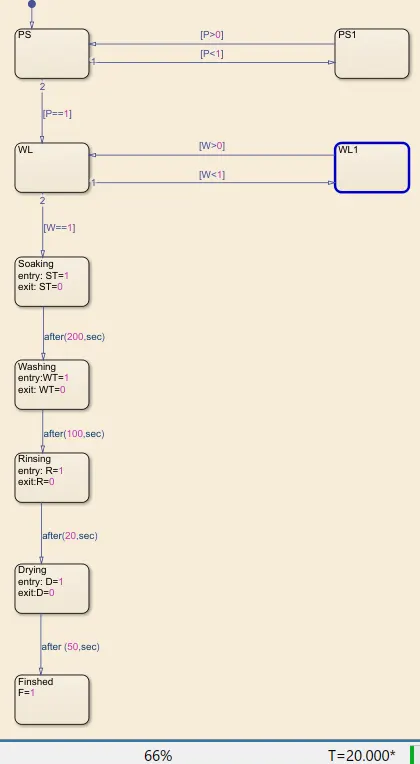
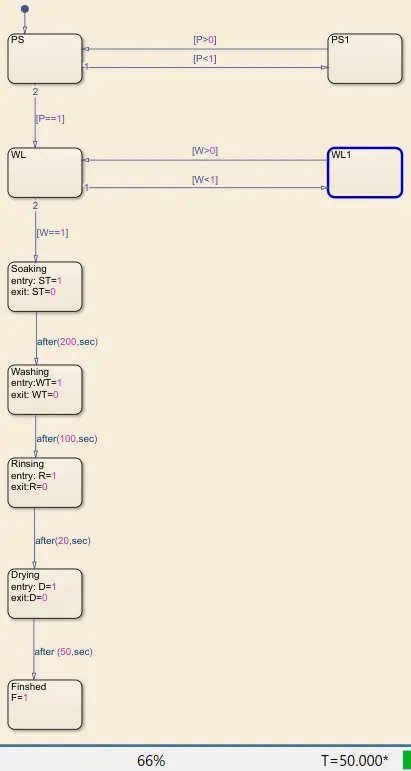
Fig.6 state flow when t=20 sec. Fig.7 state flow when t=50 sec.
From Fig.6 it will be concluded that from 20sec to 50sec the state will be remains same and this will continue further also as the condition is not satisfied.
Case iii:Soaking time should be 200s followed by Washing time of 100s.
Soaking:Soak Function is used to dip clothes in detergent water to remove dirt from the clothes.
Washing time:At this particular time, the machine uses agitation which is for mixing both water and detergent, in turn moving the clothes all around the drum.
Rinsing time:Rinsing also involves removing soils. The primary purpose of the rinse process is to remove soils introduced during cleaning, primarily residual cleaning agent. Rinsing may also remove particles and residual soils from the manufacturing process.
Drying time: The purpose of this cycle is remove moisture from the clothes.
IF the Water availability W=1 then soaking will starts and a green light will be displayed and also output will be 1 at ST port. After 200sec the state will moves from soaking to washing then Red light will be displayed and output will be 0 at ST Port.
Now washing will starts and a green light will be displayed and also output will be 1 at WT port.After 100sec the state will moves from washing to rinsing then Red light will be displayed and output will be 0 at ST Port.
Now Rinsing will starts and a green light will be displayed and also output will be 1 at R port. After 20sec the state will moves from rinsing to drying then Red light will be displayed and output will be 0 at R Port.
Now drying will strats and a green light will be displayed and also output will be 1 at R port. After 50sec the state will moves from drying to finished then Red light will be displayed and output will be 0 at D Port.
Now finally a blue light will be displayed and also output will be 1 at F port.
Case iii (Soaking time):If the Water availability W=1(green light is displayed at input port W) & power P=1(green light is displayed at input port P). The corresponding simulink diagram shown in fig.8 at t=0sec. In fig.9 at t=10sec the state changes to WL state and as the condition is satisfied the state again moves from WL state to soaking time state .Now soaking will starts and a green light will be displayed shown in fig.10 at t=20sec and also output will be 1 at ST port.
Note: The blue colour in chart box is always indicated present state.
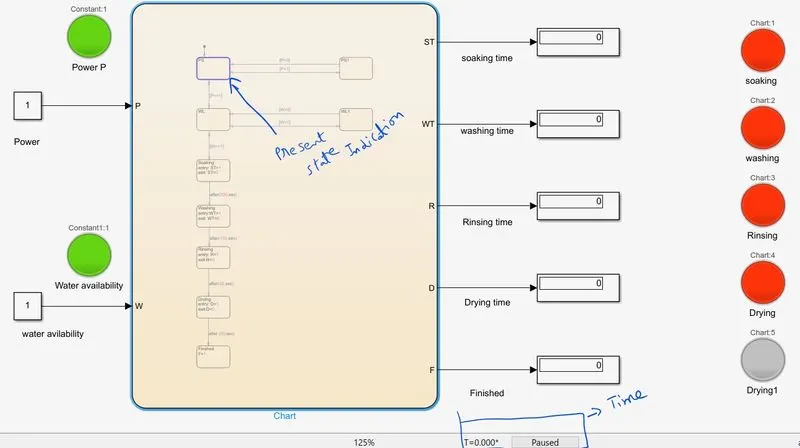
Fig.8 state flow diagram when inputs P&W=1 at t=0 sec.
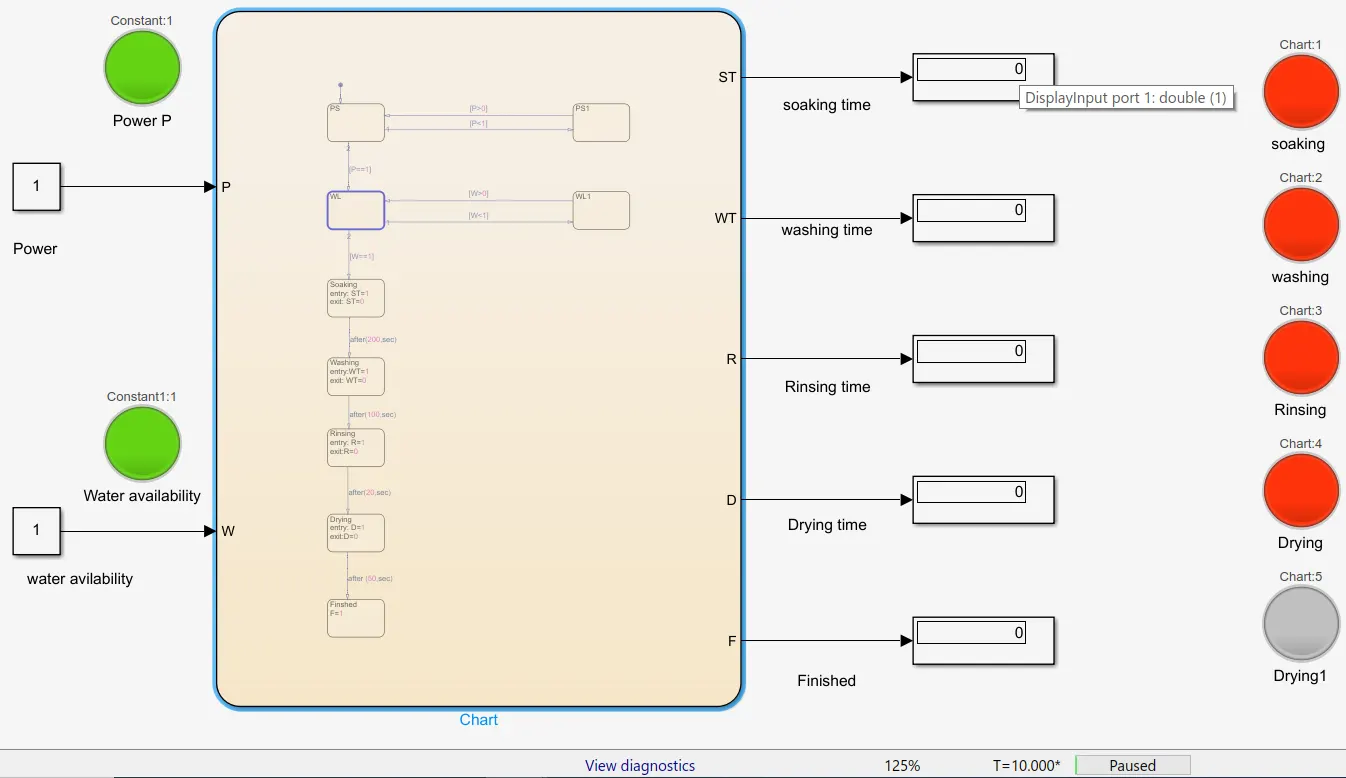
Fig.9state flow diagram when inputs P&W=1 at t=10 sec.
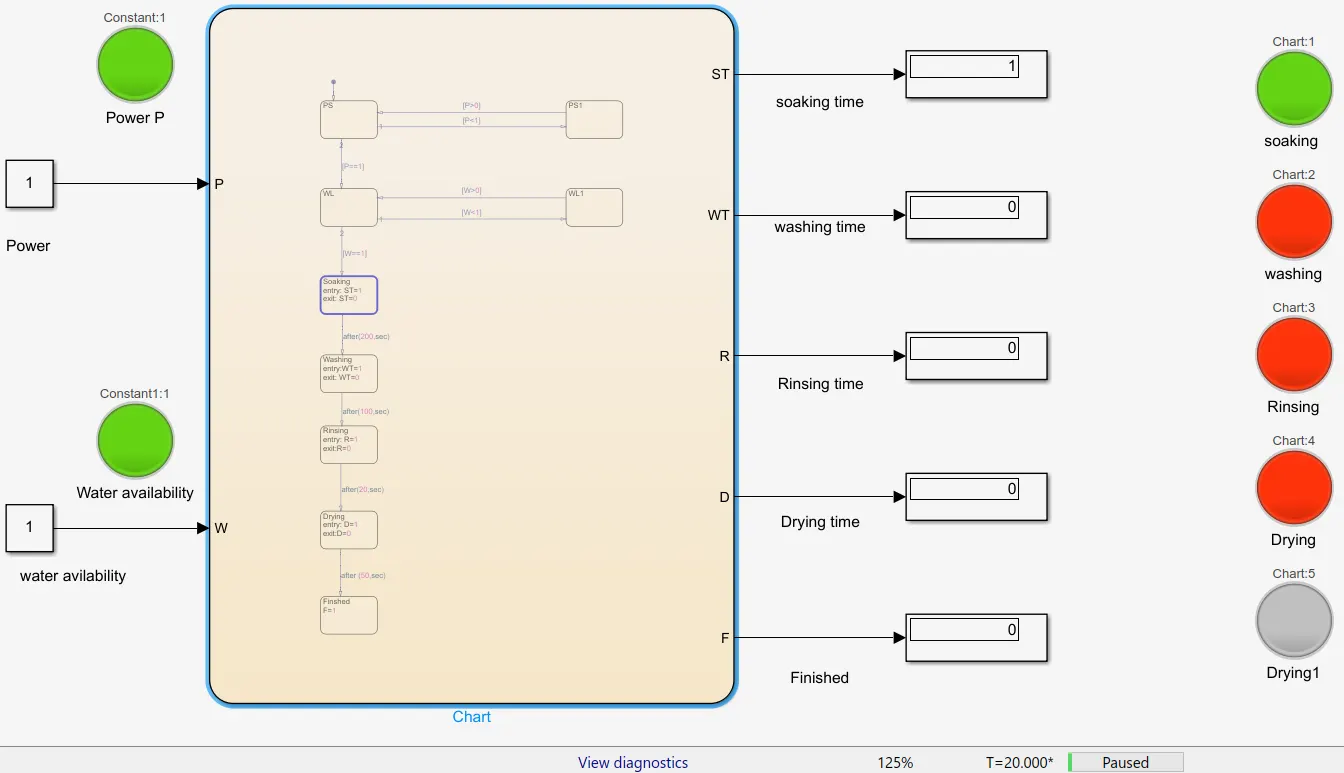
Fig.10 state flow diagram when soaking state is highlighted at t=20 sec.
Case iv(Washing time):After 200sec the state will moves from soaking to washing then Red light will be displayed and output will be 0 at ST Port ,Also output of washing time will be 1 at WT port correspondingly a greeen light will be displayed. At t=220 sec the corresponding state flow as shown in fig.11.
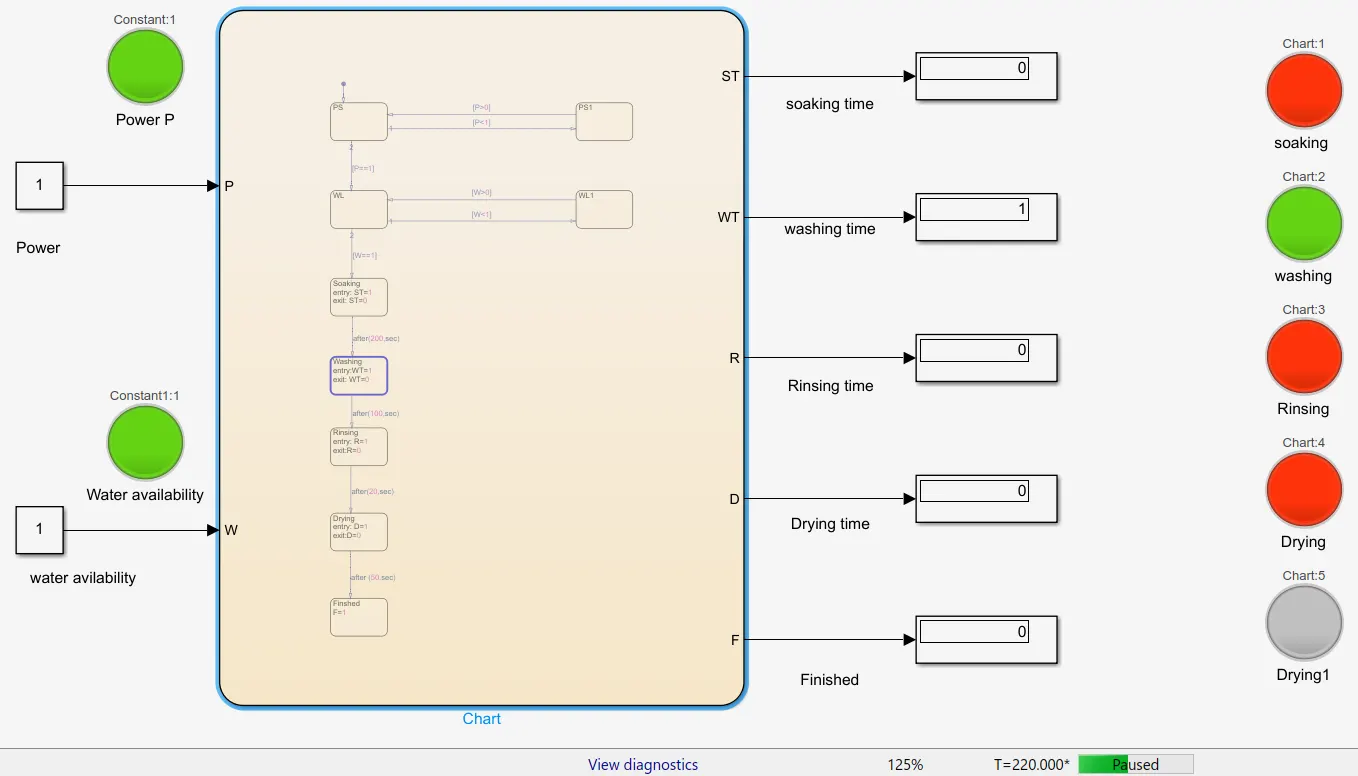
Fig.11 state flow diagram when washing state is highlighted at t=220 sec.
Case V(Rinsing time): After 100sec the state will moves from washing to Rinsing state then Red light will be displayed and output will be 0 at WT Port ,Also output of Rinsing time will be 1 at R port correspondingly a green light will be displayed. At t=320 sec the corresponding state flow as shown in fig.12.
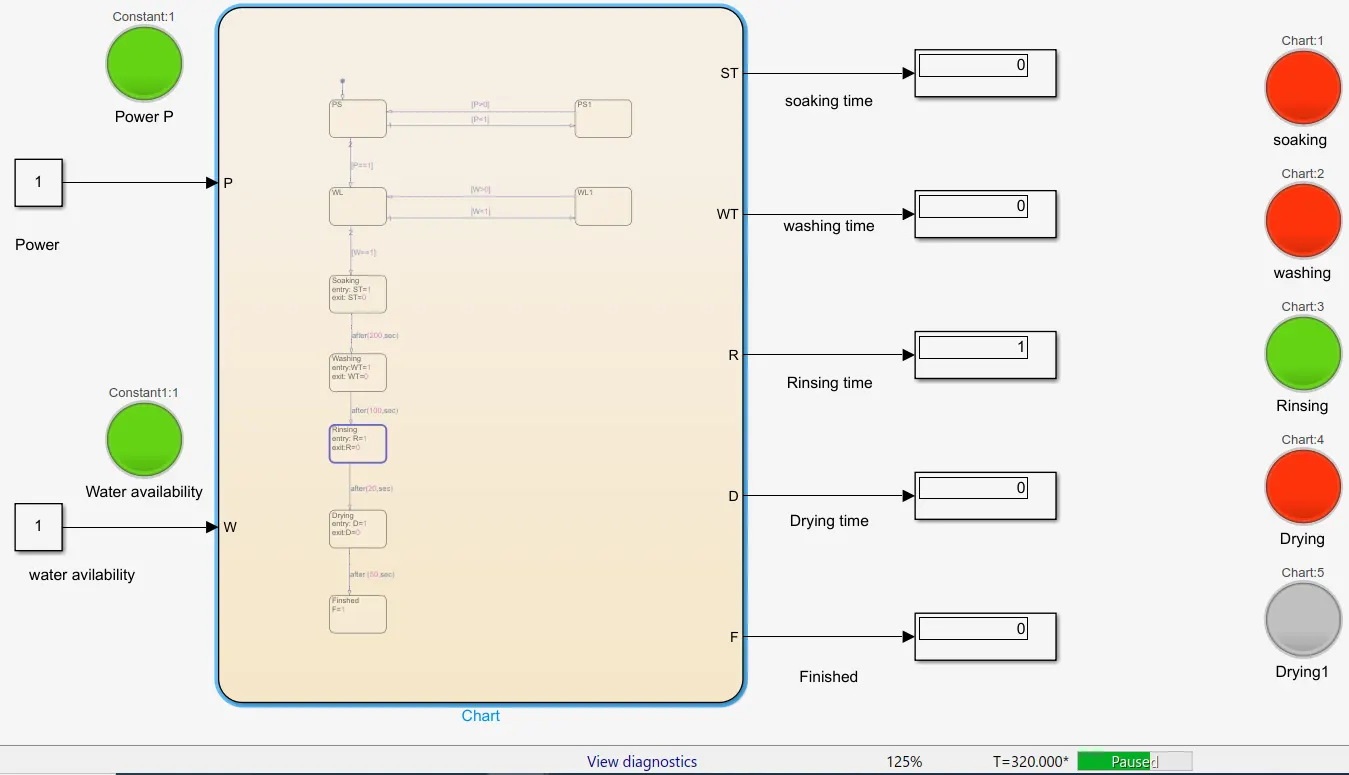
Fig.12 state flow diagram when Rinsing state is highlighted at t=320 sec.
Case vi(Drying state):After 20sec the state will moves from Rinsing to Drying state then Red light will be displayed and output will be 0 at R Port ,Also output of Drying time will be 1 at D port correspondingly a green light will be displayed. At t=340 sec the corresponding state flow as shown in fig.13.
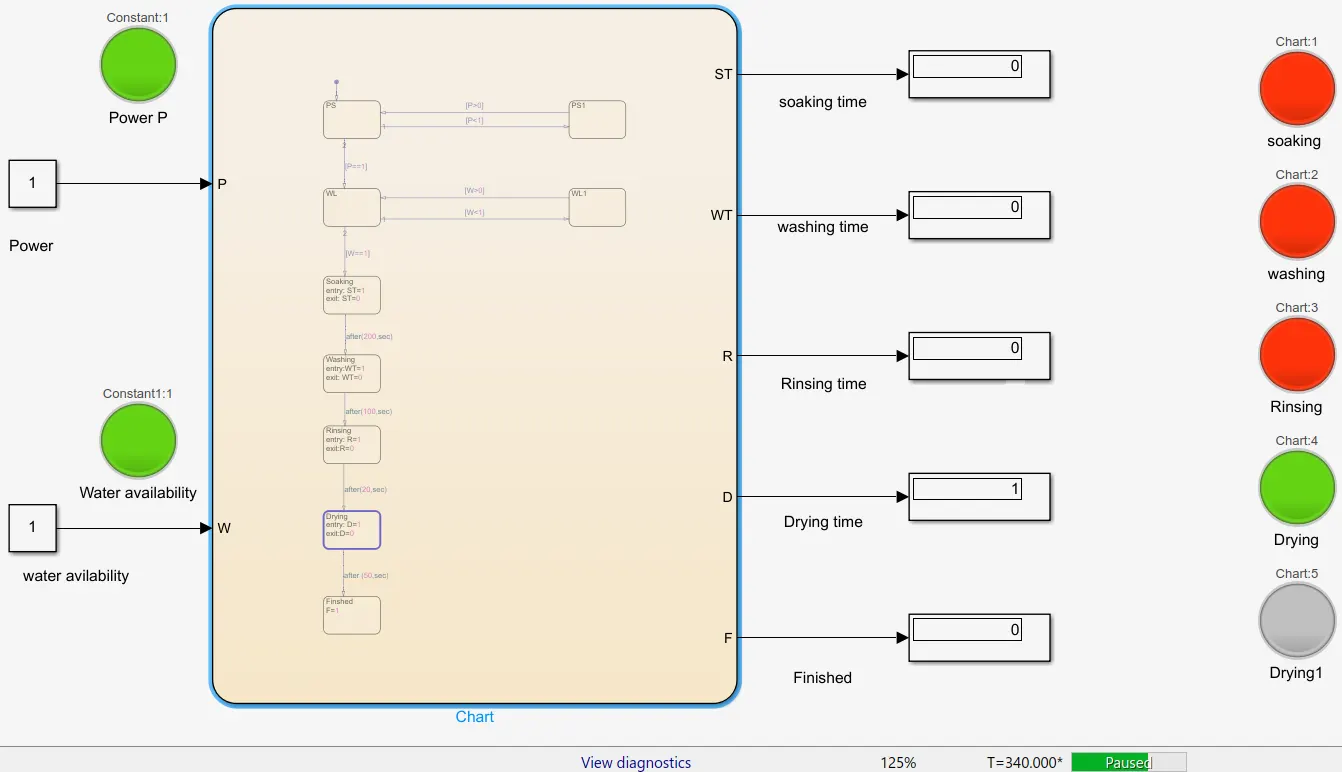
Fig.13 state flow diagram when Rinsing state is highlighted at t=340 sec.
Case VII (Finsihed state):After 50sec the state will moves from Drying to Finished state then Red light will be displayed and output will be 0 at D Port ,Also output of Finished state will be 1 at F port and correspondingly a Violet colour light will be displayed. At t=390 sec the corresponding state flow as shown in fig.14.
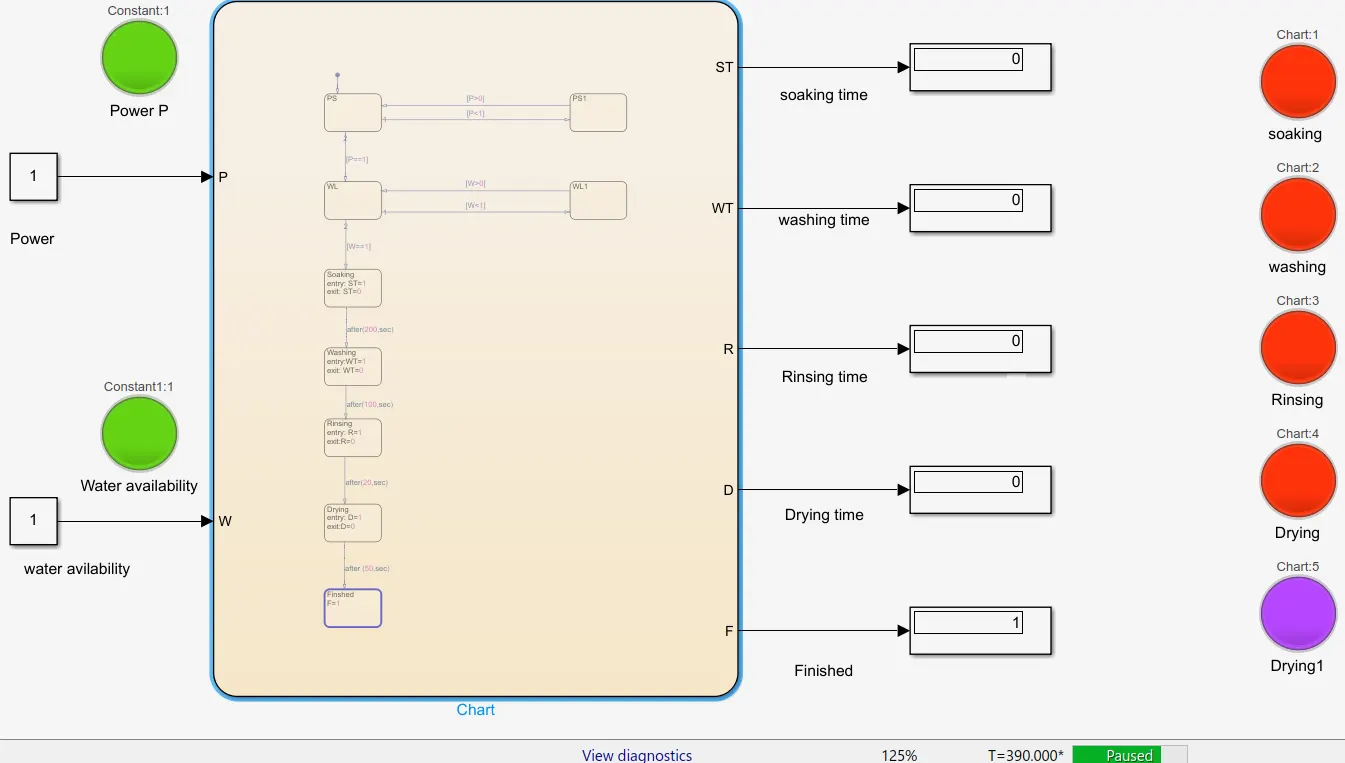
Fig.14 state flow diagram when Finished state is highlighted at t=390 sec.
2. Aim: To prepare a simulink chart for Gear shift Logic.
Objective: Give speed input while the simulation is running & display the gear number. The conditions are:
Speed Range(kmph) Gear
0 to 15 1
16 to 25 2
26 to 40 3
41 to 60 4
Above 61 5
Simulink Model:
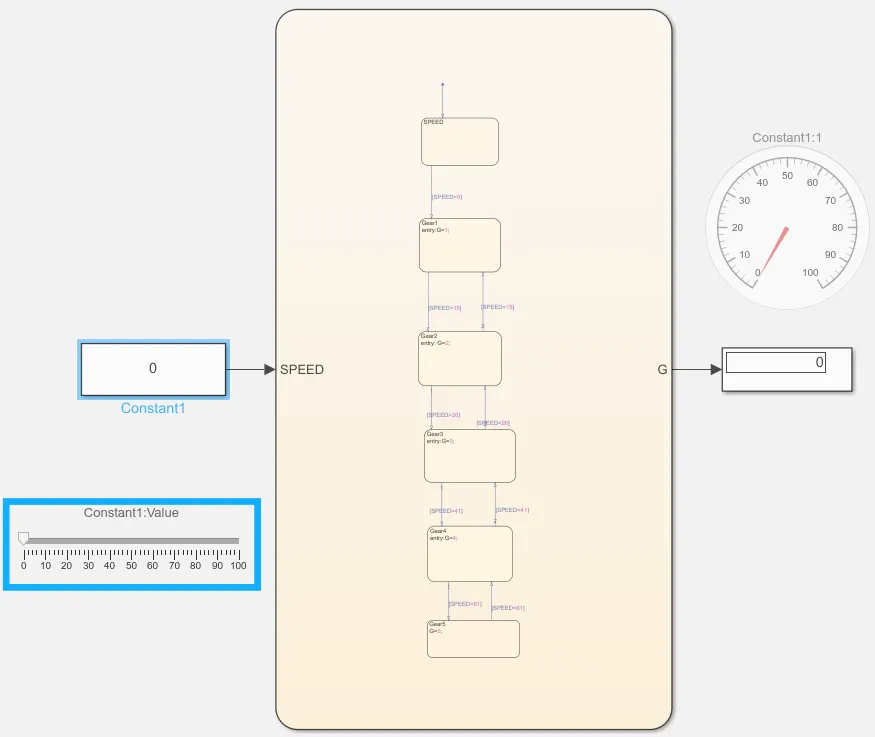
Fig.1 Simulink Model of Gear shift Logic.
Blocks used:
1. Constant.
2. Slider.
3. Gauge.
4. chart.
5. display.
Connections:
1.Here if the value of the speed is changed in slider while running the corresponding constant block value will also change.
2.Based on the slider value the Gear number is changed based on the speed.
3. The state diagram is developed based on the objectives.
Result:
Case i:At t=0 speed value 30 is considered then the corresponding simulation model as shown in fig 2. In this figure it is observed that the Output G is displayed as 0 because still state is not reached the required state. But actual output for the corresponding speed is G=3.
Caseii:At t=1 the state is moved from speed to Gear1 state and it is observed that the Output G is displayed as 1 because still state is not reached the required state. The corresponding simulation model as shown in fig.3
Caseiii:At t=2 the state is moved from Gear1 to Gear2 state and it is observed that the Output G is displayed as 2 because still state is not reached the required state. The corresponding simulation model as shown in fig.4
Caseiv:At t=3 the state is moved from Gear2 to Gear3 state and it is observed that the Output G is displayed as 3 and the required output is acheived. The corresponding simulation model as shown in fig.4.
Note: The blue colour in chart box is always indicated present state.
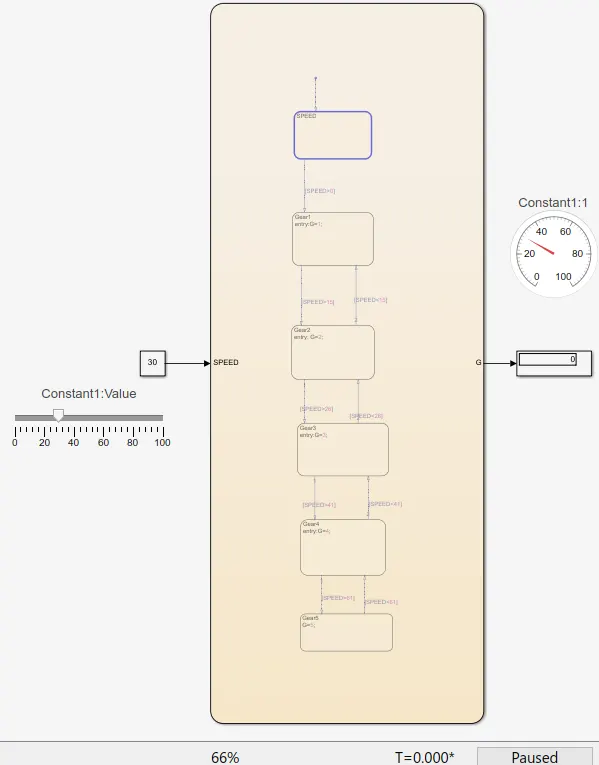
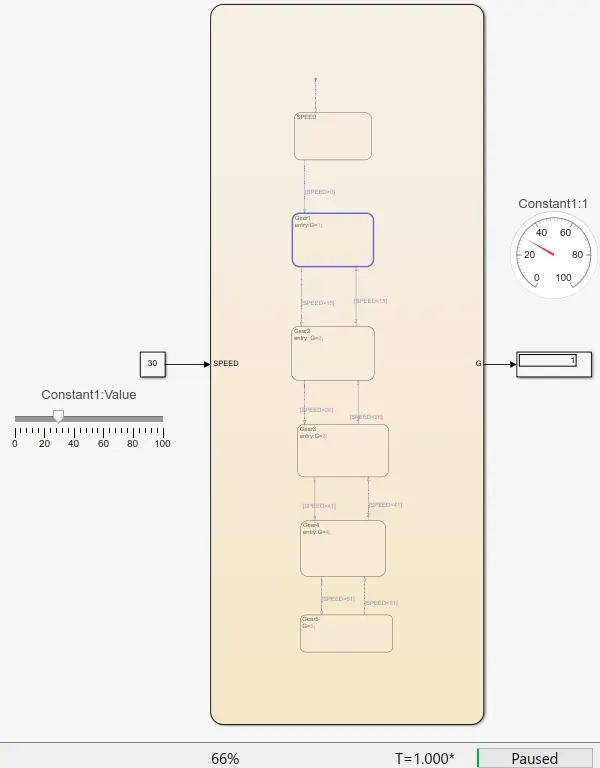
Fig.2 simulink model at t=0. Fig.3 simulink model at t=1.
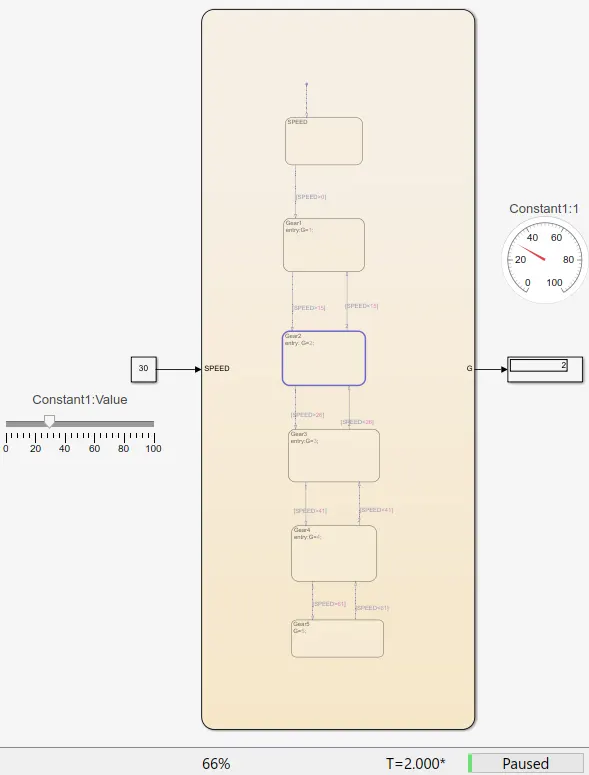
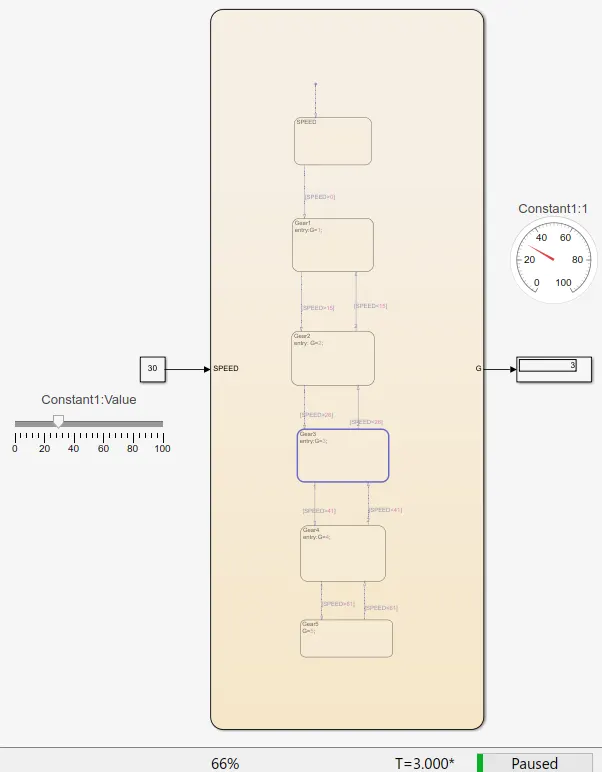
Fig.4 simulink model at t=2. Fig.5 simulink model at t=3.
CaseV:Now the speed value is again changed to10 then the corresponding Gear value is 1. The corresponding simulink model as shown in fig 6 at t=5. It is observed that to reach speed 30km/h the time taken is 3sec and again to reach modified speed 10km/h the time taken is 2more sec because of to change the two states.
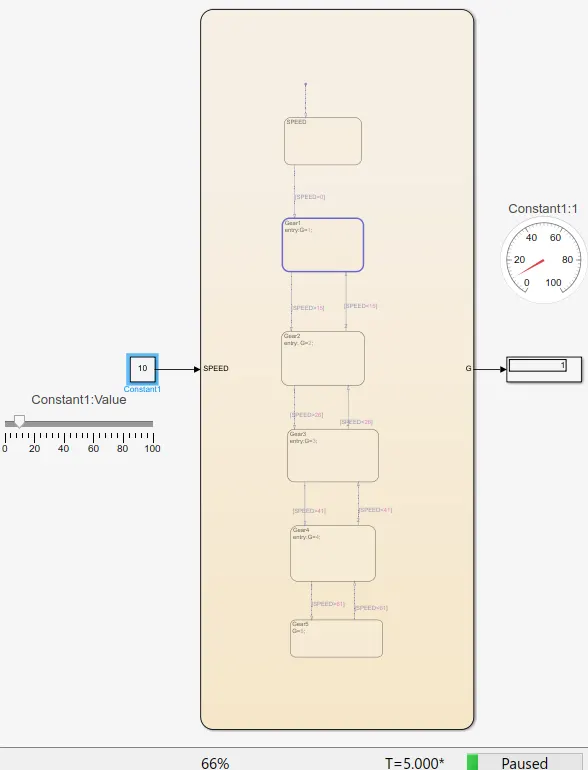
Fig.6 simulink model at t=5.
CaseVi:Now the speed value is again changed to 80 then the corresponding Gear value is 5. Previously the state is at Gear1 and now to reach the modified speed 80km/h the time required is 4more sec because to change the four states. The corresponding simulink model as shown in fig 7 at t=9.
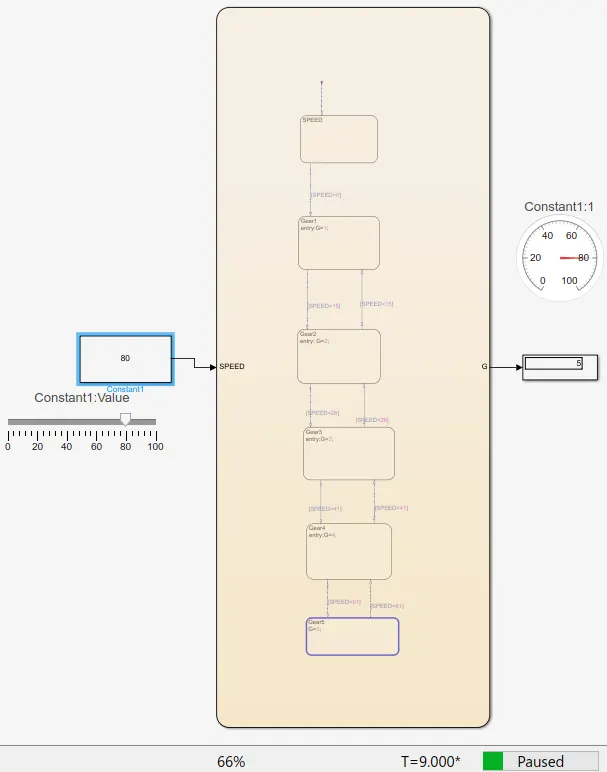
Fig.7 simulink model at t=9.