Week-4 Challenge WOT Condition Part-2
(1) What is the difference between mapped and dynamic model of engine, motor and generator? How can you change model type?
Mapped model:
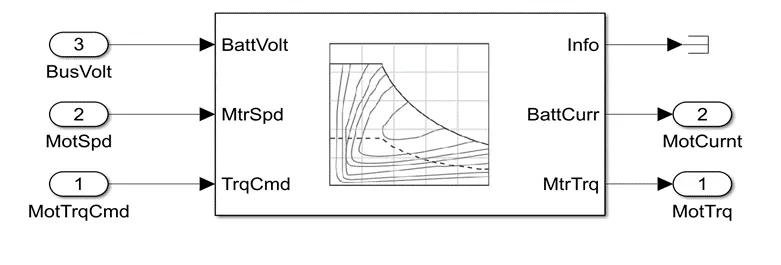
- It is a prebuilt model in the powertrain block. consists data prebuilt lookup table is deal with mapped model. It is used in steady state lookup table to engine performance. In the mapped engine models are do not require subsystem for analysing and design activities. It is calculation are very fast.
- The mapped model include actual torque, speed, engine out, exhaust and fuel flow rate.
Dynamic model:
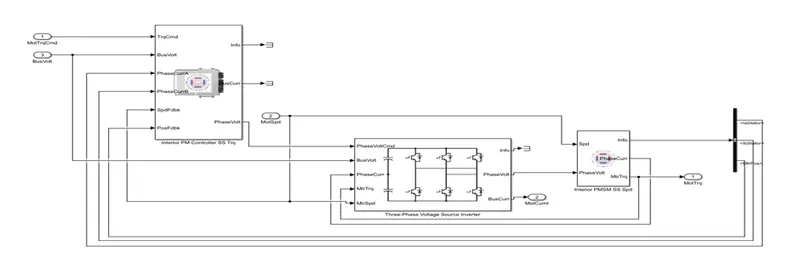
- This block are subsystem of different blocks.
- This block not prebuilt powertrain set model, it takes the real time data for calculating every parameter such as speed, velocity, drag.
- This model not prebuilt that reason dynamic model calculation is time taken for very long duration for calculating every data.
How to change the model for mapped system to dynamic system:
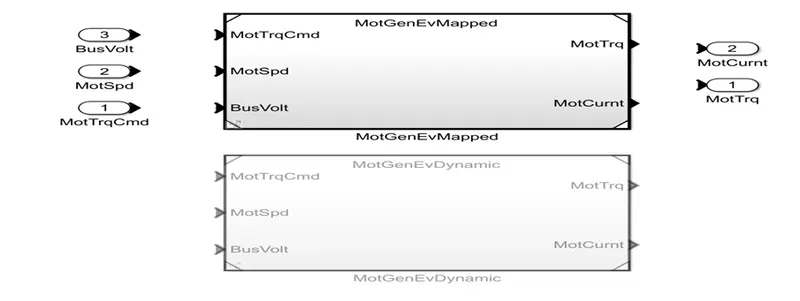
Steps for changing the model mapped into dynamic:
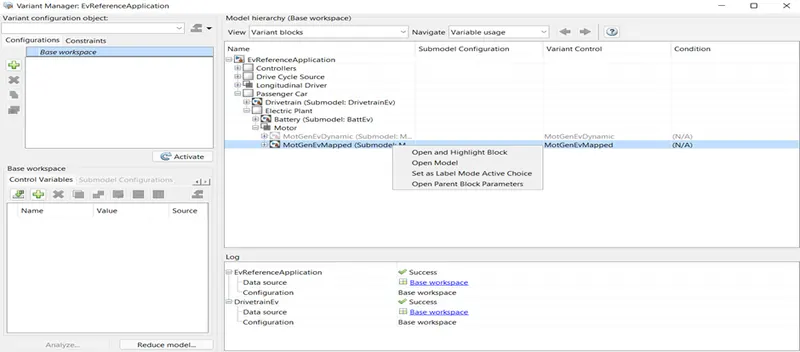
- Open the matlab simulation window for EV reference model and open the modelling, and go the variant manager.
- In the variant manger show all subsystem.
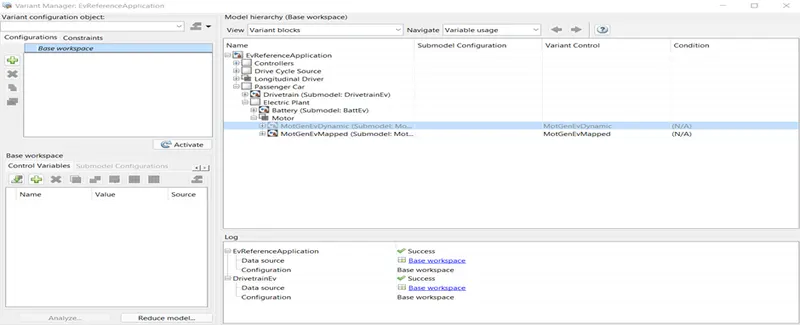
- Go to the passenger car subsystem and then go to the motor block and press write click to select set as label mode active choice.
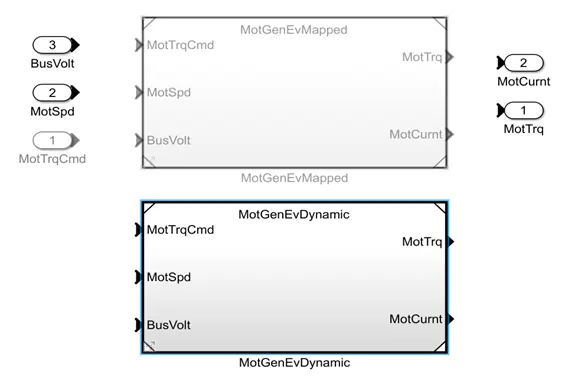
- After the change the label mode the mapped changed to the dynamic in EV model.
(2) How does the model calculate miles per gallon? Which factors are considered to model fuel flow?
Calculation miles per gallon:
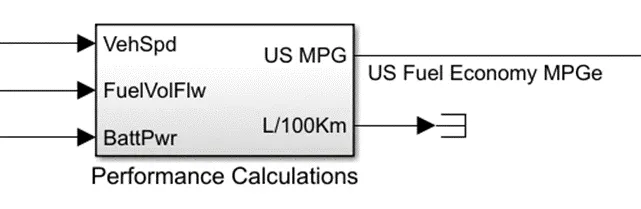
In this model calculation miles per gallon that can be calculated by three calculation block.
- Vehicle speed
- Battery power
- Fuel volume flow
Block:
Subsystem:
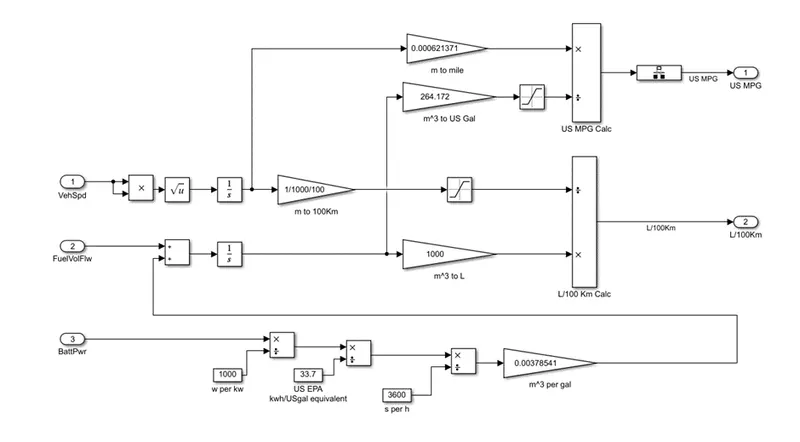
- Battery power (X) units in watts to kilowatts by dividing 1000 and output power obtained.
- The output power is kilowatt hours (kwh) is converted into US EPA standard. The value of X is dividing US EPA standard 33.7
- After converting the value US EPA standard value are obtained in a kwh, this value converting in kilowatt second so value of X is dividing with 3600. Then value obtained in kilowatt seconds kws/US gal.
- The output value in kws/US gal are multiply with 0.00378541 the result obtained in m^3 per gallon.
- For fuel volume flow adding two inputs values of 0.00378541 and fuel volume flow, this output integrated by using in integration block for converting m^3/gallon to m^3. For calculating fuel consumption of vehicle.
- Then battery power and fuel volume flow added to get and multiply 264.172 to convert m^3 into US gallon.
- ‘X’ which is vehicle speed and going into integration to obtained distance in meters. By multiplying 0.00062137 is converting meters into miles.
- At last miles is divided by gallon we get result in the miles per gallon.
-
miles per gallon=(vehicle speed )/(battery power+fuel )
factors are considered to model fuel flow:
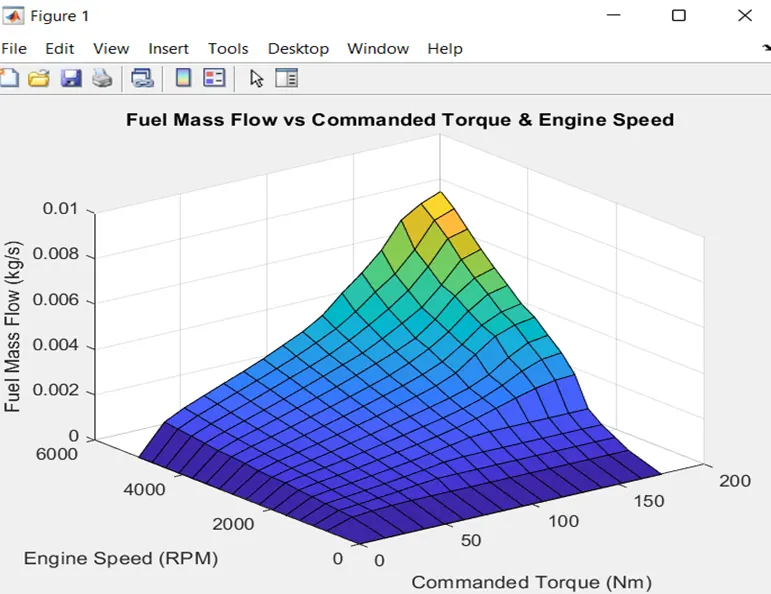
Above graph shows fuel mass flow vs command torque and engine speed (RPM). the main factor are considered to the torque and speed for model of fuel flow. The engine speed and torque observed flow of fuel that acceleration of vehicle. The engine speed is increases by the flowing of fuel is also increases the command torque so that distance travelled of vehicle is increases during fuel flow.
(3) Run the HEV Reference Application with WOT drive cycle. Change the grade and wind velocity in the environment block. Comment on the results.
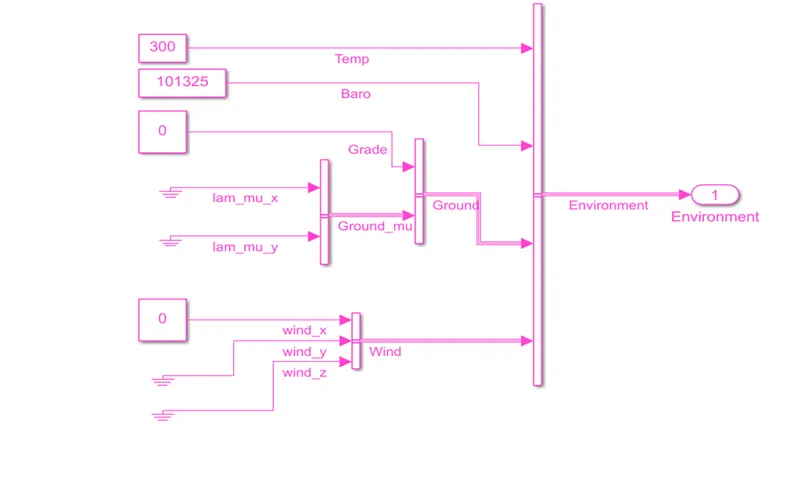
In this simulation HEV runs at WOT drive cycle with 0 grade and 0 wind velocity
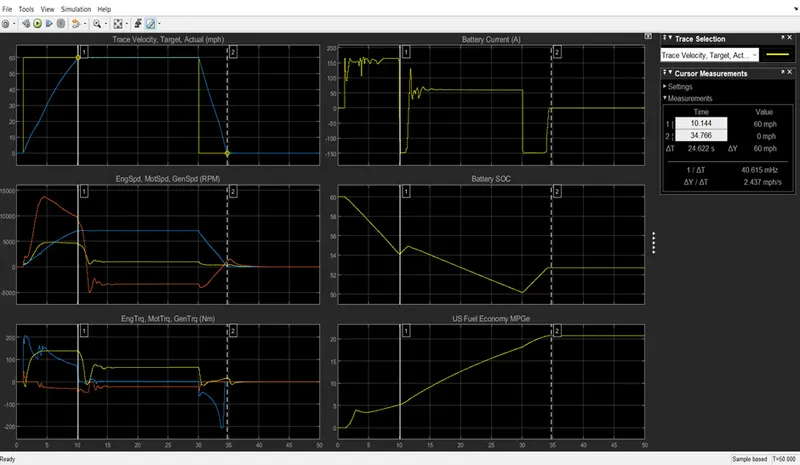
- Above graph showing the trace and actual velocity, motor and engine speed, engine motor generator torque, battery current, battery SOC and fuel economy.
- The maximum velocity of the vehicle is 60mph. speed of the vehicle is constant after deacceleration 30sec battery get recharging.
- The engine and motor speed plot the maximum speed of the motor during starting is 14000 rpm. The battery current is also maximum at 160A. after some time battery current is negative motor speed is also negative.
- In the plot of engine and motor torque the increasing velocity at starting engine torque will be 200 Nm, and gradually decreases after deacceleration engine torque will be -200 Nm. the motor torque will be negative.
- battery current during engine starts of the vehicle is 160A, higher torque produced by battery so level of power transmission is high, after state is going to maximum velocity changing the engine and battery gets decreasing to -150A.
- the battery state of charge is initially 60, they gradually decreasing, after vehicle gets deacceleration condition the state of charge is recharged.
- A fuel economy plot showing consumption of vehicle per distance.
In this simulation HEV runs at WOT drive cycle with 10 grade and 20 wind velocity.
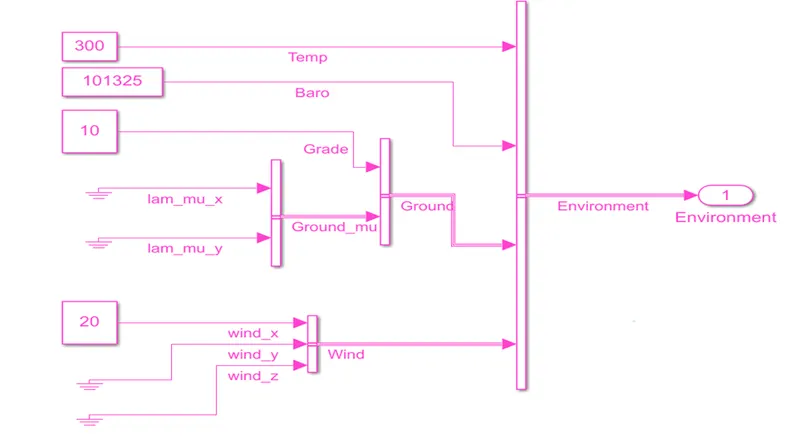
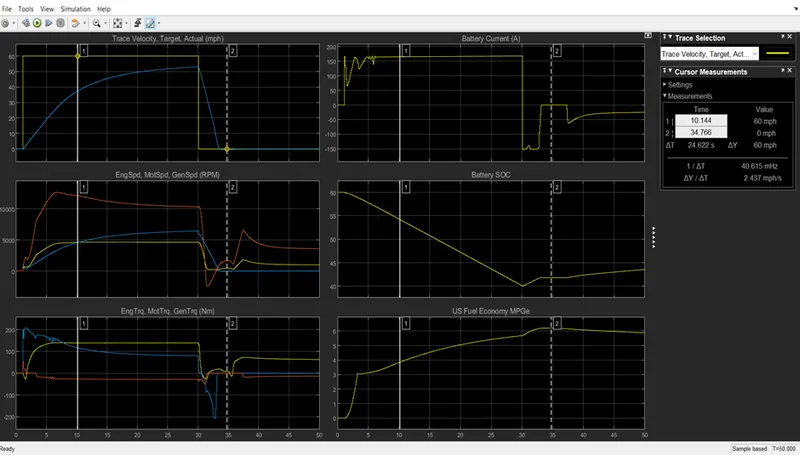
- After changing the environment condition grade is 10 and wind values is 20 above results shown.
- This results comparison with without grade and wind condition, velocity will be low. After adding grading, velocity of the vehicle will 52mph.
- This Plot of engine and motor speed are high because the grade include. Because of grading motor will taking more power.
- The torque of the system is high due to grade and wind effect giving to this model. After deacceleration occur speed is reduced so torque is also reduced.
- Battery current during starting high to the previous case. After deacceleration occur battery currents gets increases -150 to 0.
- Battery SOC gets gradually decreasing of starting because of grade force and wind effects, after deacceleration battery soc gets increases to 40 to 43.
- Fuel used in this condition is very high. Torque is increasing so fuel consumption of vehicle is also high.
(4). Keeping all other parameters same, compare the simulated results of hybrid and pure electric powertrains.
Electric vehicle:
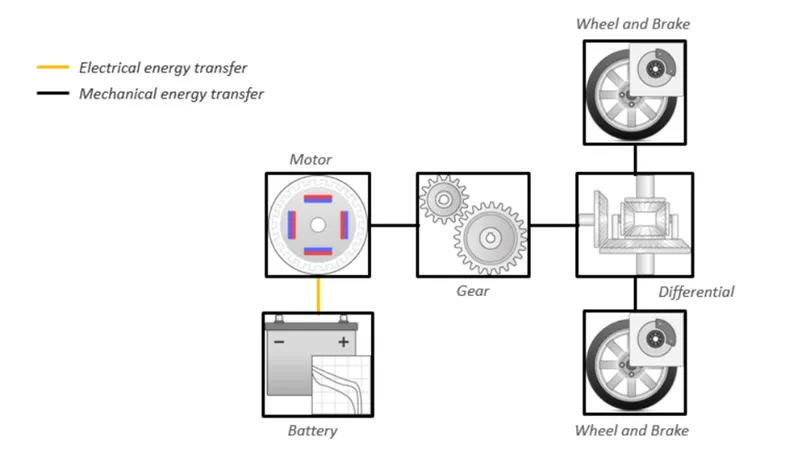
The electric vehicle reference application represents a full electric vehicle model with a motor-generator, battery, direct-drive transmission, and associated powertrain control algorithms. Use the electric vehicle reference application for powertrain matching analysis and component selection, control and diagnostic algorithm design, and hardware-in-the-loop testing.
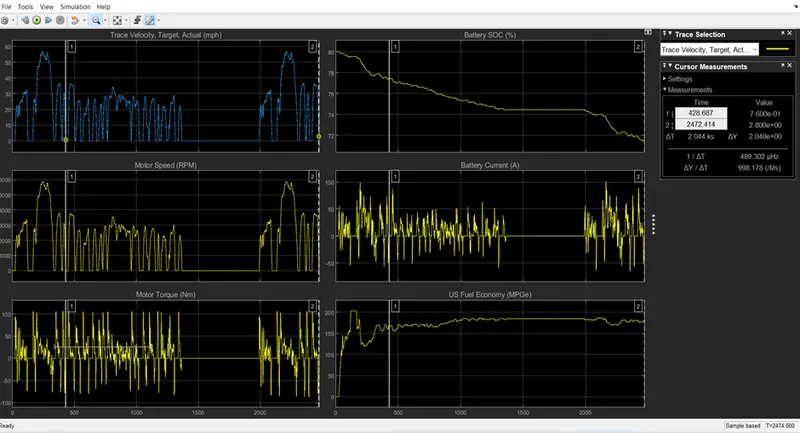
above results shows pure electric vehicle:
- The actual velocity is same as the trace velocity because actual velocity used in drive cycle.
- In the above graph motor speed is same the velocity but changes the value.
- The motor torque is between positive and negative according to velocity.
- Battery SOC falls from the 80 to 71for this drive cycle.
- Battery current is between 100 A to -50A.
- Fuel economy initially increases upto 200 and after decreases to 125. And then increases to 160 and gradually increases to 180.
Hybrid Electric vehicle:
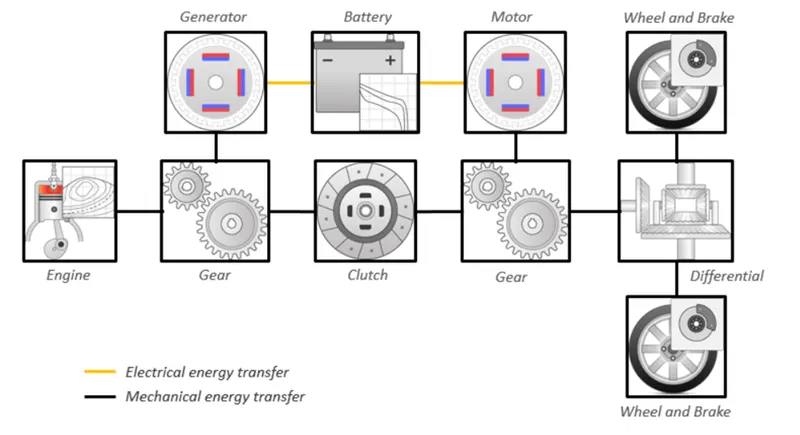
The hybrid electric vehicle reference represents a full multimode hybrid electric vehicle model with internal combustion engine, transmission, battery, motor, generator, and associated powertrain control algorithms. Use the reference application for powertrain matching analysis and component selection, control and diagnostic algorithm design, and hardware-in-the-loop testing.
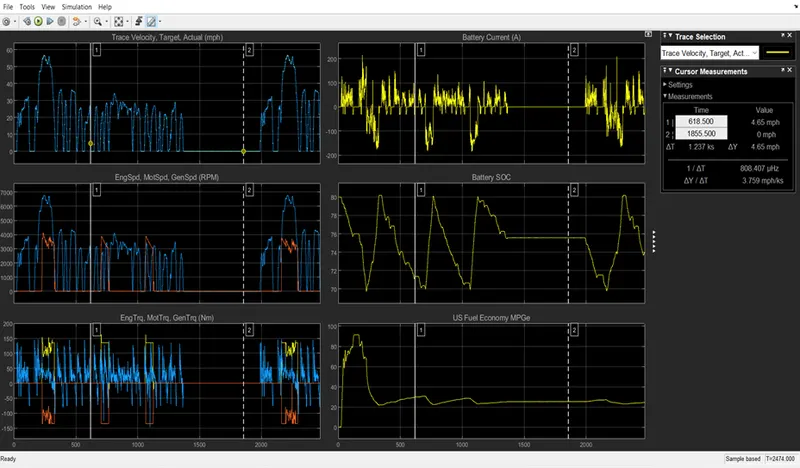
- The first plot is the drive cycle.
- Motor and engine speed plot. The motor speed is higher than engine speed.
- Third plot shows the engine torque, motor torque and generator torque.
- Fourth plot shows the line currents, it continuously varying positive and negative.
- In the battery SOC decreases and increases accordingly drive cycle. When it decreases 70% engine produced power and running the vehicle. During deacceleration battery is charged.
- Fuel consumption is more during starting of the HEV vehicle.