Week-4 Challenge WOT Condition Part-2
Q:1;
In simple words mapped vs dynamic models of motor , generator , engine are the real time patterns,values or outputs and training datasets. Typically in case of mapped model of any component of EV the drive cycles are recorded and provided as an input. The output is then compared with input via closed loop system. This is called mapped system . In dynamic system the real time outputs are recorded randomly and provided a training dataset.
To change the model in our EV reference model in matlab the "longitudinal driver" block is used . In documentation of EV vehicles , the longitudinal driver block function with all of its specifications and different models to choose are shown.

There are three options : 1-Predictive PI control
2-PI control
3-Scalar control
Here PI stands for proportional intergrable. In case of mapped model the feed forward gains are a function of vehicle velocity.
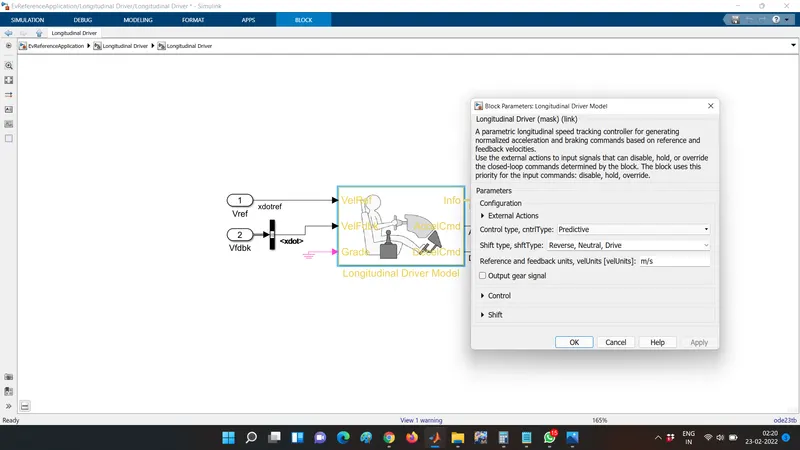
To change the model 1:Go to longitudinal driver block.
2: Click on longitudinal driver model.
3:The block parametrs for longitudinal driver block appear. Choose control methods as per requirement.
The main function of longitudinal driver is to generate normalized acceleration and braking commands based on reference and feedback velocities.
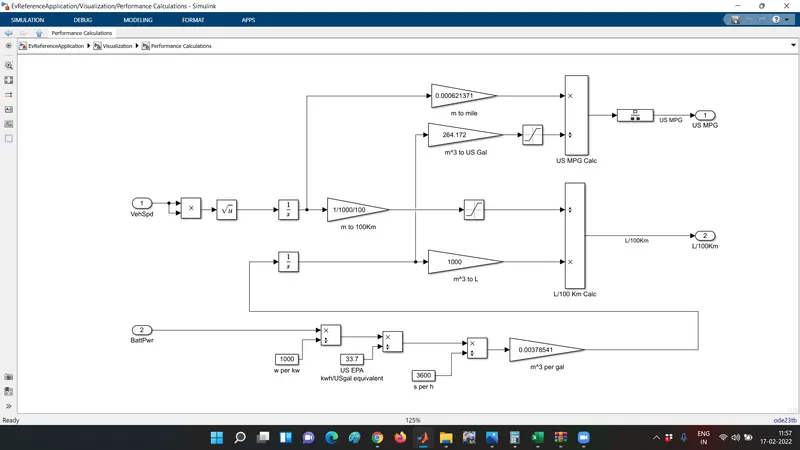
Q.2:As seen in figure the block diagram consists of various blocks like vehicle speed and battery power as parameters,gain blocks to multiply by a required numerical value,integrator blocks,saturation limit blocks to set the upper and lower limits,basic math operations like product,squareroot,etc.
Talking about the first parmeters vehicle speed is given to product block and taken square root-this is done in order to take the rms value or just neglect the negative values in speed.It is then fed to integrator as velocity is the derivative of distance ,taking its integration gives us the distance.The saturation limits are provided in order to provide the maximum and minimum limits of the inputs
Q:3
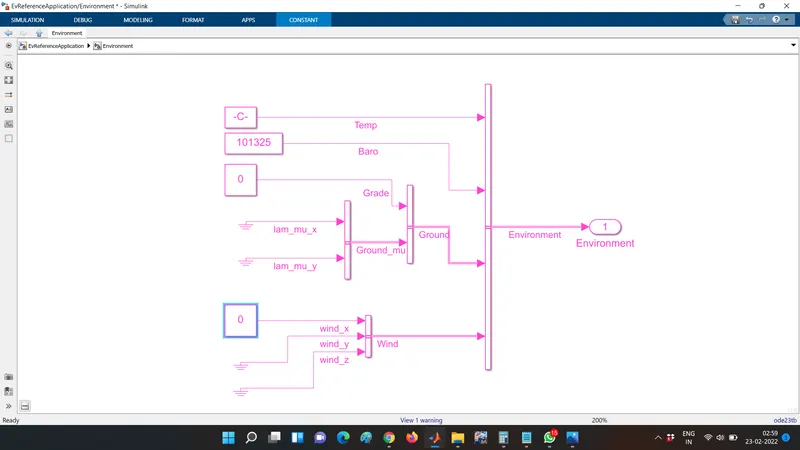
The environment block is used to change all the related parametres for changing temperature,wind velocity and direction,and grade or slope angle.Initially this block is set to standard temperature pressure conditions. This graph shown below is at 0 grade and zero wind velocity.
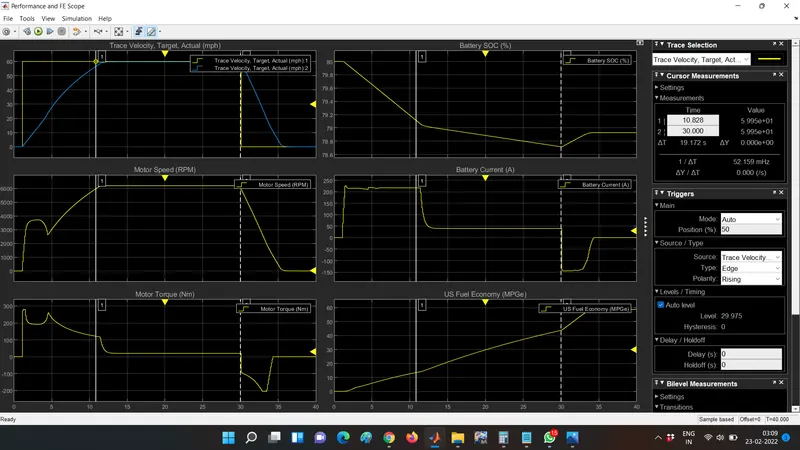
The model is fed with WOT drive cycle . The patterns observed are completely different than the FTP drive cycle . The trace velocity is like a square wave with actual velocity showing up like a diode characteristics output graph pattern . The motor torque increases suddenly after a few instants. The motor speed and motor torque are seen inversely propotional to each other. It is because at wide open throttle condition the power consumed and accelration are both maximum. The miles per gallon screen shows a gradual uniformly increasing mileage. The battery SOC decreses till the end of the cycle.All the patterns here are seen to behave in periodical increase and decrease manner.
Now when the grade is set to 13 and the wind speed is 17 mph,the graph shows up something like this.
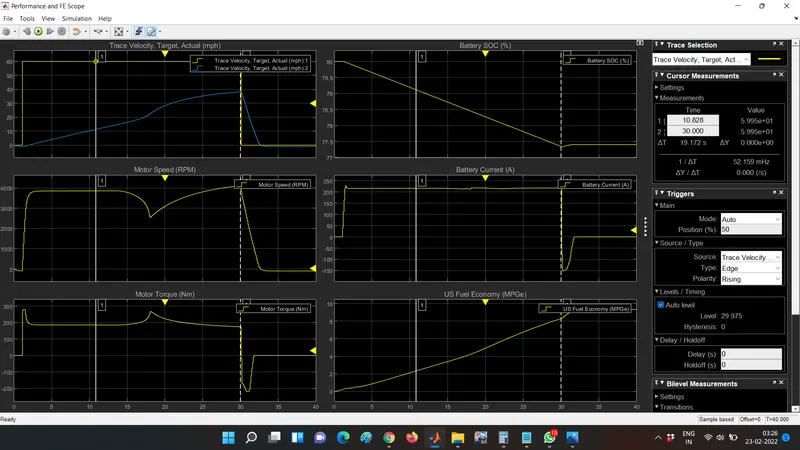
the trace velocity and actual velocity are changed with blue line which is trace velocity is decreaes at initial instants . The motor speed increases stays up at that state for 3/4th of the total time and decreases gradually. Battery current is linear totally . There is no chabge in behaviour of economy. The SOC is seen to be decreased a bit. Motor torque also shows up almost linear characteristics with slight rises in between.
Q:4
The powertrains for electric and Hev are as shown in figure below. (Source:matlab documentation)
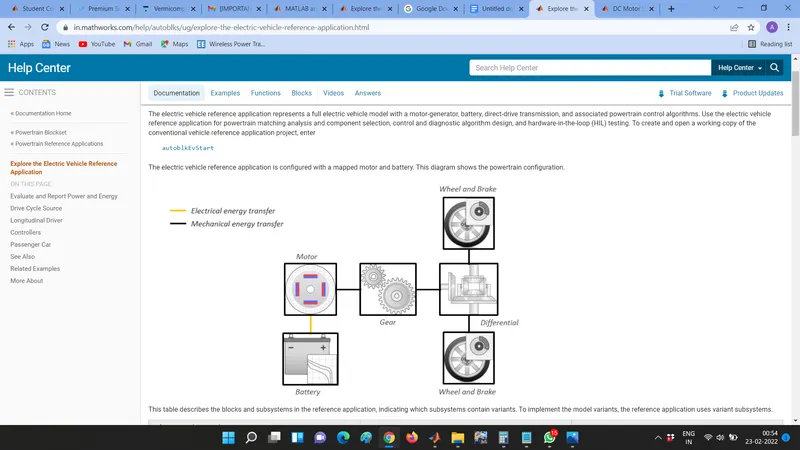
Fig (a)-Electric vehicle powertrain
The powertrain consists of battery,gear and motor as primary components . Regenerative brakes are provided. The simulation for EV powertrains are as follows:
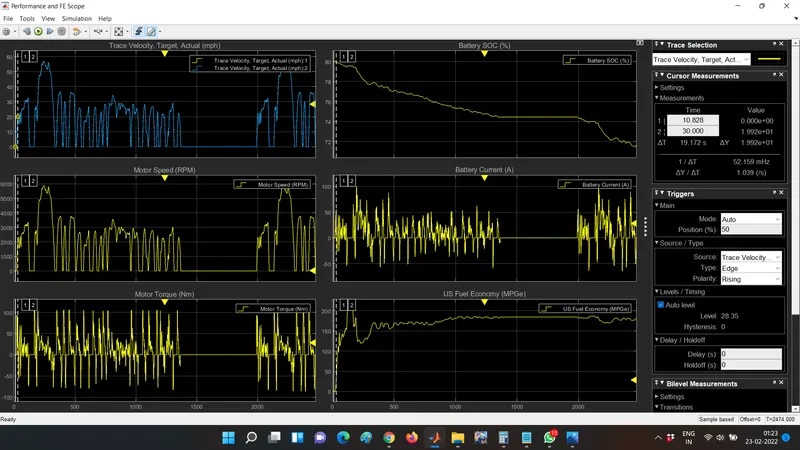
From the above results after running the simulation as per the drive cycle time, it is observed that trace velocity in first window almost is invisible because of accurate overlapping on the FTP drive cycle. Accordingly the motor speed and motor torque are at a initial raise and decrease to 1/2 of its peak value. Then maintains the same 1/2 peak value for some seconds and a plain line indicates that the vehicle was stationary or braked down to zero speed. The battery current and Motor torque are indistinguishable and are closely related with each other. Finally talking about the fuel economy because of initial high speed of motor the fuel is consumed at a greater amount. Battery state of charge (SOC) is initially highest and decreases gradually with periodical spikes . After some time it is almost stable at approaximately 74-75 % and falls down to 72 at the end cycle.
HEV powertrain
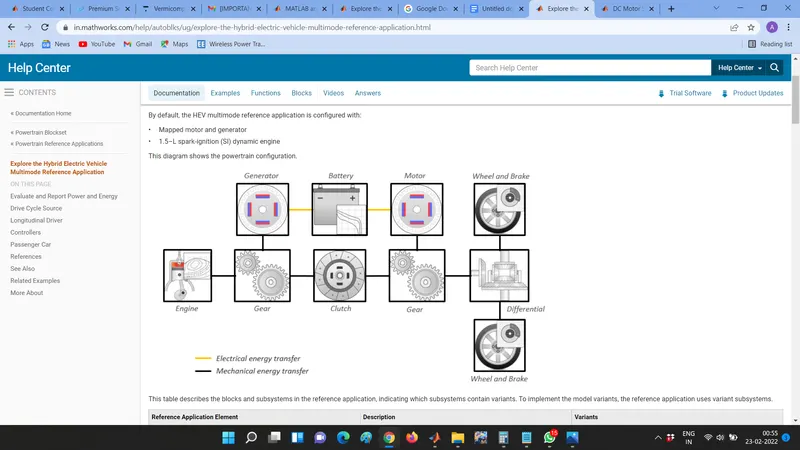
As the name suggests, this type consists of both engine and motor which is a combination of electric and conventional IC engines consistinf of clutch,variable ratio gear. The simulations for hev powertrin is shown below
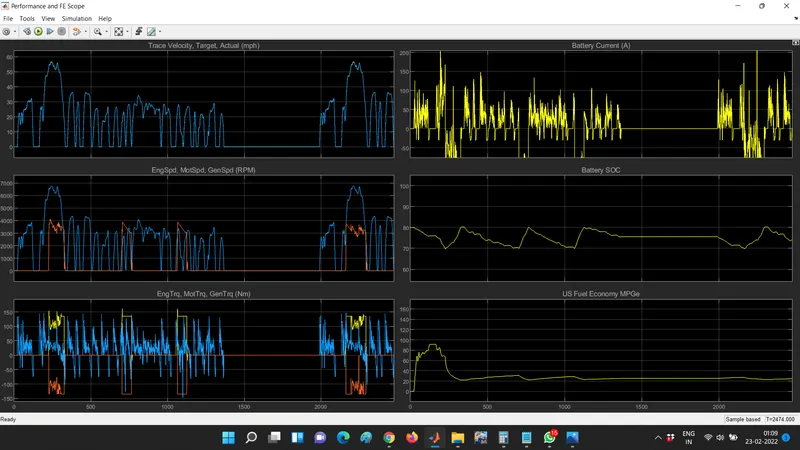
There are some similar display screens and some dissimilar ones with similar being battery SOC,fuel economy,battery current,trace velocity and the new parameters included here are motor speed,engine speed,generator speed and motor torque,engine torque and generator torque respectively. Trace velocity pattern is almost similar to that of EV. The battery SOC is seen to be like a sawtooth wave in the first intial half of the time and reshoots back to a constant value of approaximately 76%. It is because here the generator is alternator and not motor. In case of an EV the motor acts as a generator. In case of comparing engine torque,motor torque and genertor torque the motor torque is the highest for around 150 -155 Nm. It is observed between the second and third acceleration cycle. There are 3 acceleration nd decelleration cycles with respect to torque display then for some time the vehicle is turnes on but is at rest position and for the final time the torque is seen to be predicable patterns of drive cycles. In terms of fuel economy the initial 1/4 th of the total time the fuel consumption is maximum in the range of 80-100 MPG and it falls to lower in the next 3/4 th of time with almost negligible variance in the fuel consumption in the range of 20-30 mpg. Battery current is peculiar to the generator torque pattern.