Week-11 Challenge: Braking
Q:1: Braking energy for a drive cycle
- In general the energy required to stop the vehicle would be equivalent to the inertia of the vehicle. Since the vehicle is moving with some speed, it has some kinetic energy so the braking force required for braking would be 1/2 mV^2 where mass is in kg and velocity is in m/s. Then the total energy required would be in Watt-hours.
- Under no brakeconditionsn the time taken to lower the speed from 100kmph to 0kmph is 175seconds. So the distance covered until the vehicle fully stops is 2km. This is known as the coasting effect.
- Coasting effect takes place because on the vehicle there are certain forces like air drag and rolling resistance.
- Due to these forces the vehicle can cover large distances.
- If we compare the total amount of energy with traction power and total braking power; the traction on the wheels is the addition of all drag forces and braking forces. Braking forces add up all their effects and there may be an ample percentage of the traction force.
- At every instant the traction force is increased to some extent. Therefore the braking energy is also increased by those factors.
- Therefore cumulative energy is a significant percentage of the total amount of traction power.
- This is going to be affected by drive cycles as well.
- Drive cycles are going to affect based on their nature where you have frequent start stops or negligible start stops. In other words, it could be the urban or highway drive cycle.
Energy Efficiency Of Cars
- IC engine cars are having very low efficiency because they run on conventional fuel and they do not have motor and motor drivers and controllers.
- The U.S Department of Energy(DOE) did a survey for calculating braking force energy for cars under two situations. First one was highway condition and second was urban condition.
- The results for which where as follows:
1:Urban drive cycle results:
|standby 17%| |-->|Accessories 2%|
| l````````````` ~,~,~,~,~,~,~
| ~'~'~'~'~'~'~
| | |---->|Aerodynamic drag|
| |================>|Rolling drag 4%|
Fuel 100----->|Engine|----19%----->|Drivetrain 13%|-----------------> | |-----> |Braking 6%|
| | |
| | |
v v ~,~,~,~,~,~,~,~
|Engine Losses 6%| |Drivetrain loss 6%| ~'~'~'~'~'~'~'~'
From the above example, the braking force for an urban drive cycle is seen to be 6% of total energy and the energy conversion ratio is 13%/6%=13:6.
Similarly For Highway drive cycle also the energy conversion ratio is 2%/20%=10.
Moreover given below is a datasheet of some practically noted values of certain parameters essential for calculating the braking force for a particular vehicle.
Following is a calculated parameter for different drive cycles.
| Drive Cycles |
FTP75 Urban |
FTP75 Highway |
US06 |
ECE-1 | NYC-New York City |
| Maximum speed(Km/hr) | 86.4 | 97.7 | 128.5 | 120 | 44.6 |
| Average speed (Km/hr) | 27.9 | 79.3 | 77.5 | 49.9 | 12.2 |
|
Total traction energy(KWh) |
10.47 | 10.45 | 17.03 | 11.79 | 15.51 |
|
drags(KWh) |
5.95 | 9.47 | 11.73 | 8.74 | 4.69 |
| Total energy consumed by braking (KWhr) | 4.52 | 0.98 | 5.30 | 3.05 | 10.82 |
| Percentage of braking energy to total traction energy (%) | 43.17 | 9.38 | 31.12 | 25.87 | 69.76 |
measured on driven wheels
---------------------------------------------------------------------------------------------------------------------------------------------
Q:2-
- Let us consider three wires RYB-(Red,Yellow,Blue) representing the three phases and one of the wires is cut off or open circuited.
- In this case, the motor experiences a single phase supply and that is called single phasing of 3 phase induction motor.
- The torque developed by single phase supply is the resultant of positive sequence voltage.
- Here , the positive sequence voltage will be equal to negative sequence voltage i.e==> Vp=Vn
- The equivalent circuit analysis graph is as shown below:
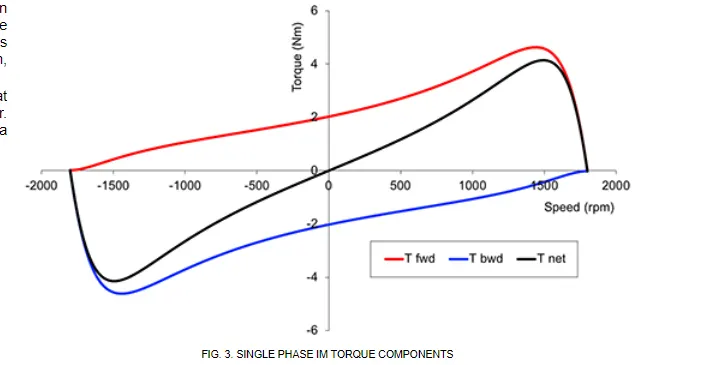
- RYB is the positive sequence and
- RB Y is the negative sequence
- The resultant is a single phase torque
* The black curve passes from 0 and in positive quadrant
The starting torque for positive phase is 2 and for reverse phase is -2. Hence for single phasing it is 0.
Hence we can say that induction motors are not self starting. At zero speed the net torque is zero
So you need to make sure that the phase wire is connected Or if the vehicle is already running in case of an EV , one of the phases is disconnected purposefully leading to single phasing of motor which lead to reduced torque production. And the motor will be experiencing braking.
___________________________________________________________________________________________________
B_R_A_K_E____F_O_R_C_E_____D_I_S_T_R_I_B_U_T_I_O_N
||
||
Regenerative braking <------ ------------>Front
Mechanical braking <------- ------------>Rear
The break force on the rear and front wheels is seen exponentially increased with slightly higher force on Front angle axle. This does not mean that there should be no rear axle wheel brake.
- Another things to be considered is how much energy can be stored back and how much energy required in mechanical brakes. Also the driving direction should not change.
- In practical cases the combination of two brakes is seen to be efficient.
- Peak acceleration torque and peak deceleration torque are not equal in case of EV motor. Accelerating torque is higher and deccelerating torque is lower.
- Brake control strategies are 1-Series - one after another (regenerative or mechanical)and
- 2- parallel Both at a time i.e. regenerative + mechanical
- Classification is based on whether you want comfort of driver or brake behaviour compared to enery efficiency.
---------------------------------------------------------------------------------------------------------------------------------------------
Q:3:%Matlab program to plot contout plot of efficiency and speed , torque
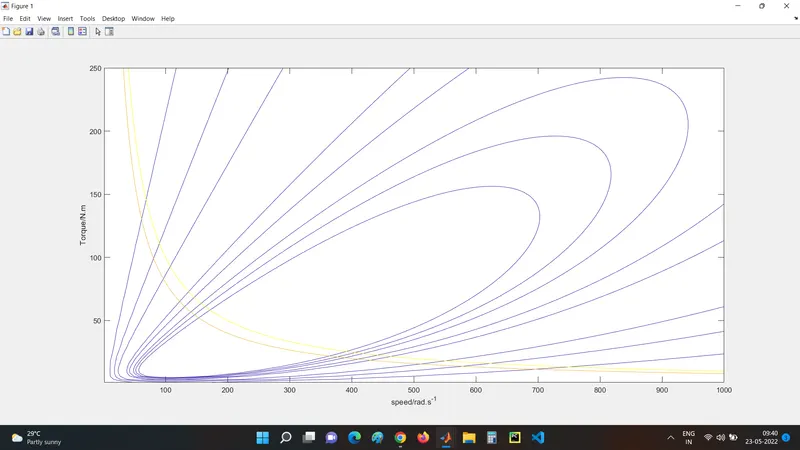
Following is the output figure for efficiency of motor versus speed and torque.
- contour plot of a matrix: contour(z) creates a contour plot containing the isolines of matrix z, where z z contains the values of height on the xy plane. MATLAB automatically selects the contour lines to display. The column and the row indices of z are the x and y coordinates in the plane respectively.
- contour(X,Y,Z) specifies the X and Y coordinates for the values in Z.
- The function linspace is used here to generate linearly spaced vector.
- As seen in the figure the speed of the motor is taken on X-axis and torque is taken on Y-axis.
- Then the motor loss constants are allocated in a matrix.--Kc is for copper loss,Ki is for iron loss,Kw is for windage loss,and ConsL is for constants losses respectively.
- The function [X,Y]=meshgrid(x,y) returns 2d grid coordinates based on the coordinates contained in a vectors x and y. X is a matrix where x is a copy of X and Y is a matrix where y is a copy of Y.
- Output power = Torque X speed
- We need to set the efficiencies for which the contour will be plotted.
- Box off removes the box outline around the current axes by setting their box property to off. This property value is the default for axes and polar axes objects.
- The array output power has already been calculated. So we draw curves at 3and 5 KW respectively .\
In this way the matla program for plotting the contour plot of efficiency,speed and torque of an induction motor is plotted.