Week-4 Challenge WOT Condition Part-2
1. What is the difference between mapped and dynamic model of engine, motor and generator? How can you change model type?
Solution:
Difference between Mapped and Dynamic Model of engine, motor, and generator.
| Sr No. | Parameters | Mapped model of Engine | Dynamic model of Engine |
| 1 | Features | In Mapped models, the data used for the operation and simulation are to be entered in a form of lookup table which would be then configured with the operational parts and the analysis would be formed. | In Dynamic model, it understants the behavior of the part/element and then it behaves accordingly. It gives detailed analysis for the variations entered by us in the specifications whereas it simulated accordingly to real and dynamic operations. |
| 2 | Implementation |
Model uses a set of steady-state lookup tables to characterize engine performance. The table provides Overall engine characterize, including actual torque, fuel, flow rate, and engine-out exhaust emissions. |
Model decomposes the engine behavior into engine characterstics that are seperated into lower level components by combining components in this way, the models capture the dynamic effects. |
| 3 | Engine | Engine performance could be simulated with the array of data interpreted in the system. Whereas all conditions such as Engine operations, power, efficiency could be measured accordingly. | Engine performance will be simulated as per the original/real engine specifications of the designated vehicle chosen for the simulation. All the results would be obtained with real-time details. |
| 4 | Motor | Motor specifications such as rpm, maximum efficiency, heat and such specifications are to be entered for simulating the results | The actual details for the same would be considered and the results would be obtained. |
| 5 | Generator | Specifications for Battery torque, Battery current, Motor torque, and others are to be entered for simulation. | All details and specifications would be considered as per the actual and dynamic state the results of the same would be obtained then. |
Steps followed to change the model type:
- Select model which we want to configure.
- Choose varient manager.
- Right click the model we want to choose.
- Set as label mode active choose.
2. How does the model calculate miles per gallon? Which factors are considered to model fuel flow?
Solution:
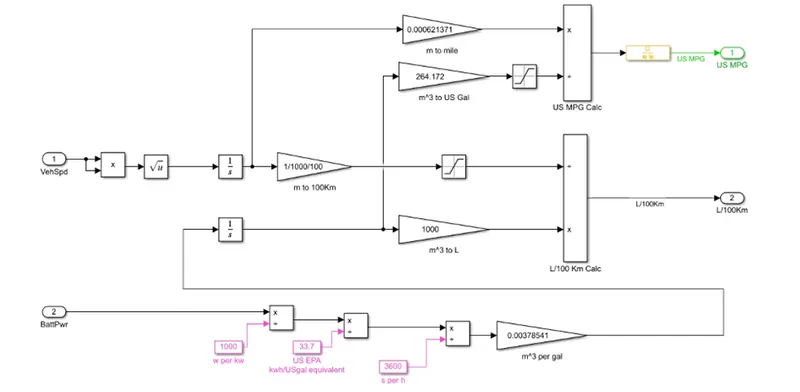
How model calculates the miles per gallon are as follows;
- Vehicle speed(VehSed) is multiplied and a square root is taken. (i.e. speed is converted into acceleration)
- Then this acceleration value is again integrated.(i.e. acceleration is converted into distance)
- This value of distance is converted from meter to kilometer.
- Finally Upper & lower limits are described.(i.e. Upper limit = inf & lower limit = 0.001)
similarly,
- Battery power(BatPwr) power is multiplied by 1000.(i.e. battery power is converted from watt to kilowatt).
- Then this battery power is added with 33.7 and 3600 respectively. asper standards.
Finally, all the values are multiplied as per the standards and we get the output as miles per gallon.(i.e. MPG)
Factors considered to model fuel flow are as follows;
- Vehicle Speed.
- Battery Power.
- Fuel Flow.
3. Run the HEV ReferenceApplication with WOT drive cycle. Change the grade and wind velocity in the environment block. Comment on the results.
Solution:
Simulation Model:
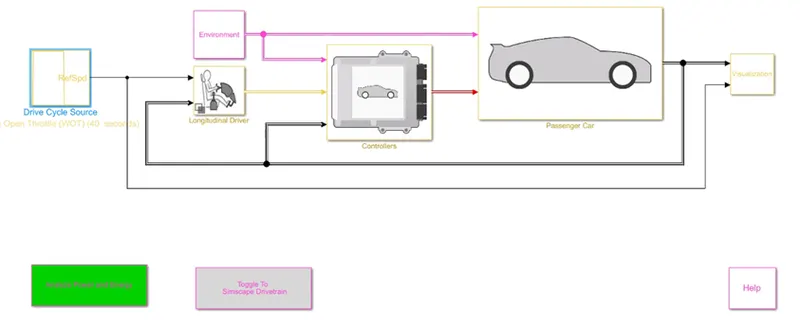
Results:
Observation:
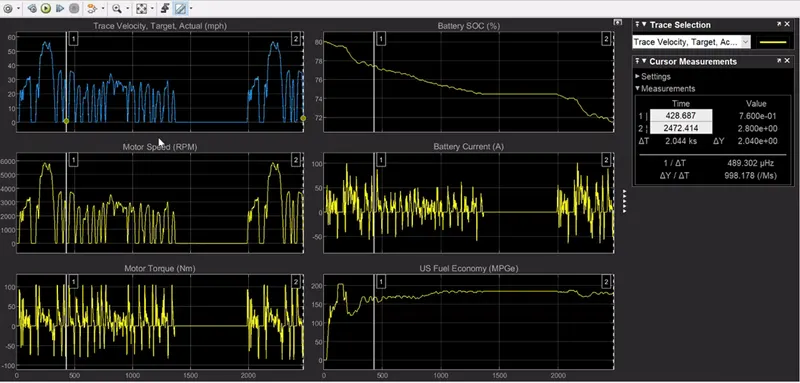
- The simulation time for a model is 2472.414 sec.
- SOC "state of charge" of a battery is shown in the graph, which indicates battery was 80% charged and wasn't 100% or fully charged, and it can be seen that as the time passed, the SOC value reduced to its minimum value.
- It can be seen that the graph of motor speed(rpm) and Trace velocity, Target, Actual (mph) is almost same.
- Motor speed (RPM) graph & Motor torque (Nm) graph is inverse with each other; i.e. when Motor speed increase, Motor torque decrease. And vise varsa.
- When Motor speed (RPM) is zero, Motor torque (Nm) is also zero.
- It can be observed that the fuel economy (MPG) at the start has increased suddenly from 0 to 200 & it again decreased and got stable at 175, after 400 seconds.
- Motor speed (RPM) values are positive in a range of 0 to 6000, but the Motor torque (Nm) values are positive & negative both in a range of -100 to +100.
4. Keeping all other parameters same, compare the simulated results of hybrid and pure electric powertrains.
Solution:
Simulation Model:
Results:
Observation:
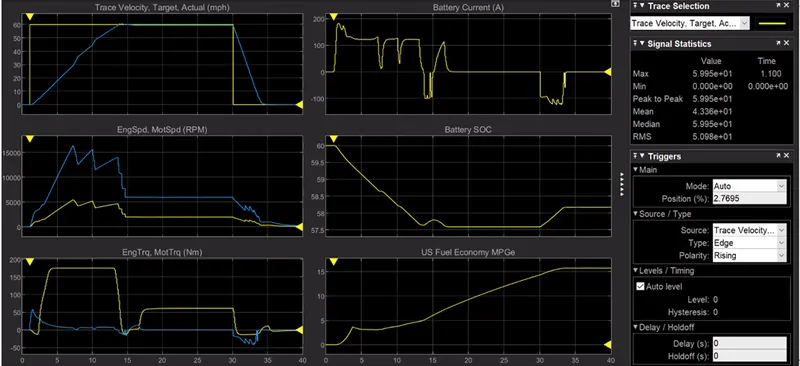
- Yellow line is the Reference line while the Blue line is the Actual performance.
- SOC "state of charge" of a battery is shown in the graph, which indicates battery was 60% charged and wasn't 100% or fully charged, and it can be seen that as the time passed, the SOC value reduced to its minimum value.
- It can be seen that the Velocity(mph) is getting a sudden rise from 0 to 60 in a second which is practically not possible and can be seen in the actual performance that it is getting increased linearly from 0 to 60 and then got stable.
- There's a wide difference in the motor speed/Engine speed(RPM) of Reference and Actual performance.
- Similarly there's a huge difference in motor/Engine torque(Nm) of Reference and Actual performance.
- It can be observed that the fuel economy (MPG) at the start was zero and getting increased linearly from 0 to 15 and got stable at 16 , after 33 seconds.