Week-4 Challenge WOT Condition Part-2
Q1. difference between mapped and dynamic model
Ans: -
| Sr. no | Mapped model | Dynamic model |
| 1 | This is analysis with uses fixed data as a standard look up table. | This is analysis with uses the real time data |
| 2 | This time of models is less accurate | This type of models is more accurate |
| 3 | we can't change the input in running condition | we can change input in running condition |
| 4 | This model we not require subsystem data | This model we require subsystem data |
Q2.
Ans: -
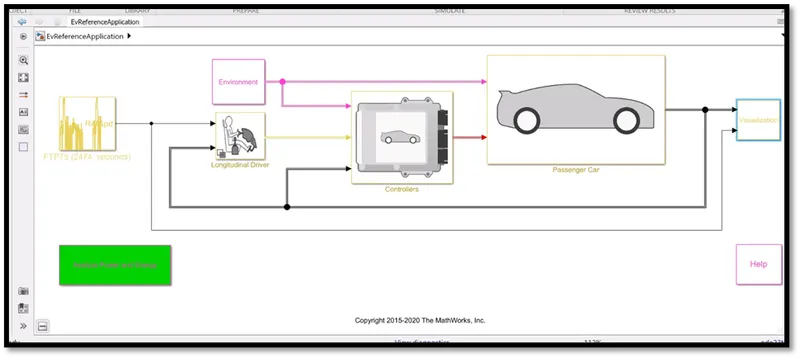
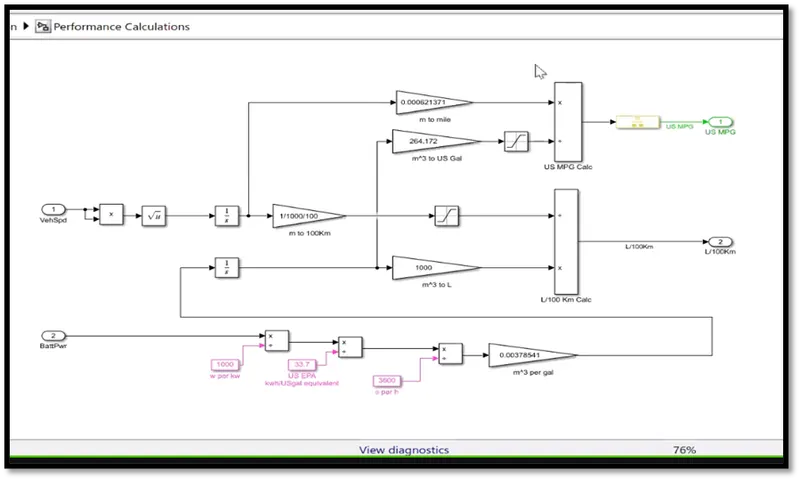
1. We are calculating here a mileage of vehicle which is in miles per gallon. it is a us standard unit.
2. So, the energy source here is battery which power is converted in kw first.
3. Then divided by 33.7 and 3600 to convert value in kwh/gal then converted into m^3/gal. integrated all value with respect to time.
4. Then fuel flow value is converted into gallon and used as input with upper and lower limit
5. We take velocity as input but the velocity is also negative so we take square root of velocity.
6. After that we take integration of velocity with respect to time and distance
7. We have to change the unit of distance from m to km
8. Then we decide the upper limit and lower limit in saturation
9. Lastly, we divide the integration of velocity with integration of fuel flow.
Q3.
Ans: -
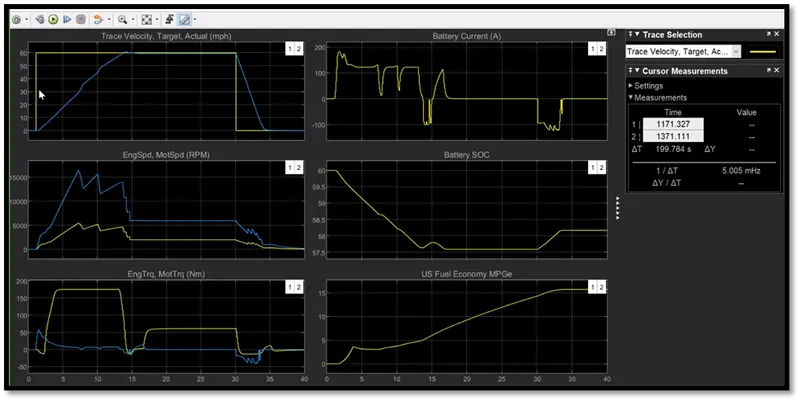
Results: -
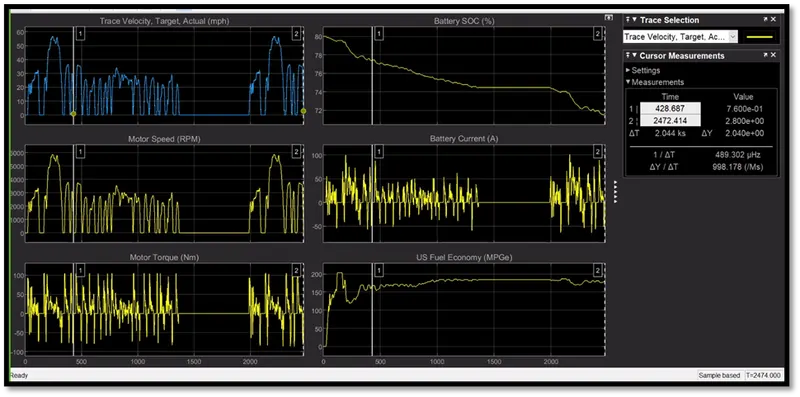
1. The actual drive cycle is different than the ideal drive cycle
2. Engine speed and motor speed also vary than ideal speed value.
3. Engine torque and motor torque also vary than ideal torque value.
4. Battery current is depended on acceleration when acceleration increase battery current also increased
5. Battery SOC decreasing gradually also charging happened in deacceleration and breaking. (Regenerative braking)
Q.4
Ans: -
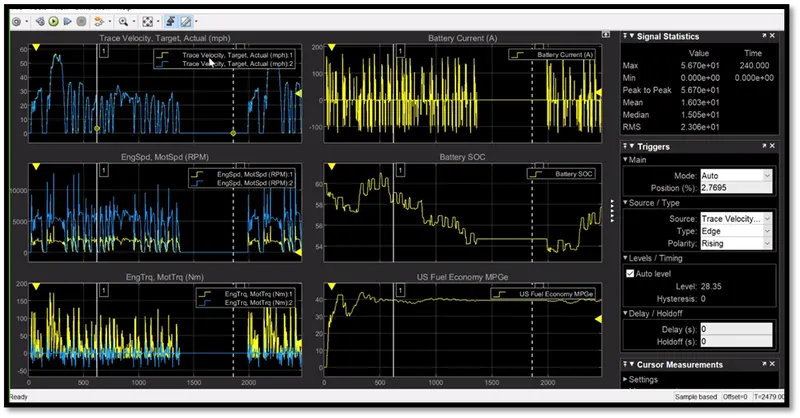
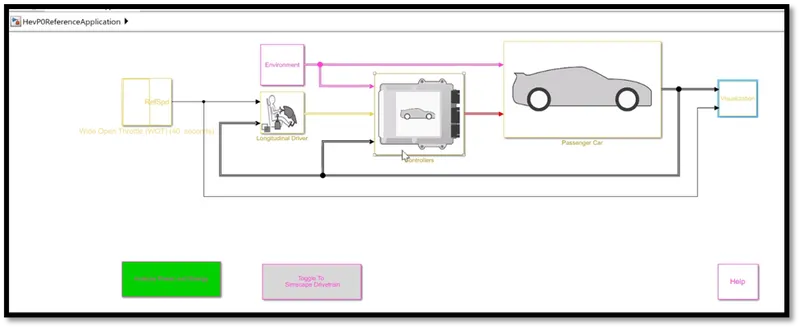
From the above two figures we can compare the results for hybrid and pure electric vehicles.
1. for HEV the actual drive cycle graph and ideal drive cycle are slightly different. but for EV it's exactly the same.
2. for HEV the speed is better than the ideal cycle but for EV its similar to velocity graph.
3. for HEV torque is comparatively lower than ideal graph but for EC it's similar to battery current.
4. for HEV battery SOC is decrease as distance cover but same time regenerative braking also happens but in EV battery drain from 80 to 70 no regenerative braking happen.
5. for HEV and EV the fuel economy graph is almost same but more battery capacity required in EV than HEV