Week -1 Simulink Challenge
1. AIM: -
- Plot a function y(x)=(x-1)⋅(x-3)2⋅(x-9)2">y(x)=(x−1)⋅(x−3)2⋅(x−9)2y(x)=(x-1)⋅(x-3)2⋅(x-9)2 using basic Simulink blocks.
- To run Simulink example “Suspension System Comparison”.
2. OBJECTIVE 1: -
- Plot the given function y(x)=(x-1)⋅(x-3)2⋅(x-9)2">y(x)=(x−1)⋅(x−3)2⋅(x−9)2y(x)=(x-1)⋅(x-3)2⋅(x-9)2
2.1 DESCRIPTION: -
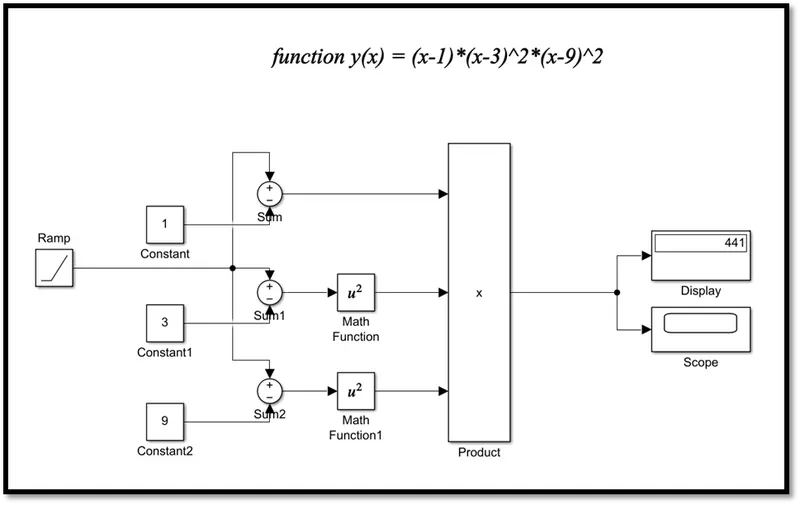
We can solve this function using basic Simulink blocks. In the function the value x is a common variable. Here the value of x is independent. In the function there are some basic factors used in mathematics like multifaction addition subtraction and square. So, we are using the same block for that in Simulink. For independent variable x is given by ramp block which varies with respect to time and the slope is one. We ran the simulation for 10 seconds.
SIMULINK MODEL: -
2.3 BLOCKS USED: -
Ramp: - The Ramp block generates a signal that starts at a specified time and value and changes at a specified rate. The block's Slope, start time, and Initial output parameters determine the characteristics of the output signal.
Constant: - The Constant block generates a real or complex constant value signal. Use this block to provide a constant signal input. The block generates scalar, vector, or matrix output, depending
Sum: - The Sum block is used to addition and subtraction If you use a - sign as the first operation, the block reorders the inputs, if possible, to use a + operation.
Math Function: - The Math Function block performs many common mathematical functions.
Product: - The Product block outputs the result of multiplying two inputs: two scalars, a scalar and a no scalar, or two no scalars that have the same dimensions.
Scope: - Display signals generated during simulation. In simple language shows the graph of output with respect to Simulink time.
Display: - The Display block connects to a signal in your model and displays its value during simulation. The Display block can display complex, vector, and 2-D matrix signals.
2.4 OUTPUT: -
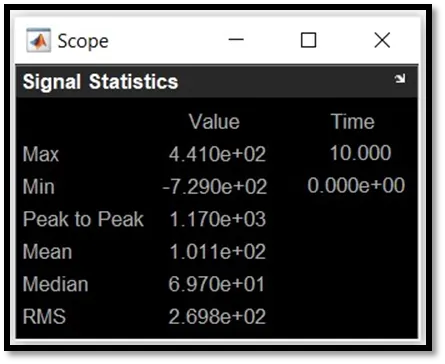
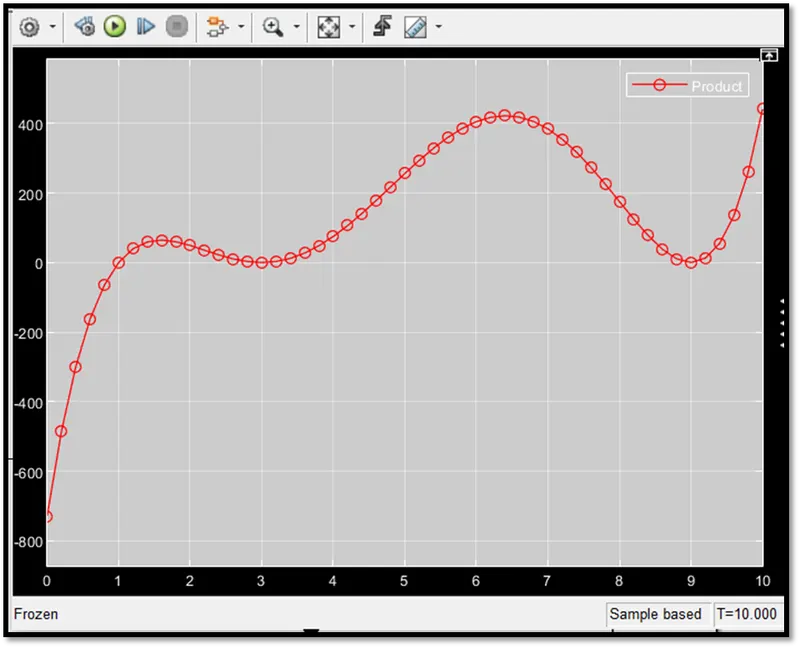
Display: - Output after the completion of simulation is 441.
Scope: - the graph is plotted for function y(x) at each point. The simulation time is 10 seconds with a slope of 1.
3. OBJECTIVE 2: - To run Simulink example “Suspension System Comparison” and answer the following questions,
3.1 MODEL: -
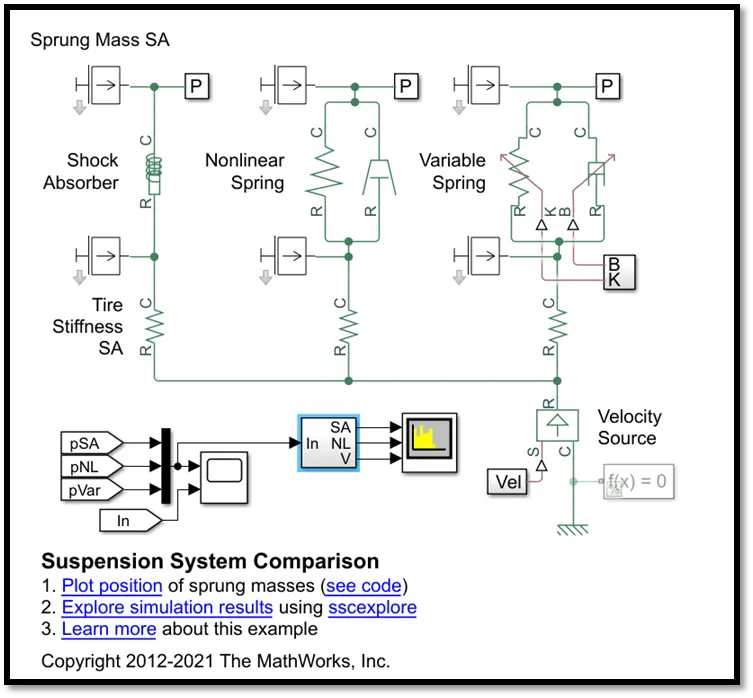
3.2 What is the objective of the simulation? What are the similarities and differences between the three systems understudies?
Objective of stimulation: -
- Save money and time: - Simulation of software takes less time, money and manual efforts with minimum time
- Risk free: - in simulation we don’t have to take more test on actual model we can simulate same model on software to see all behaviour of product.
- Increase accuracy: - the analytical testing is done manually so we have to compromise with accuracy but with software we can increase accuracy because all work is done by simulation software.
- Visualization: - in manual testing we have to take more test to see behaviour of product at each condition. In software we can visualise all testing in one model at a time so no need to multiple testing.
Similarities and differences between the three systems understudies: -
- Velocity source is similar for all three systems and sprung mass and unsprang mass are also similar.
- The first uses the Shock Absorber block and includes linear stiffness and damping. Optional friction and hard stops are not used.
- The second shock absorber uses a Nonlinear Translational Spring and a Nonlinear Translational Damper specified by symmetric polynomials.
- The third uses a Variable Translational Spring and Variable Translational Damper.
- The spring constant is varied during the simulation using open loop control and the damping coefficient adjusts to ensure critical damping is achieved.
- Closed loop control can be added to simulate an adaptive suspension system.
3.3 What are your observations from the results?
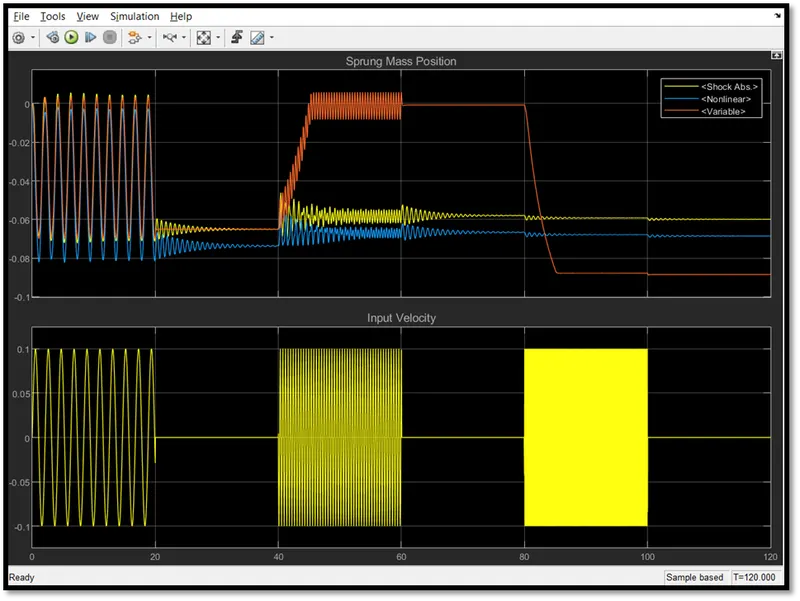
In the above graph of sprung mass position with respect to time as per oscillating velocity source observation as follow,
- For the first 20 sec the oscillating frequency is 3 rad/sec, in all three systems the sprung mass position is almost same in between 0 to -0.8m.
- For 40 to 60 sec the oscillating frequency is 15 rad/sec, the variable transition sprung mass experience maximum vibration as compare to other to system.
- for 80 to 100 sec the oscillating frequency is 75 rad/ sec, the variable transition sprung mass damper damp vibration at -0.9m. linear and non-linear transition sprung mass damper damp vibration at -0.6m and -0.7m respectively
- In shock absorber the damping is done so the frequency displacement is very low.
- The non-linear translation spring consists of unequal springs due to vibration are not damp naturally.
- Variable spring the damping is low due to stiffness was take long time and displacement is very high.
- Shock absorbers have a stale nature as compared to others.
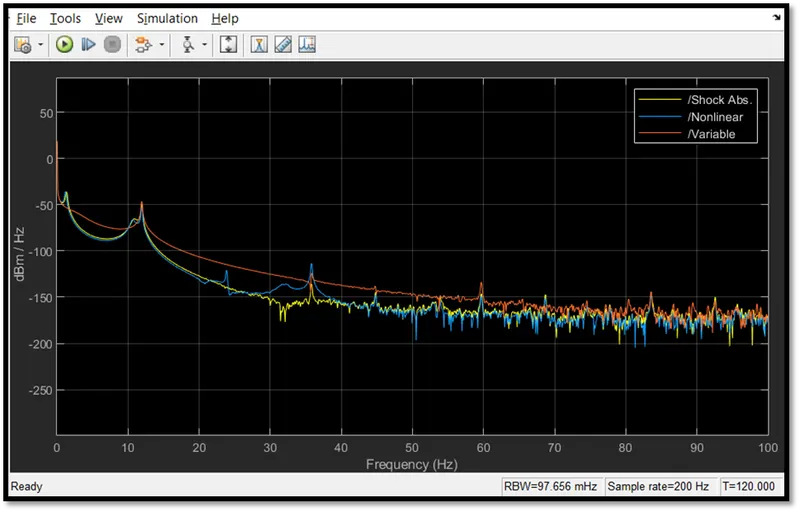
In above graph spectrum analyser, we can observe as following,
In the power spectrum density vs frequency graph as frequency increases, the power spectrum density decreases. For shock absorber it gives stable nature. For other density is relatively high.
3.4 How is the oscillating velocity source created?
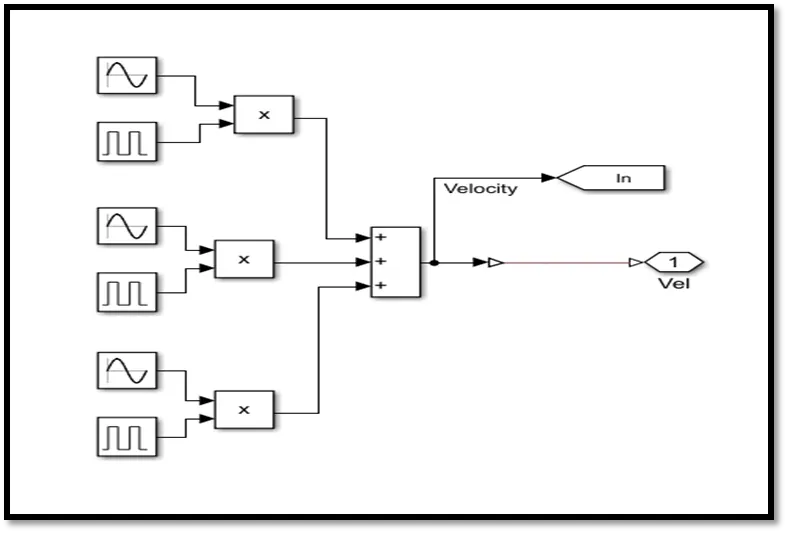
- The oscillating velocity source is created using the three-sine wave and three different pulse generators.
- The time period for every oscillation is given 20 sec with a time delay of 20 sec.
- The output of all sine waves and pulse generators firstly multiply and then add to generate the velocity signal.
4. CONCLUSION: -
We can conclude that we get plot for function using various blocks. On comparison all the system the shock absorber spring gave good stiffness and vibration also low. The nonlinear spring damper gave low stiffness comparatively so the frequency is high. The variable spring damper gives sudden high and low frequency so the stiffness is high. Hence the shock absorber can be used for best damping effect.
5. REFERENCE: -
https://in.mathworks.com/help/physmod/sdl/ug/suspension-system-comparison.html