Week-4 Challenge WOT Condition Part-2
AIM: To study the parameters of powertrain of simulink model.
Objectives:
- What is the difference between mapped and dynamic model of engine, motor and generator? How can you change model type?
- How does the model calculate miles per gallon? Which factors are considered to model fuel flow?
- Run the HEV ReferenceApplication with WOT drive cycle. Change the grade and wind velocity in the environment block. Comment on the results.
- Keeping all other parameters same, compare the simulated results of hybrid and pure electric powertrains.
1.ANS: The difference between mapped and dynamic model of engine, motor and generator
In power train blockset mapped and dynamic model is similar in case of engine, motor and generator.
| S.No. | Characteristic | Mapped model of engine, motor and generator | Dynamic model of engine, motor and generator |
| 1. | Data source | Run simulation using avaliable data. | Run the simulation using actual model. |
| 2. | Used Simulink blocks | Lookuptable | Interior permanent magnet synchronous motor( PMSM) with controller. |
| 3. | Time difference | In this model calculations are very fast. | It is time consuming. |
| 4. | Losses | We need to include losses if present. | It is a real time, no need to include losses. |
Steps of changing model type:
Step1: Go throught the EvReferenceApplication in MATLAB. You will find below simulink block.
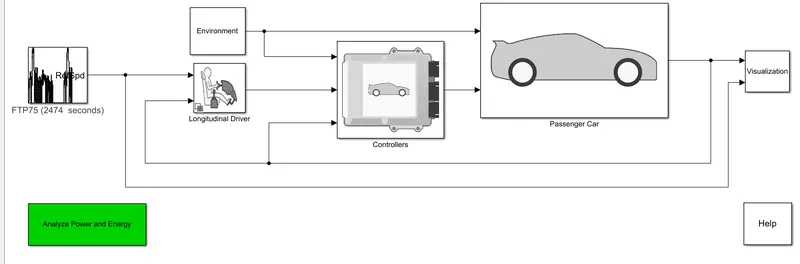
Step2: Open the subsystems as EvReferenceApplication-->Passenger Car-->Electric Plant-->Motor and you will get below page
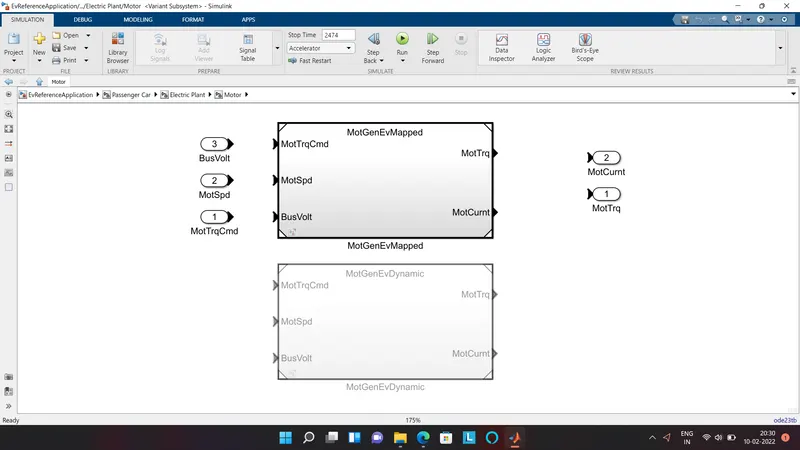
Step3: Rignt Click on mouse Select the open as shown in below image( Variant--> Lable Mode active choice-->
select from two options motgenevdynamic and motgenevmapped based on your requiredment)
Step4: Hence here i changed from MotGenEvMapped to MotGenEvDynamic and viceversa.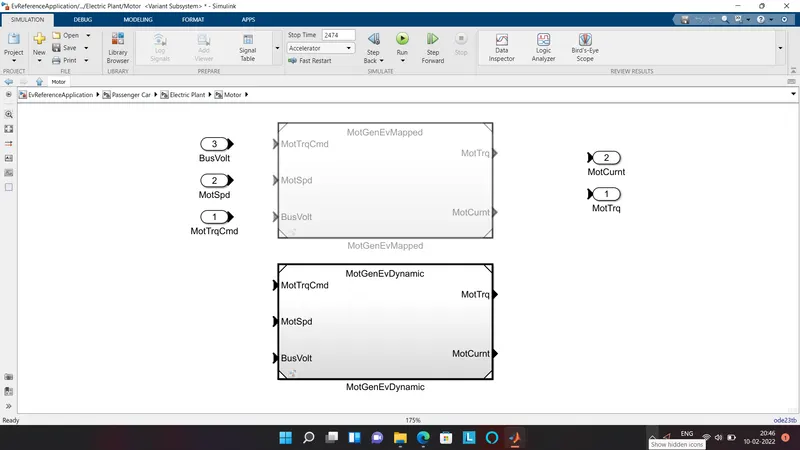
2.ANS: Miles per gallon (MPG) is a fuel economy rating determined by how far a car can travel on a gallon of gasoline or diesel. Although the metric version would be kilometres per litre, MPG is adopted in many metric-system countries, like Canada.
The model calculate miles per gallon:
Taken inputs in this model are
- vehicle speed
- fuel flow
- battery power
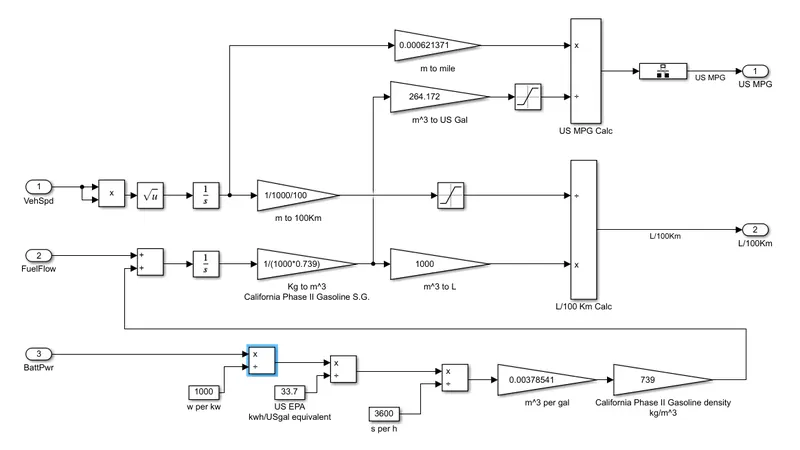
Calculation of miles:
Here integrated the unsigned value of vehicle speed is multiplied with 0.000621371 then we get the total miles travelled.
Step by Step Calculation of Gallons in above model:
1) Battery power is divided by 1000 for conversion from kw to w.
2) After it is converted to USgal equivalent by divided by 33.7.
3) Obtained value is divided by 3600 for converting sec from hrs.
4) It is converted into m*3 per gal by multiplying with constant value 0.00378541.
5) It is multiplied with 739 for converting into california phase II gasoline density and added it to Fuel flow.
6) Total fuel flow is integrated with respect to time then we get the total density and then converted in volume(m*3).
7) and it is converted to US Gallons by multiplying it by 264.172.
Finally obtained the MPG(Miles Per Gallon) from values of Miles and Gallons.
Factors are considered to model fuel flow:
- Level of power stored in the battery.
- Amount of Fuel avaliable.
- Vehicle speed.
3.ANS: The HEV ReferenceApplication with WOT drive cycle.
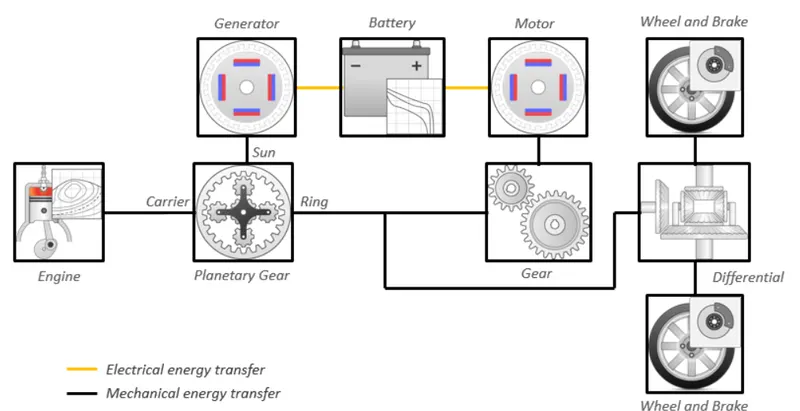
Here provided the block diagram of model of the HEV input power-split reference application
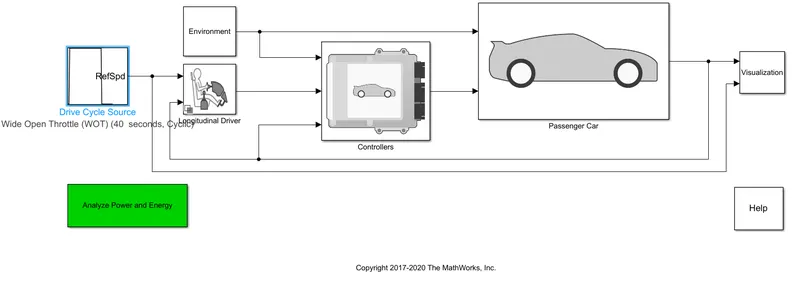
Observe the Simulink model of above block diagram with Drive Cycle Source Wide Open Throttle(WOT) of 40 seconds cycle.
Results: Below results are obtained by running the above simulink model at stop time of 100secs and WOT.
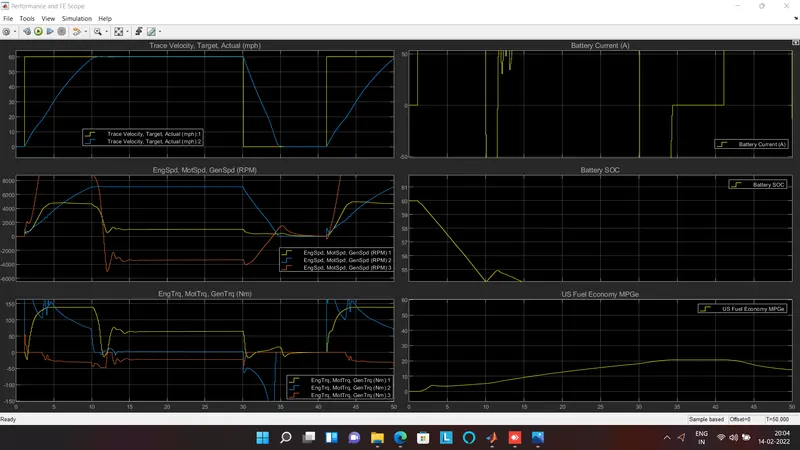
Observations from above graph:
- Speed of the vehicle acheive maximum speed 60kmph in 10sec compared to actual speed.
- Generator speed: Initially generator acheives high speed and then reduces to negative rpm values. At negative values battries gets started.
- Motor Speed: Initailly it goes high when state of charge is high and after it becomes zero when state of charge is low.
- Enginee Speed: It gradually increases to top RPM at the same time the generator and the motor reduces to lower levels.
Results after changing the grade and wind velocity in the environment block:
At stop time 50sec and WOT condition
CASE1: Grade value = 15 & Wind = 0
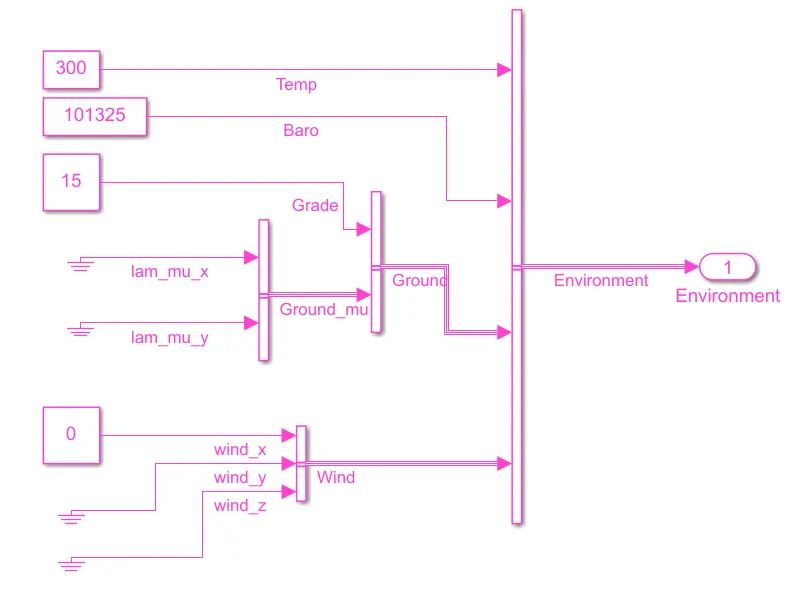
Results:
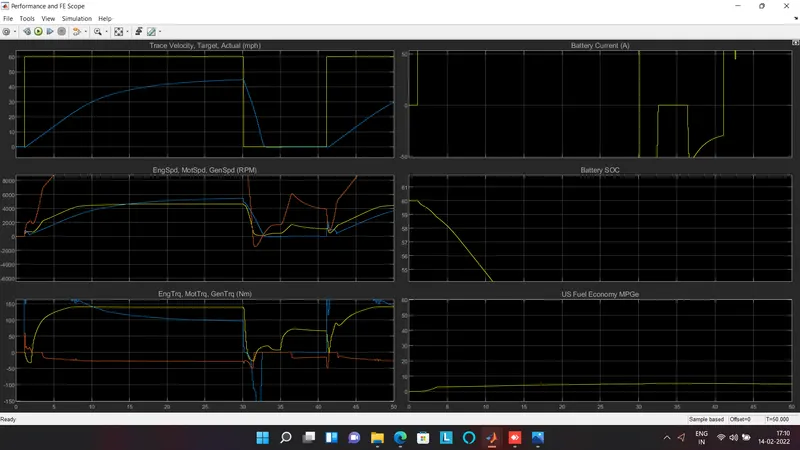
Here overall speed of the vehicle speed is reduced to 45kmph from actual speed of 60kmph. Slightly delayed in speed and torque of the engine
CASE2: Grade Value = 15 & Wind = 20
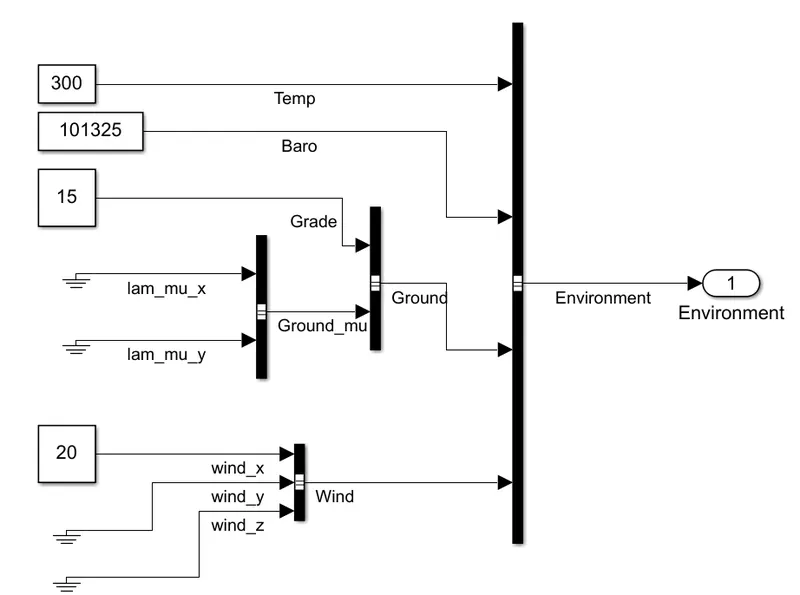
Results:
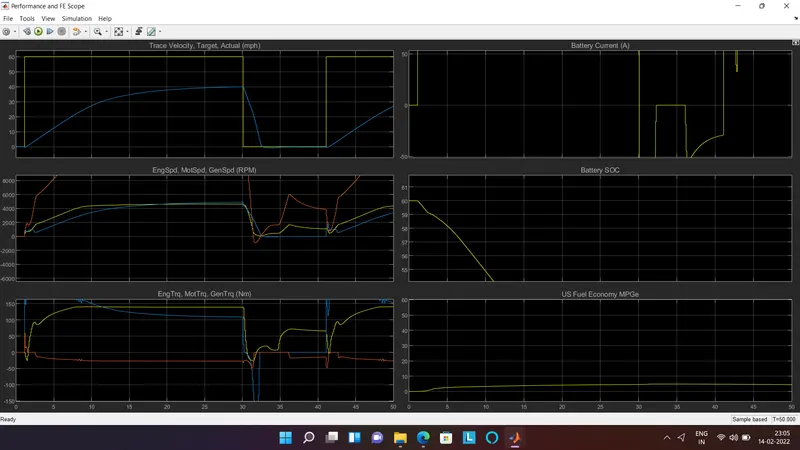
In this case achevied speed of 40kmph and i observed negligible changes in values of parameters.
4.ANS: Comparision of simulated results of hybrid and pure electric powertrains:
By keeping all the parameters same and default values.
Simulated results of hybrid electric multimode powertrains:
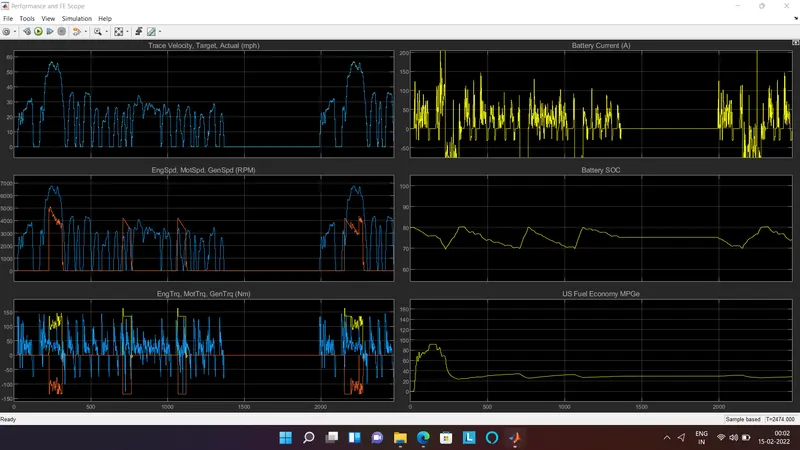
Simulated results of pure electric powertrains:
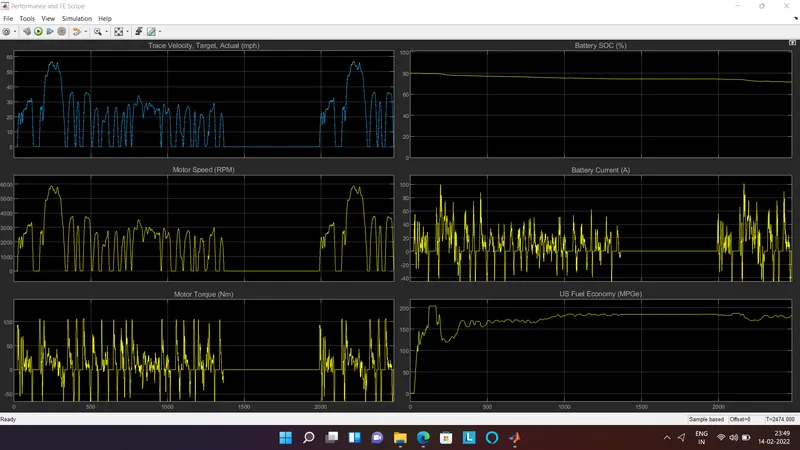
- In HEV battery is charges and discharges continously but in case of EV is continously discharges.
- Motor speed(RPM) is high in HEV compared to EV.
- US fuel economy(MPG) is high in EV compared to HEV.
- Battery current is 200A in HEV is high compared to EV achieved 100A.
Conclusion: Hence understand the behaviours of different powertrain and variations in different parameters. Here obtained the results with different parameters and compared.