Week - 4
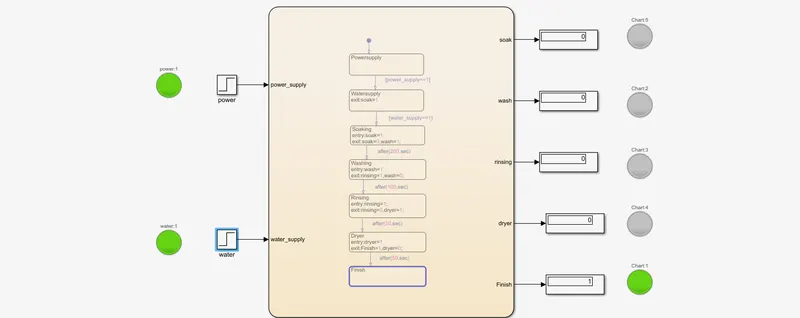
1) Aim: To implement control logic of a “washing machine” using Stateflow as per given sequence:
- If the power supply is available, the system gets activated
- If the Water supply is not available, stop the process & indicate through LED
- Soaking time should be 200s followed by Washing time of 100s.
- Then rinsing happens for next 20s & dryer runs for 50s
After all the processes have completed turn on the finished LED
Stateflow Model in Simulink:
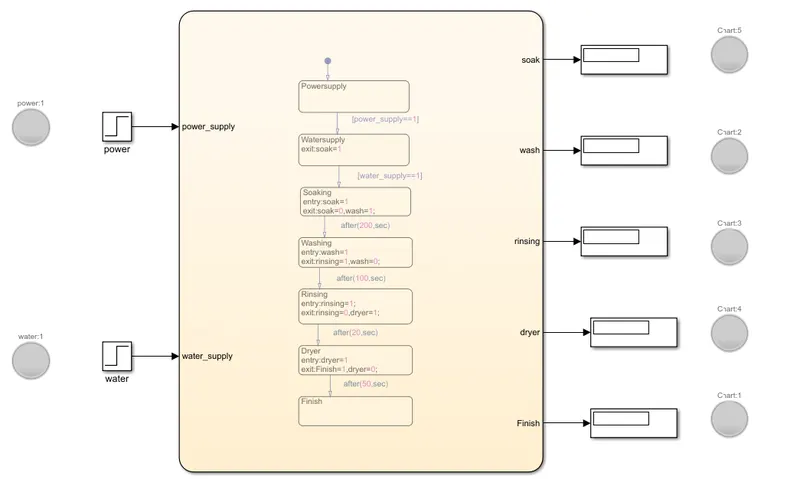
List of Simulink Blocks:
1)Chart: It is the graphical representation of logics in form of flow chart. We can also define inputs and output in chart.
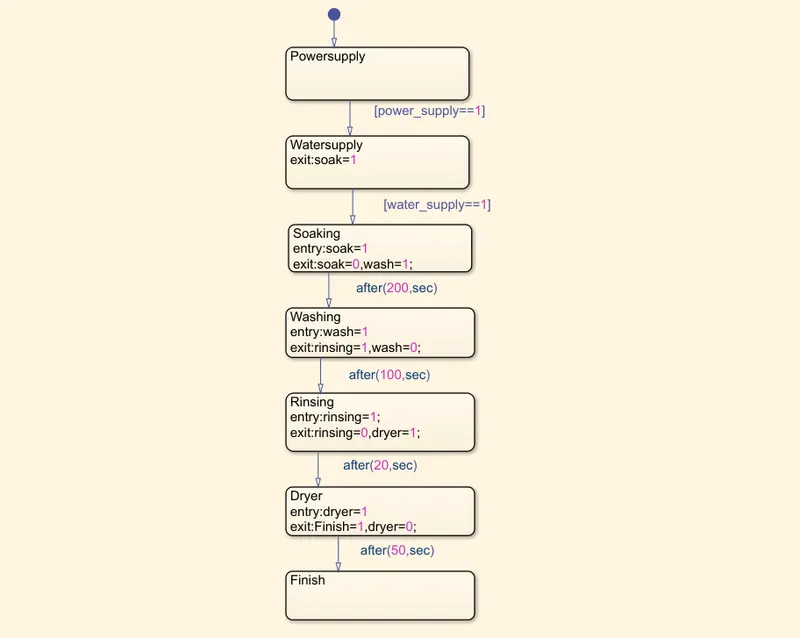
You can find an image above with control logics in the from of flow chart.
2)Step Source: It outputs the step value. Here i am step source as power_supply and water_supply.
3)Lamp: It shows the colour indication based on input value. Here i used different lamp as a indications for stateflow at different stages.
4)Display:It displays the input values.
Procedure of Stateflow Model:
1) Here i designed stateflow in simulink as per the given sequence of a control logic of a washing machine.
2) First step no power_supply and water_supply in simulink as u find in image.
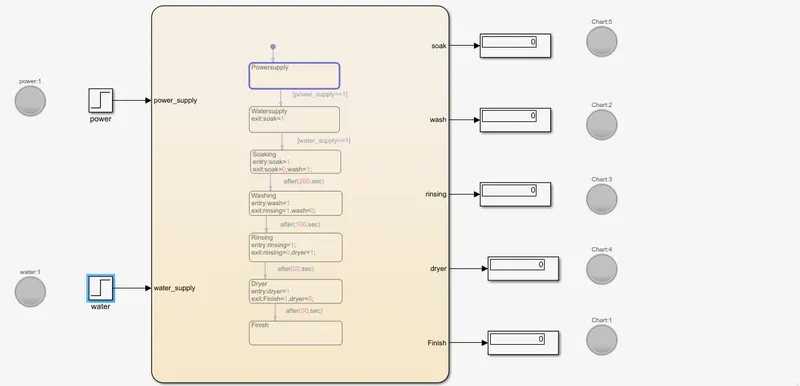
3) At 2nd step provided the power supply to the model. U can observe in the image.
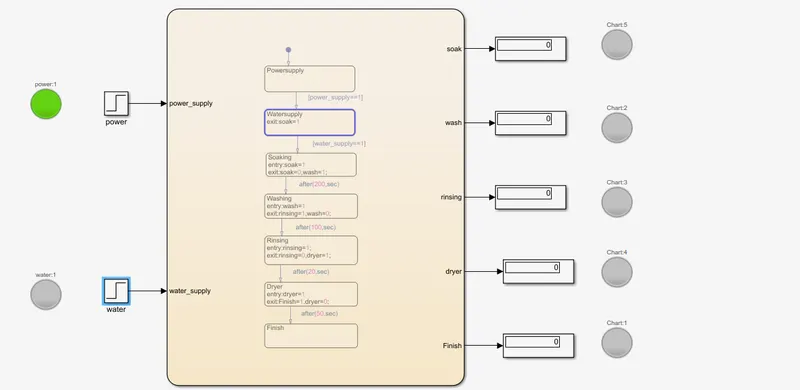
4) Water supply and started soaking also given to the model at 3rd step.
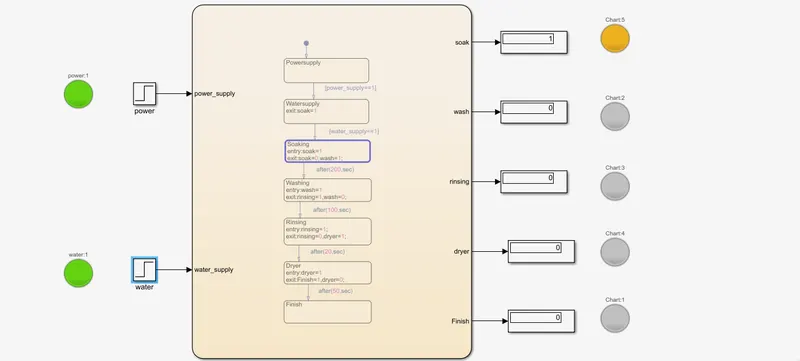
5)After soaking for 200s starts washing as you observing in below image.
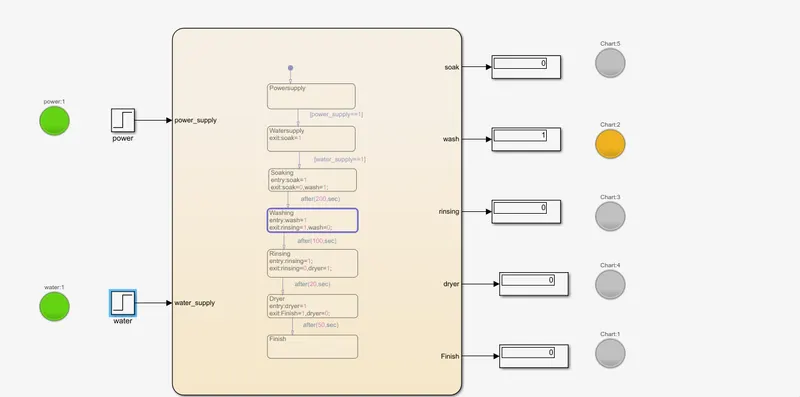
6)Starts rinsing after washing for 100s
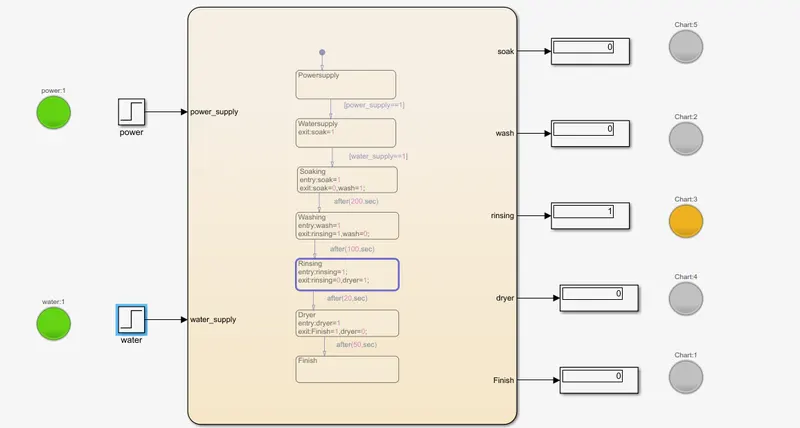
7)Starts dryer after rinsing for 20s as per the given control logic.
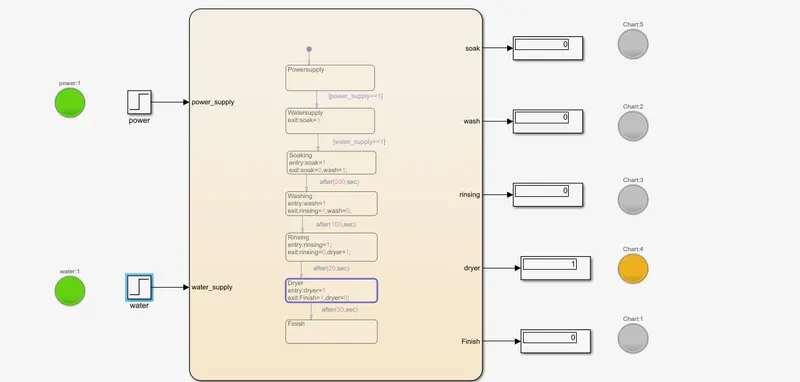
8)Finally after completion of dryer for 50sec, finish lamp starts glowing.
Conclusion: Implemented control logic of a “washing machine” using Stateflow as per given sequence and after all the processes have completed turn on the finished LED.
2) Aim:To make a Simulink chart for the “Gear shift” logic as per below conditions:
Speed Range(kmph) Gear
0 to 15 1
16 to 25 2
26 to 40 3
41 to 60 4
Above 61 5
Give speed input while the simulation is running & display the gear number.
Stateflow model:
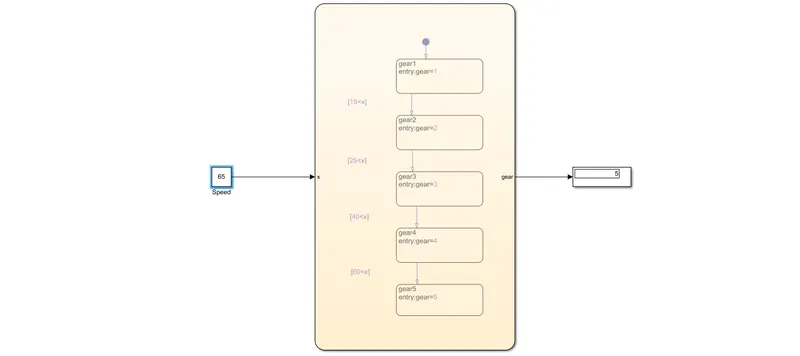
Step by step process of state flow:
1) Given a speed as input to the chart using a contant block.
2) In the chart, i am implemented the different logics as per the given data. Provided different states using with conditions as per the given data.
3) Based on the speed input we get the gear values was shown in the display.
Results:
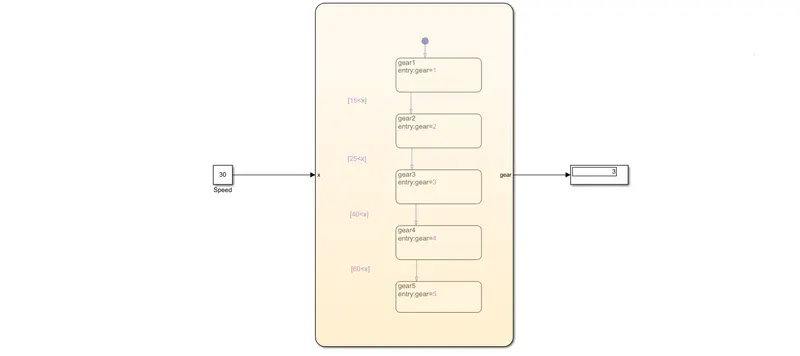
1) At speed of 30 we get gear shift value is 3. As u can observe in below image
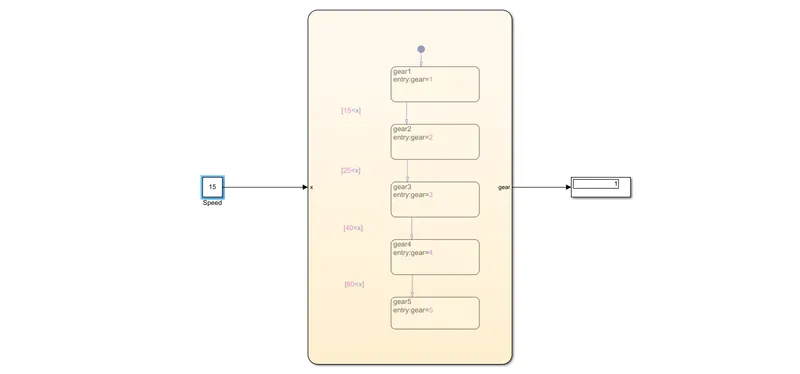
2) At speed of 15 we get gear shift value is 1. As u can observe in below image
Conclusion: Hence given speed input while the simulation is running & display the gear number as per the given condition and also provided some results.