Week-4 Challenge WOT Condition Part-2
Week-4 Assignment
Q1)
Mapped model:
- In this model, the data used for simulation and operation is taken from the look table to characterize the performance of Engine, Motor, and Generator under certain parameters.
- Macro engine behavior is represented by the Mapped engine model as a set of lookup tables
- In a mapped model, if detailed lookup data is available then the simulation becomes very easy, and it gives results based on data interpreted. Also, can be called a global-based model.
Dynamic model:
- In this model it understands the behavior of each element and part and then it behaves accordingly
- For more detailed and component level data to analyze the impact of individuals on Engine, Motor, and Generator components on the overall performance dynamic model are used.
- Detailed data and specifications are not required it operates dynamically depending on the situation.
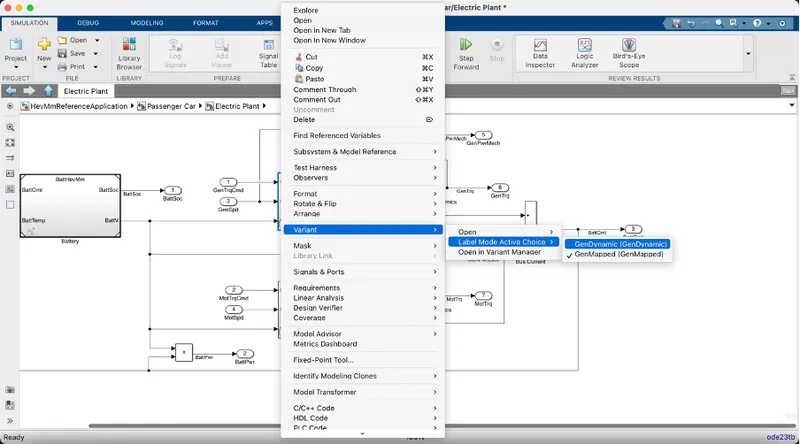
How to change model type :
Reference Application -> Passenger Car -> Electric Plant -> Motor -> Variant -> Label Model Active Choice -> choose between dynamic and mapped
Q2)
The conversion process is mentioned below:
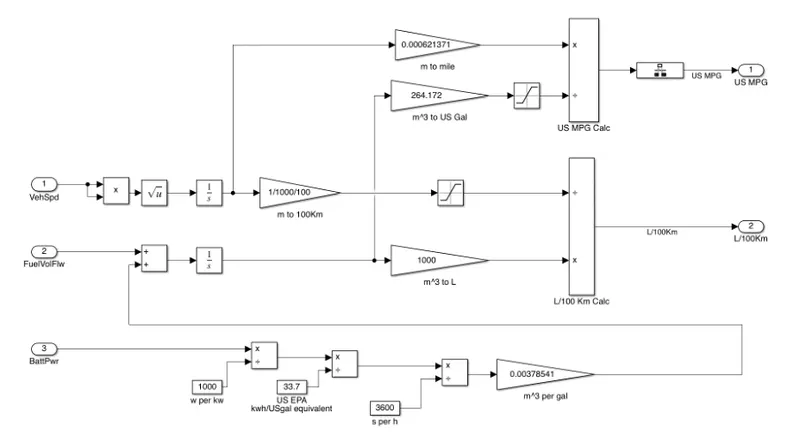
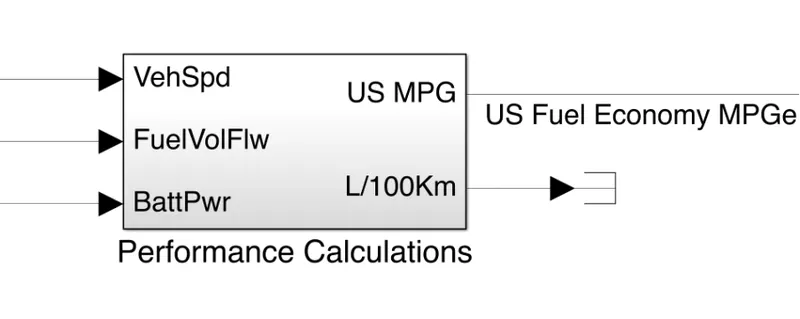
Using Vehicle speed, Fuel, Battery power this simulation model calculates MPG and L/100km.
We know 1000 m^3 is 264.172 US Gallons and we can see the same in simulation.
We can see that US MPG is calculated using vehicle speed miles and fuel volume in gallons.
Factors considered to model fuel flow:
- Vehicle speed
- Fuel volume flow
- Battery power
Q3)
HEV Reference model is configured with mapped motor and generator by default.
Now we are changing the drive cycle from FTP75 to WOT.
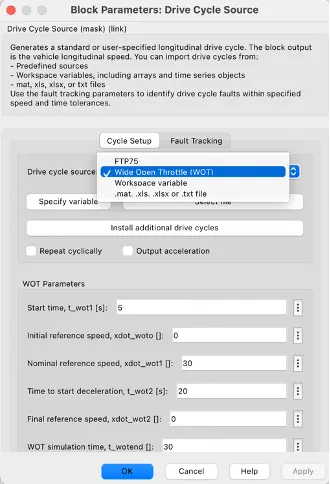
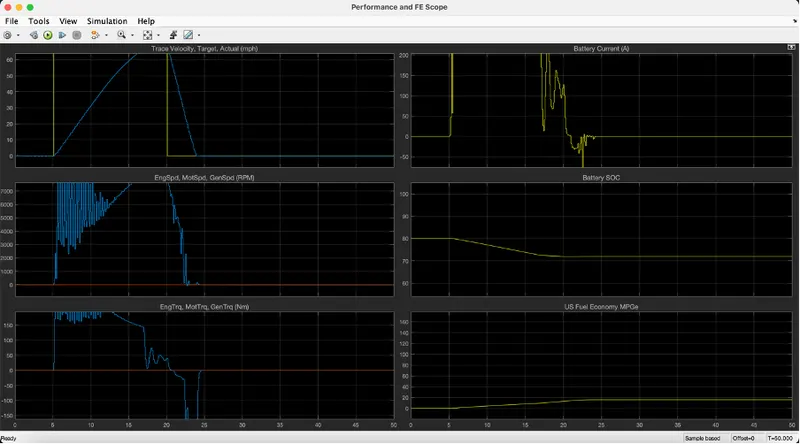
Before changing grade and wind velocity
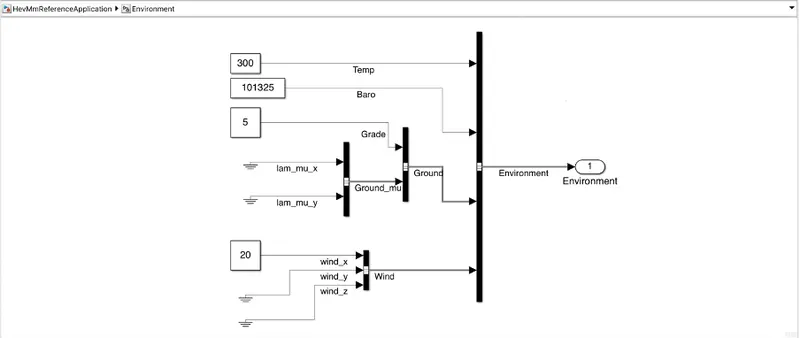
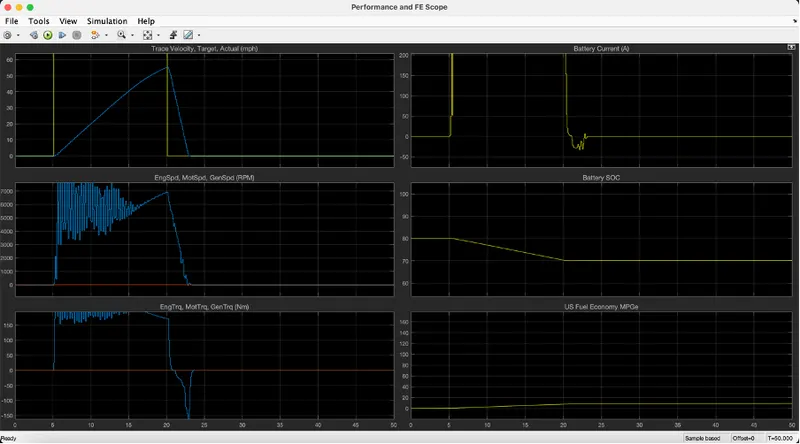
Changed grade to 5 and wind velocity to 20 and runtime to 50.
Plot1:
Trace velocity, Target velocity:- when grade and wind velocity are 0 first model reached target velocity faster.
Plot2:
Engine speed, Motor speed:- when grade and wind velocity are increased target engine speed is not met.
Plot3:
Engine speed, Motor speed:- There have been many variations with respect to time in the second plot after altering grade and wind velocity
Plot4:
Battery current:- Battery is fluctuating at higher levels after altering grade and wind velocity and started fluctuations reaching near steady-state.
Plot5:
Battery SOC:- remained almost the same
Plot6:
Fuel economy:- remained almost the same
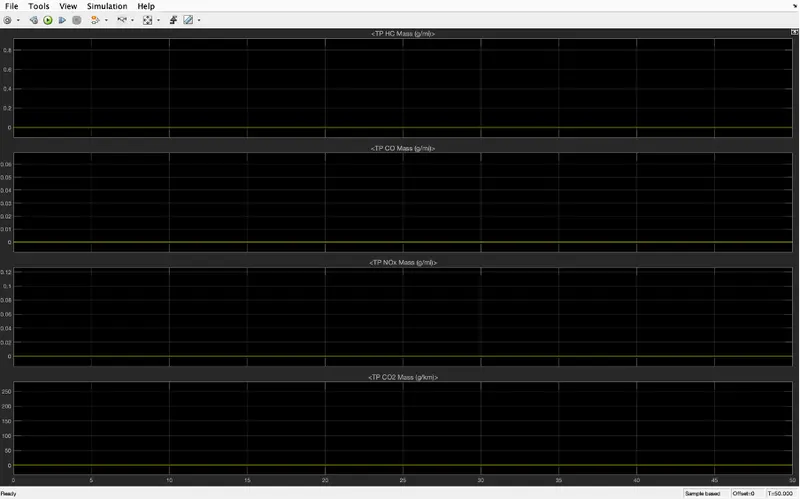
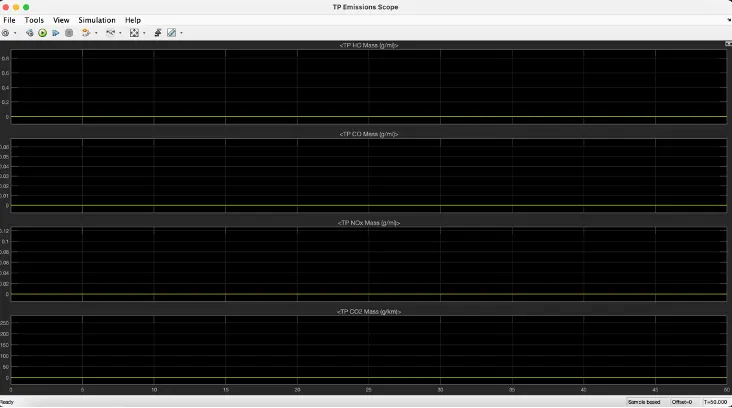
Emissions:-
Q4)
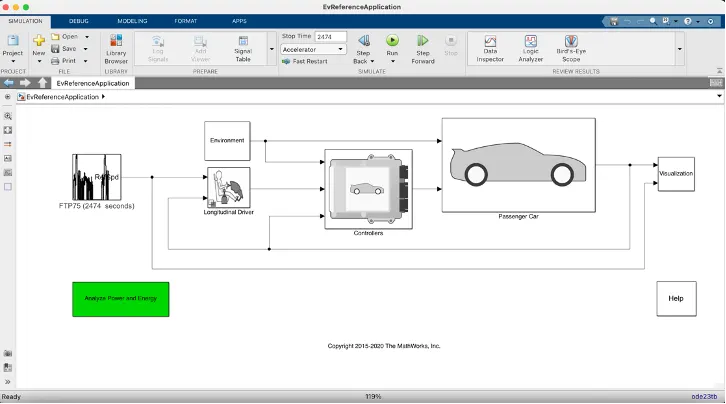
EV
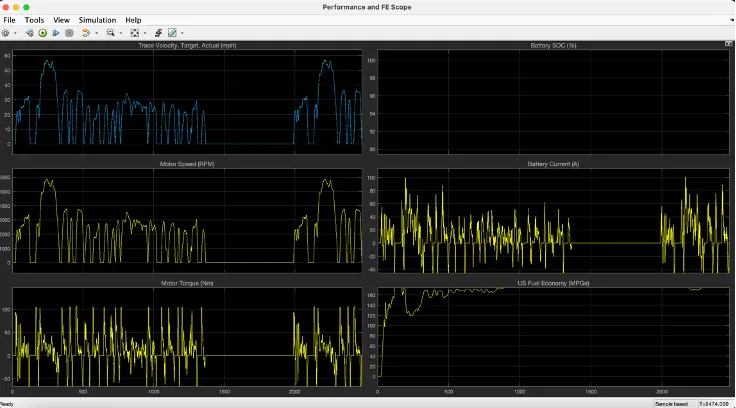
Performance and FE of EV
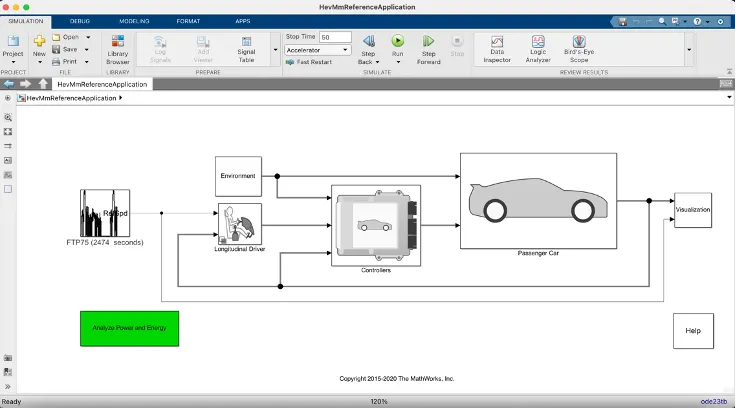
Hybrid EV
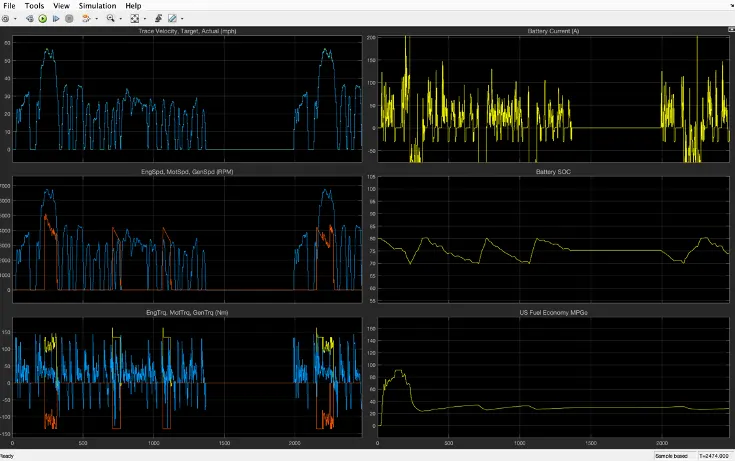
Performance and FE of HEV
Emissions of HEV
We can observe both plots of different parameters of performance is almost similar.
The main difference between hybrid EV and EV is hybrid EV works on power source SI/CI engine and battery whereas EV works completely on battery.