Week-4 Challenge WOT Condition Part-2
1.What is the difference between mapped and dynamic model of engine, motor and generator? How can you change model type?
|
MAPPED MODEL |
DYNAMIC MODEL |
|
It is a global-based, pre-determined model |
It is a real time model |
|
The mapped model uses steady-state look-up tables |
Lower level blocks are put together to form a system. |
|
In mapped generator,the required data are taken from look-up tables with respect to the input parameters. |
In dynamic generator,the required data are entered manually during the run time for the respective application. |
|
Array of interpreted data is used to simulate the effects on an engine |
Real time engine specification is used to find the engine specification. |
|
Motor specifications – Voltage, Power, Temperature, RPM, efficiency, etc should be manually entered. |
Results are as same as the actual motor details |
|
Simulation time is less |
Simulation time is comparitively more |
|
Drawback: More data has to be assumed and collected |
Drawback: Custom preference simulation cann’t be used |
The model is changed as follows:
>>When the system designed with mapped engine, has to be changed with dynamic engine the following steps has to taken:
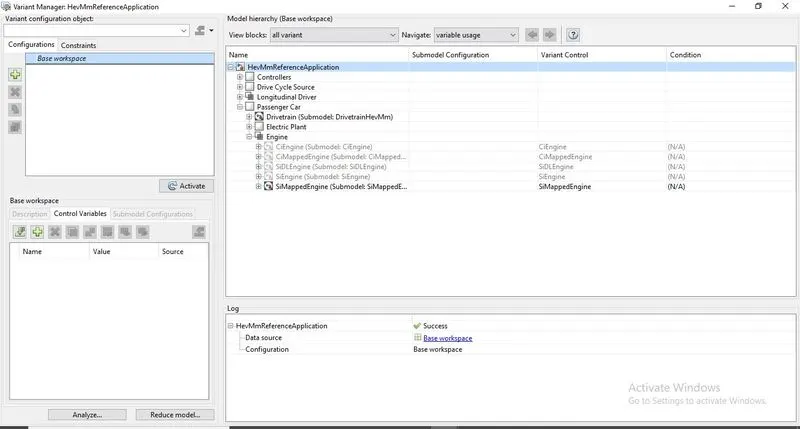
>>“Varient manager” should be opened in the modeling and the below window opens
>>The model in the system are listed
>>The drop down of the engine block has to the clicked, which lists the varients that could be activated
>>This way for an engine SI mapped engine, IC mapped engine, SI dynamic engine and IC dynamic engine could be used.
>>Similary, the varients can be changed for generator & motor.
Q2. How does the model calculate miles per gallon? Which factors are considered to model fuel flow?
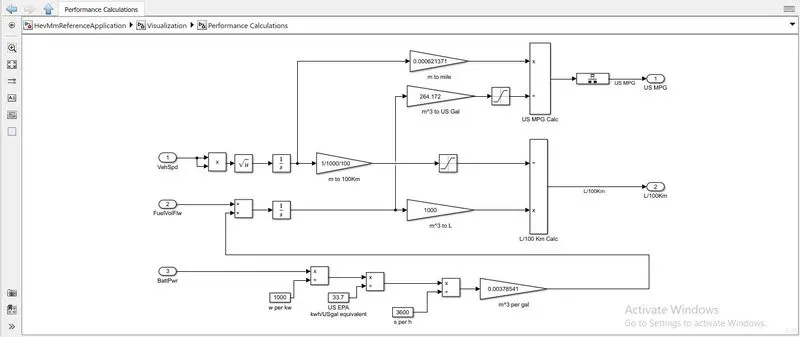
>> The batter power in watt is converted to kilo watt by dividing it by 1000.
>>The power (kW) is divided by 33.7 to convert it to kilo watt hour (kWh) or US gallon equivalent (gal).
>>The kWh is divided by 3600 to convert it to seconds, which is further multiplied by 0.00378541 to get the "meter cube per gal" value.
>> The fuel volume flow is divided with the battery power (m^3/gal) is integrated.
>>The square root of vehicle speed integrated to get the distance in meter (m).
>>This integrated fuel volume flow is also converted to US gal by multiplying it with 264.172.
>>The distance (m) is converted to mile by multiplying it with 0.000621371 and divided by the saturated fuel volume flow (US Gal) and sent through a rate transition block.
>>This how the fuel capacity is converted to US mile per gallon (MPG).
b.>>The factors considered for model fuel flow are as follows:
1.Vehicle speed
2.Fuel volume flow
3.Battery power
Q3. Run the HEV ReferenceApplication with WOT drive cycle. Change the grade and wind velocity in the environment block. Comment on the results.
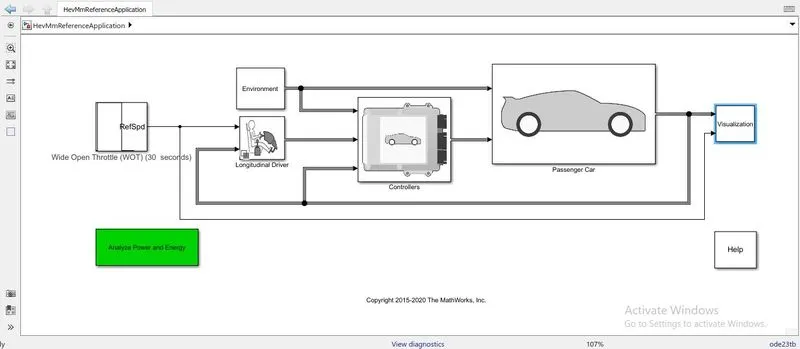
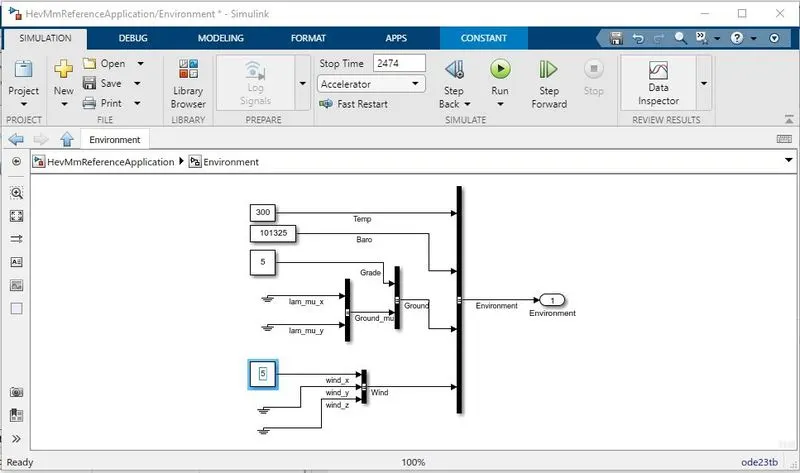
>>The HEV reference block is loaded
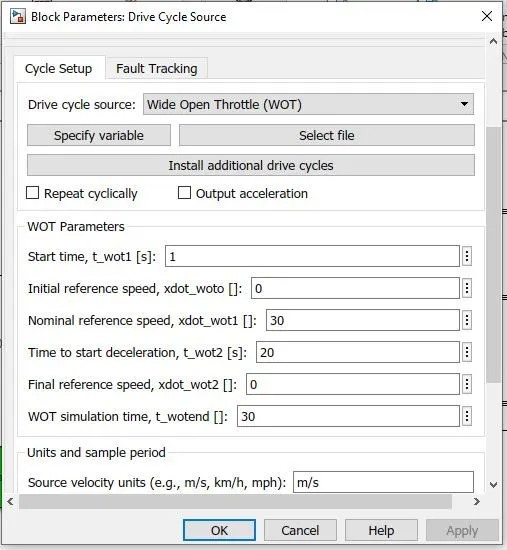
>>The drive cycle is changed to WOT and the following setting changes are done.
>>Then the environment block is opened and the wind velocity are grade are changed to ‘5’ from default ‘0’
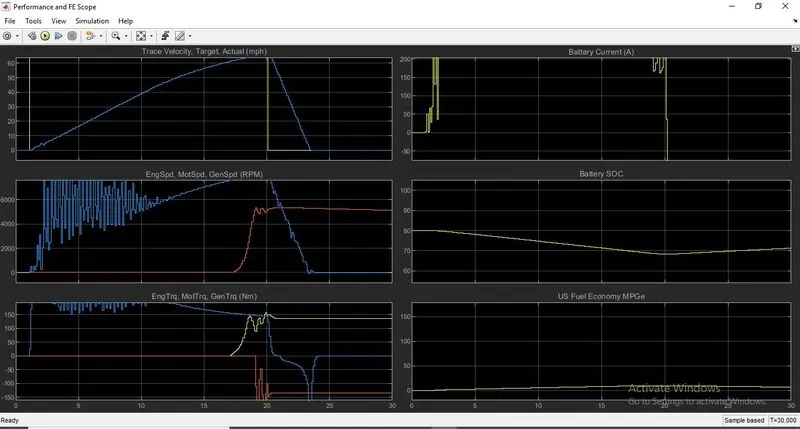
>>Then the simulation is done for 30 sec and the following results are observed.
Q4. Keeping all other parameters same, compare the simulated results of hybrid and pure electric powertrains.
>>The EV reference block is loaded
>>The drive cycle is changed to WOT and the following setting changes are done.
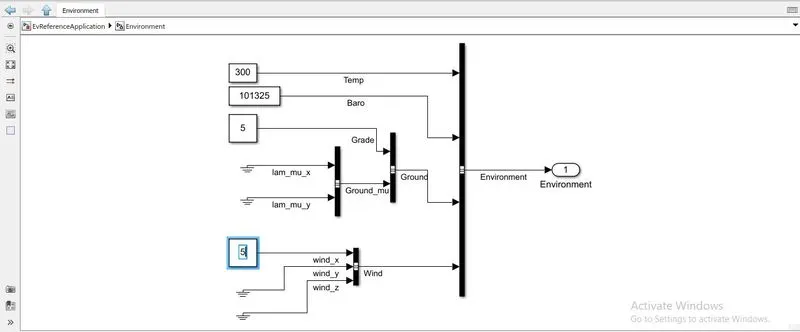
>>Then the environment block is opened and the wind velocity are grade are changed to ‘5’ from default ‘0’
>>Then the simulation is done for 30 sec and the following results are observed. 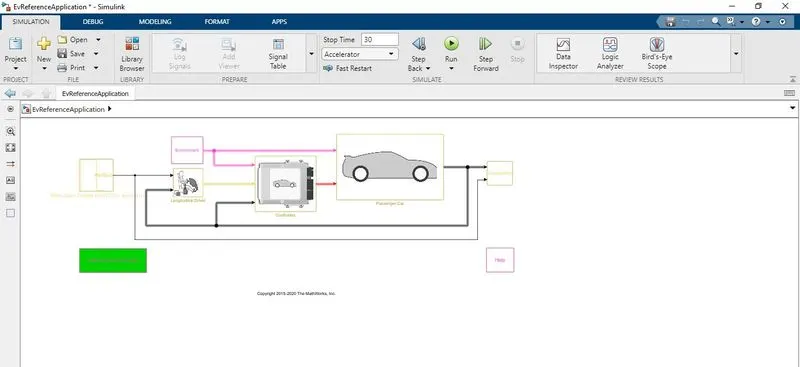
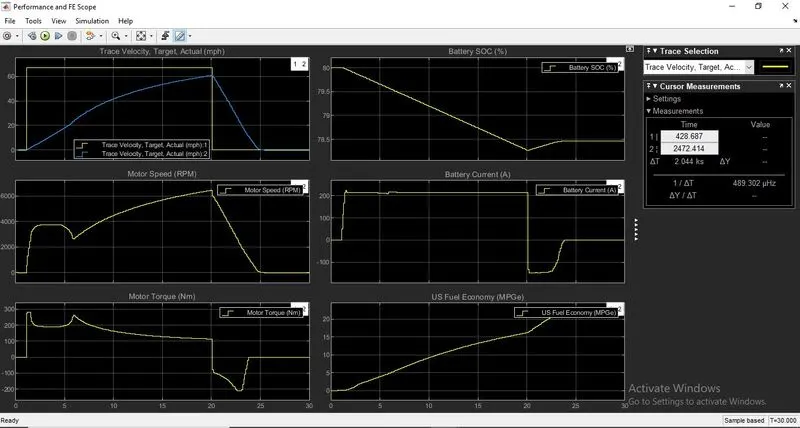
RESULT COMPARISION:
|
HEV |
EV |
|
|
Trace velocity, Target actual (mph) |
The target velocity rises from zero to 70 mph and travels straight drops back to zero at 20 seconds as the input given. In the actual velocity, the speed gradually increases from zero to 70 and decelerates for 10 seconds from 20-30th second. |
The target velocity rises from zero to 70 mph and travels straight drops back to zero at 20 seconds as the input given. In the actual velocity, the speed gradually increases from zero to 70 and decelerates for 10 seconds from 20-30th second. |
|
Engine, Motor, Generator Speed(RPM) |
As the system starts the motor speed fluctuates in increasing manner and decelerates at 20 secondsand goes to zero even before reaching 30 seconds. |
The speed increases to 2400mph at 2sec drops at 4sec and raises to mph till 20sec and gradually reduces to 0 at 30sec. |
|
Engine, Motor, Generator Torque (Nm) |
The torque also fluctuates as he speed does and drops to negative value as the deceleration starts. |
The motor torques for increases and makes a downward curve as an upward curve is formed in the motor speed curve at 290Nm and gradually reduces to 110 Nm at 20th second and makes a step drop to -90Nm to -80 Nm as the motor decelerates and travels at 0 till it reaches 30sec. |
|
Battery current (A) |
As soon as the system starts, the current fluctuates and increases to 210A and moves constantly. At 20th second, the current drops to -150A and then rises to zero and travels to 30sec. |
As soon as the system starts, the current fluctuates and increases to 210A and moves constantly. At 20th second, the current drops to -150A and then rises to zero and travels to 30sec. |
|
Battery SOC |
Battery SOC starts to reduce after few second from 80 to 69 in 20 sec and makes a small rise o 70 and stays constant as the system starts decelerates. |
Battery SOC starts to reduce after few second from 80 to 77 in 20 sec and increases to 78.5 and stays constant as the system starts decelerates. |
|
Fuel economy (US MPG) |
Fuel economy increases from 0-17mpg |
Fuel economy increases from 0-17mpg, till 20 seconds and furher increase to 20mpd from 20-30 sec. |