Week - 4
- Q1. Implement control logic of a “washing machine” using Stateflow as per given sequence:
- If the power supply is available, the system gets activated
- If the Water supply is not available, stop the process & indicate through LED
- Soaking time should be 200s followed by Washing time of 100s.
- Then rinsing happens for next 20s & dryer runs for 50s
After all the processes have completed turn on the finished LED
>Working of washing machine is designed in such a way the two inputs power and water are given.
>When the power is ON, the power led glows.
>Then checks for water input and continues the process of washing.
>A chart is created.
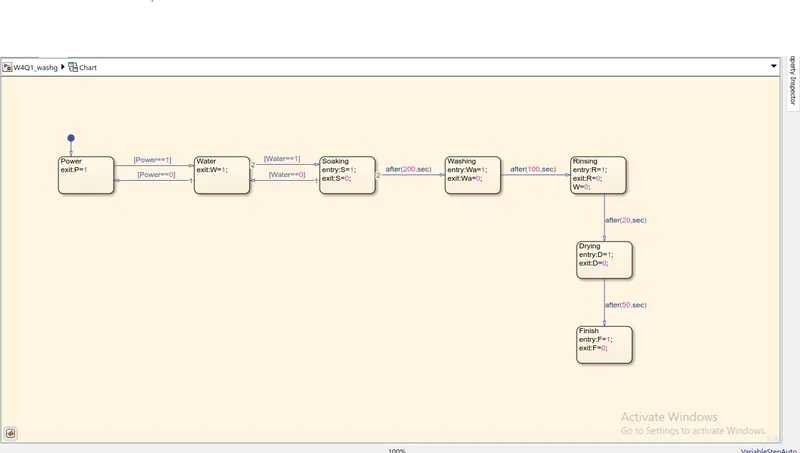
> A state is taken with a default transition (beginning of the state flow). It is named as ‘Power’ and conditions, “exit: P=1” are given, where 1 represents that the power input is given (active state and 0 the inactive state).
> Second state is taken and named as ‘Water’ and conditions, “exit: W=1” are given. Transition from Power to Water with condition Power==1and transition from Water to Power with condition Power==0.
> Third state is taken and named as ‘Soaking’ and conditions, “entry: S=1; exit: S=0” are given. Transition from Water to Soaking with condition Water==1and transition from Soaking to Water with condition Water==0.
>Fourth state is taken and named as ‘Washing’ and conditions, “entry: Wa=1; exit: Wa=0” are given. Transition from Soaking to washing with condition “after(200,sec)”.
>Fourth state is taken and named as ‘Rinsing’ and conditions, “entry: R=1; exit: R=0” are given. Transition from washing to Rinsing with condition “after(100,sec)” .
>Fifth state is taken and named as ‘Drying’ and conditions, “entry: D=1; exit: D=0” are given. Transition from Rinsing to Drying with condition “after(20,sec)”.
>Sixth state is taken and named as ‘Finish’ and conditions, “entry: F=1; exit: F=0” are given. Transition from Drying to Finish with condition “after(50,sec)”.
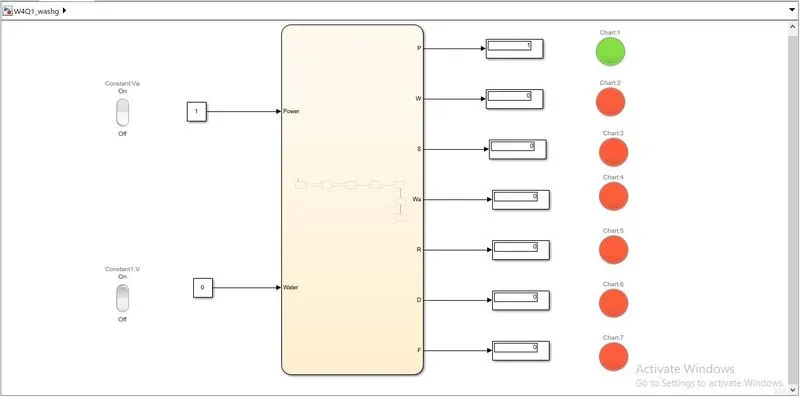
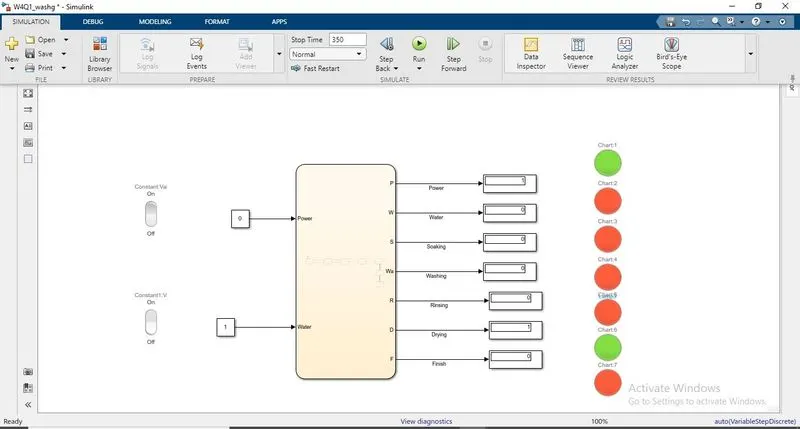
>The Power(input), Water(input), P(Output), W(Output), Wa(Output), R(Output), D(Output), and F(Output) parameters are added
> Power and Water inputs are connected with rocker switch where ‘0’ is ON state and ‘0’ is OFF state.
>The constant are connected to the chart input and each output is connected with a display.
>Each display is connected with a lamp, in which ‘red’ indicates state ‘0’ and ‘green’ indicates state ‘1’.
> The model is simulated and the results are attached below.
Q2. Speed Range(kmph) Gear
0 to 15 1
16 to 25 2
26 to 40 3
41 to 60 4
Above 61 5
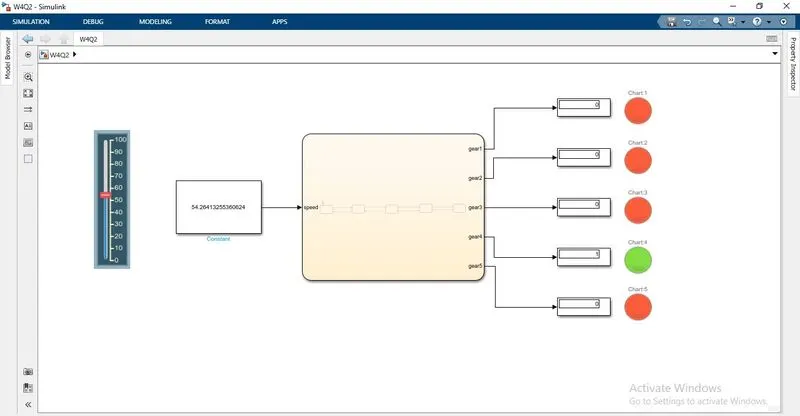
Give speed input while the simulation is running & display the gear number.
*Modelling the working of gear under given conditions as follows:
>A vertical slider is connected to a constant block to show the speed of the vehicle.
>A chart to created.
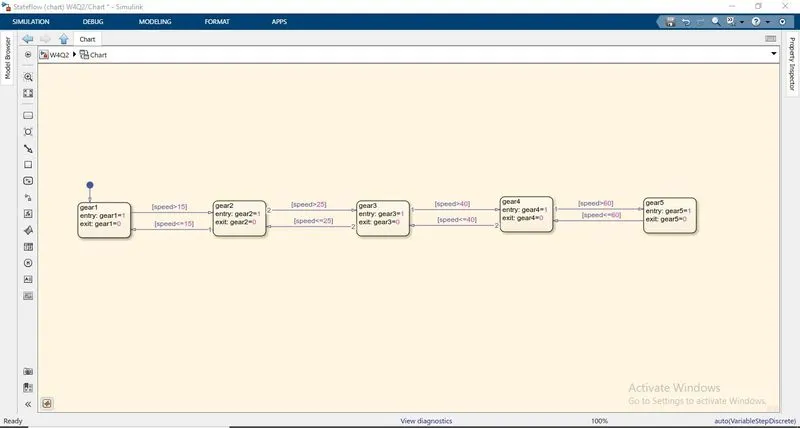
>A state is taken with a default transition (beginning of the state flow). It is named as ‘gear1’ and conditions, “entry: gear1=1; exit: gear1=0” are given, where 1 represents the active state and 0 the inactive state.
> Second state is taken and named as ‘gear2’ and conditions, “entry: gear2=1; exit: gear2=0” are given. Transition from gear1 to gear2 with condition speed.>15 and transition fromgear2 to gear1 with condition speed<=15.
> Third state is taken and named as ‘gear3’ and conditions, “entry: gear3=1; exit: gear3=0” are given. Transition from gear2 to gear3 with condition speed.>25 and transition fromgear3 to gear2 with condition speed<=25.
> Fourth state is taken and named as ‘gear4’ and conditions, “entry: gear4=1; exit; gear4=0” are given. Transition from gear3 to gear4 with condition speed.>40 and transition fromgear4 to gear3 with condition speed<=40.
> Fifth state is taken and named as ‘gear5’ and conditions, “entry: gear5=1; exit: gear5=0” are given. Transition from gear4 to gear5 with condition speed.>60 and transition fromgear5 to gear4 with condition speed<=60.
>The speed(input), gear1(output 1), gear2 (output2), gear3(output3),gear4 (output 4) and gear5 (output5) parameters are added in the model explorer.
> The constant is connected to the chart input and each output is connected with a display.
>Each display is connected with a lamp, in which ‘red’ indicates state ‘0’ and ‘green’ indicates state ‘1’.
>A speed is set on the vertical slider, the model is simulated and the results are attached below.