Week-4 Challenge WOT Condition Part-2
1.
aim: to find the difference between mapped and dynamic model of engine, motor and generator and also to how can you change model type
theory:
mapped models:
mapped models are macro level models which uses lookup tables in order to stimulate the characterstics of the vehicle architecture in order to achive the appoximate result of the vehicle performance.these models take less time for their simulation which are mainly used where there is need of model level monitering
dynamic models:
dynamic models are micro level models which uses runtime data of the components in contrast to the lookup tables in order to stimulate the performance of the vehicle on component level basics then integrates it to find the vehicle architecture in ored to achive the detailed report .these models take much more duration than that of the mapped models for their simulation where the monitering takes place in component level
to change model from mapped to dynamic:
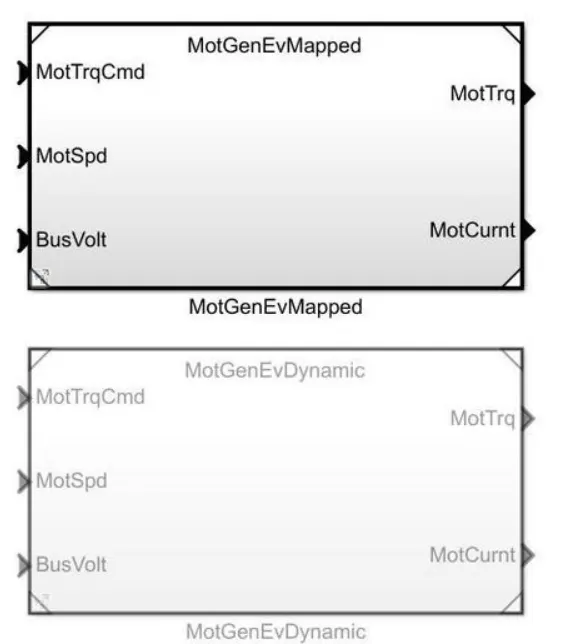
for the blocks of the engines,generators ,motors there are two models available as mentioned above
1.open the simulink model of the ev reference application
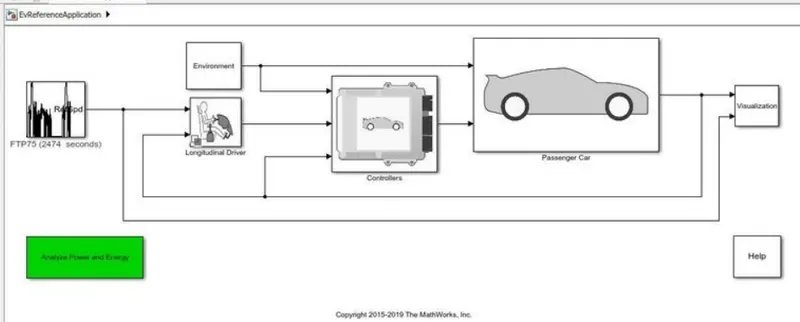
2. click on the passenger block where we find the electic plant and drivertrains
3.now click on the electric plant we will find a motgenevmapped and a battev blocks
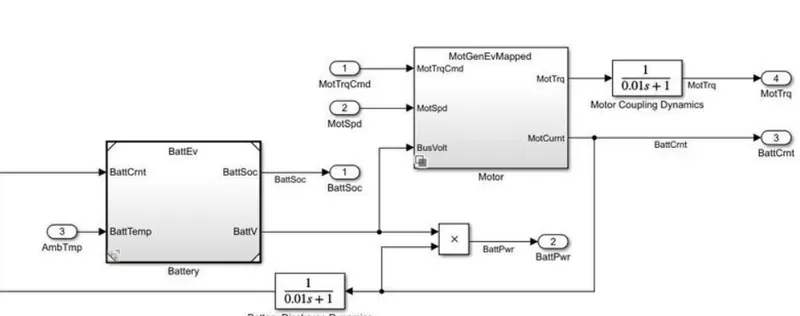
4.select the motgenevmapped where we can find the blocksets of mapped and dynamic blocks as shoen below
5. inorder to change the blockset control from mapped to dynamic follow the blow direction after clicking on the block
varient -->label mode active choice -->motgenevdynamic
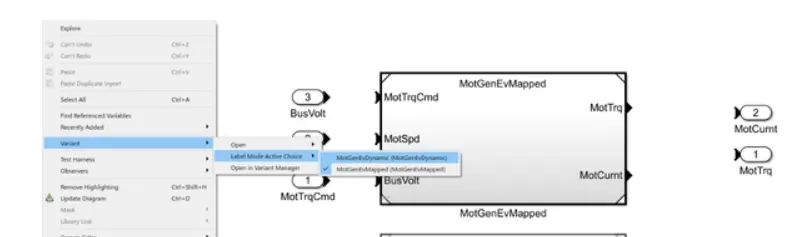
6.from the above procedure we can change the models of generator ,engine ,motor from mapped to dynamic
2.
aim:
to find how does the model calculate miles per gallon and also the factors that are considered to model fuel flow
explanation:
consider a ev reference application and open the simulink model of the ev vehicle and run the model and open the visualization block and then click on the performance calculation of the ev vehicle the fig shown below is displayed
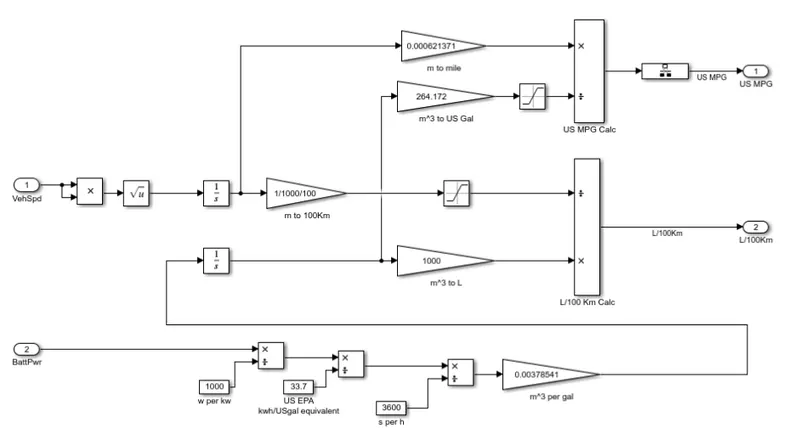
from the above figure performace calculations are displayed in two systems us sustem, cananda syastem
in us system the performace is calucated based on how many miles does a vehicle run on consuming a galon of the fuel
in canada it is calculated as how many litres of fuel required for travelling of the 100 kilo metres distance
from the above conversion let take the us system
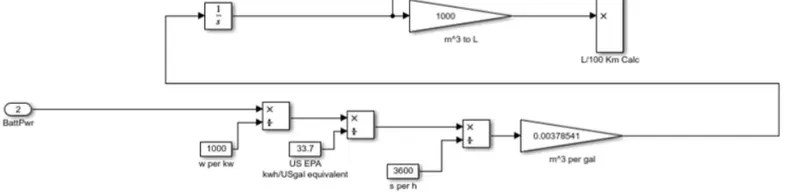
1.battery power is calculated in watts/h ,by dividing with 1000 it becomes kw/h
2 1 gollon = 33.7 kw/h ,so kwh is divided by 33.7 now it is in gallon/hour and g/h is divided by 3600 in order to convert to gallon/ses
3. 1 gallon = 0.00379 m^3 ,convert the gallon per sec in to litre/sec,then integrate
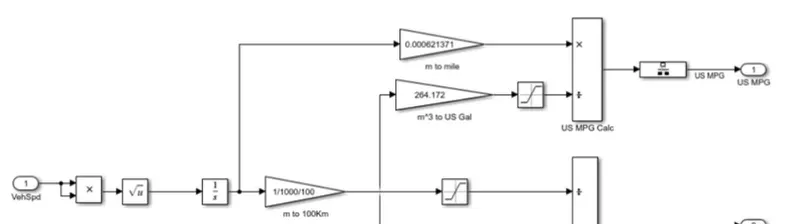
4. vehicle velocity is in m/sec in order to find the didtance covered integrate it so that it is conevterd in to metres
5. we know that 1 meter = 0.000621371 miles so that multiply with this value in order to get it in miles
6 . convert the m^3 or litre in to gallon and divide the miles and gallons we can get the MPG (miles per gallons) in us system
factors:
as the above model is electric model the factors that are responsible for the model fuel flow are
1.vehicle speed
2.battery power
3.
aim:
to Run the HEV ReferenceApplication with WOT drive cycle. Change the grade and wind velocity in the environment block
explanation:
block diagram of the hev reference application with wide open throttle drive cycle
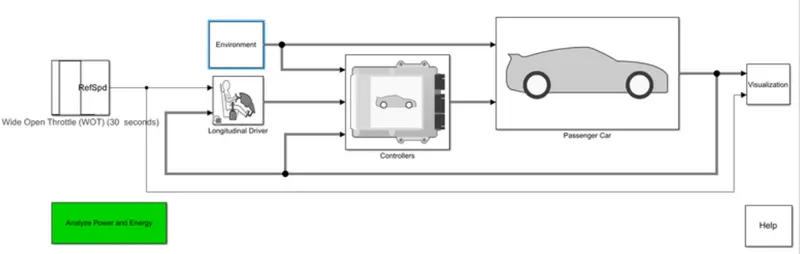
the above simulation takes place for the 30 sec duration
steps to change the driving cycle:
1.click on the driving cycle block and select the WOT driving cycle from the driving cycle source
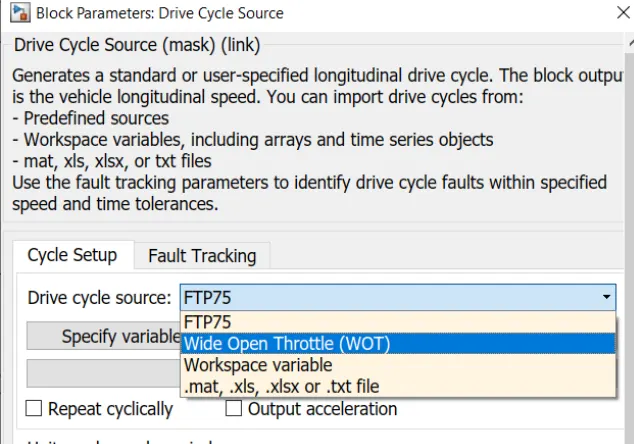
2. in order to change the speed ,driving cycle time click on the WOT parameters and chang the parameters as required as shown below
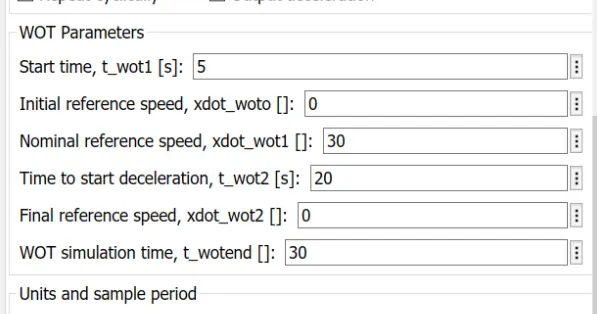
3. now both the driving cycle and duration of the driving cycle is selected
4. to change environmental variables such as grade ,and wind velocity click on the enviromental block
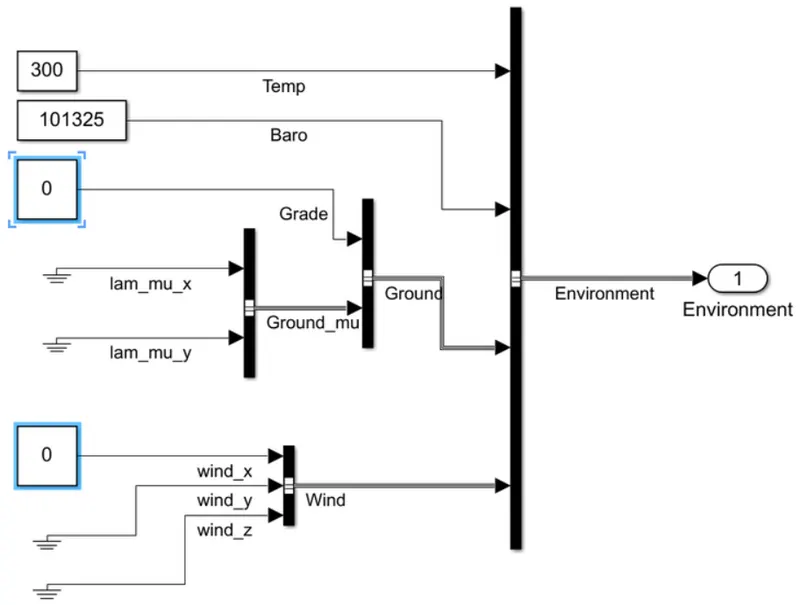
5. the grade and wind velocity from the above block is set to 0 a
6.now change the values of grade to 10 and wind velocity to 10 m/s
7.now simulate the model for 30 sec duration
result:
conclusion:
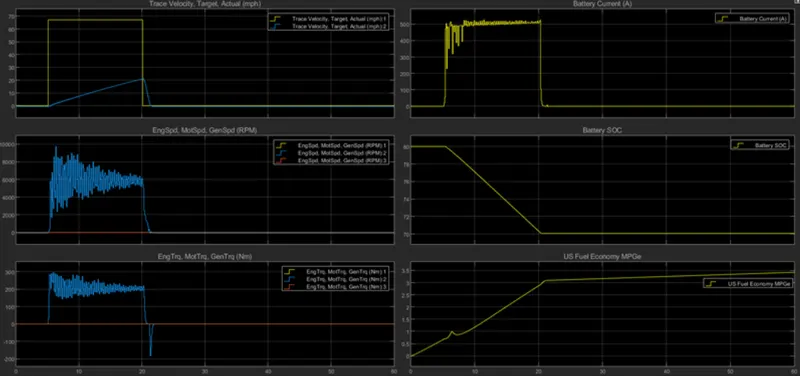
from the above we can see a six different plots of various parameters the driving cycle used for the simulation is wide open throttle , with grade 10 and wind velocity 10 m/s
plot1:
plot represents the trace velocity there are two graphs ploted in the same plot yellow line represents theoritical velocity while blue line represents the actaual velocity
plot2:
speeds of engine ,motor, and generator all the lines of both motar and engine merges while generator speed is constant
plot3:
torques of the engine ,motar and generator ths plot also looks smilar to the above plot
plot4:
it shows the battery current flow during the motion of the vehicle which is maximum at the starting of the vehicle or accleration period
plot5 : state of charge of the vehicle
plot6: fuel econamy of the battery or fuel converter as this is the hybrid vehicle
4.
aim:
to simulate and to compare the both pure electric and hybrid power trains by keeping the all parmeters constant
explanation:
hybird vehicle configration:
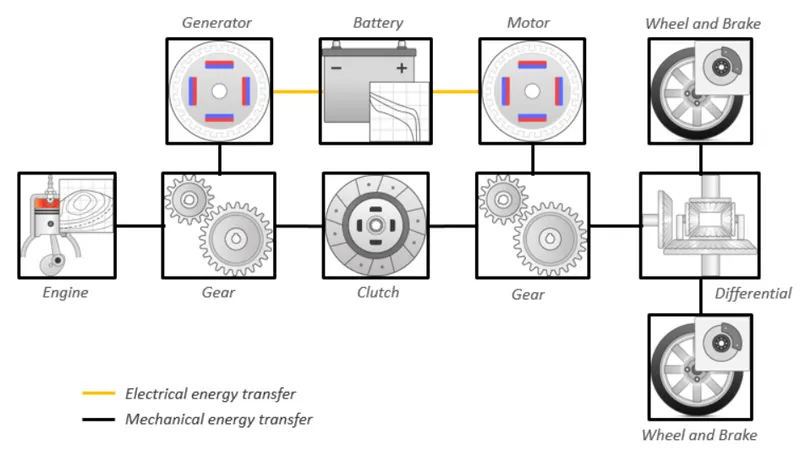
components of the hev configration:
it consists of the
1.generator
2. motar
3.engine
4.battery
5.clutch
6.gear box
7.differential blocks
as shown in the above model is parallel flow hev model in which both engine and motar are connected parallel to the differntial mechanisam ,here the flow of charge may be from the engine or the motar as per the contol mechanisam
pure electric vehicle configration:
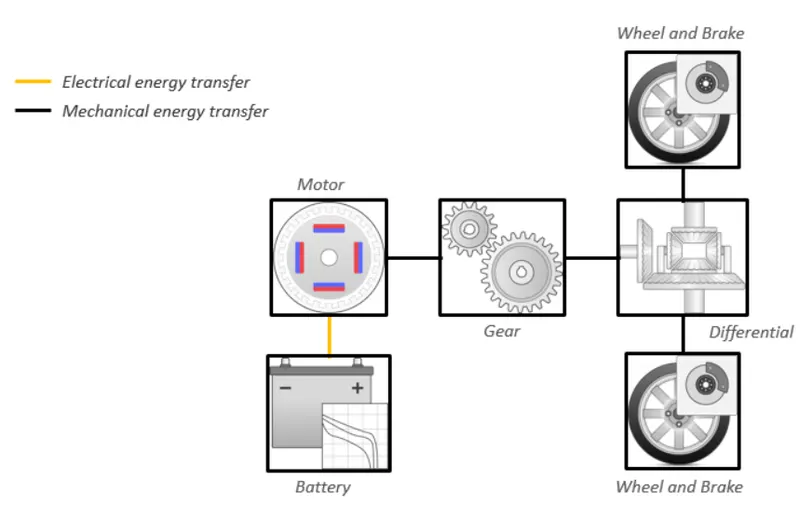
components of ev configuration
it is simple mechansiam when compared to the hev
1.battery
2.motor
3.gear
4.differential
it is a part of hev as shown above only the electric model is take where there is no study of engine and other components
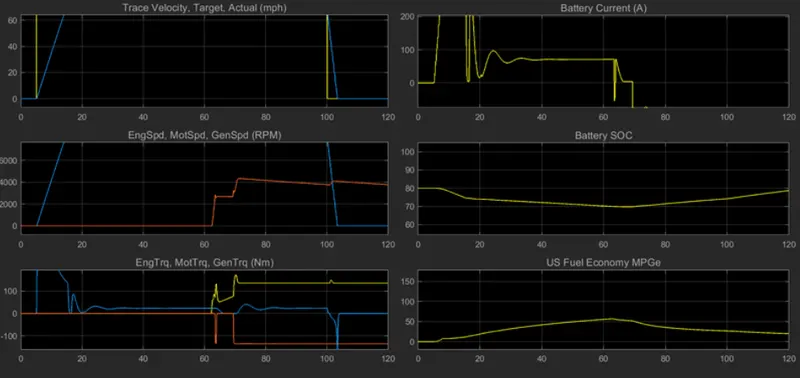
case1:
consider the hev powertrain which is running on WOT driving cycle for a duration of 120 sec and simulate the model
case2:
consider the ev powertrain which is running on WOT driving cycle for a duration of 120 sec and simulate the model
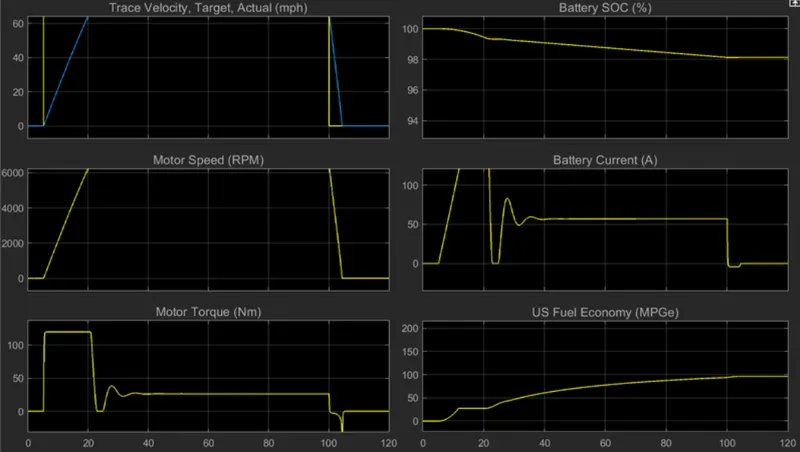
from the above two case we can study that
hev ev
1.time of peak velocity 14 sec 20 sec
2.peak motor speed 7500 rpm 6500 rpm
3.peak motar torque 301 Nm 120 Nm
4.peak battery current 527 A 120 A
conclusion:
from the above results we can come a conclusion in the various aspects of the both hev and ev configurations
* econamy of the pure ev vehicle is more whwn compared to that of the hev because from the above econamy graphs we can see that econamy of the pure ev is gradually increases where as hev increases for a duration and then decreses because as the battery is completry drained where engine runs both the generator and also differential
* maximum torque can be produced by the hev vehicle as the ic engine has high torque efficiency then that of ev vehicle .