Week-4 Challenge WOT Condition Part-2
1. What is the difference between the mapped and dynamic models of engine, motor, and generator? How can you change the model type?
| Mapped Model | Dynamic Model |
| The mapped model uses a set of steady-state lookup tables for simulation and its operation. |
Dynamic model decompasses the engine behavior into engine characteristics that are separated into lower-level blocks together to form a dynamic model. |
| If the look-up table is present then the simulation becomes easier and it gives results based on the data interpreted. This is also a global-based model. | It operates dynamically depending on the simulation of operation detailed data and specifications are not required and the simulation gives the detailed analysis of the components simulated. This is called a real-time-based model. |
| The drawback is more data has to be collected and we need to make some assumptions. | It cannot be simulation using custom preference. |
| The effect on the engine can be simulated the array of data interpreted in the system | The engine performance will be simulated based on the original specification of that engine and the result is real-time |
| The motor specification such as RPM, Voltage, Power, Efficiency, Temperature, etc are to be entered for simulation |
The actual details would be the same as the results obtained. |
| Specification for torque, current, etc and another parameter to be entered for simulation | All the details and specifications would be considered as per the state of the same would be obtained then. |
| The mapped generator block is also similar to other blocks. Most of the data required are taken from the lookup tables corresponding to the given input parameter. It is simulation time is less. | The dynamic generator involves users entering the parameter manually during the run time for their particular application. The results take time and are more accurate. |
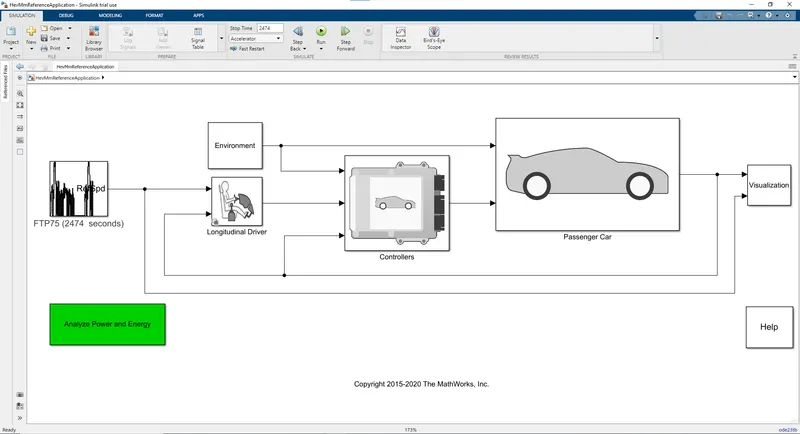
Open the Hev File
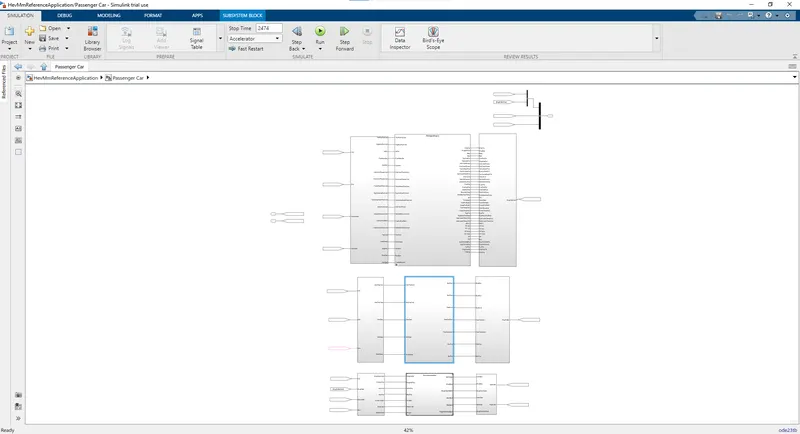
Open the passenger car block. Sub block see below.
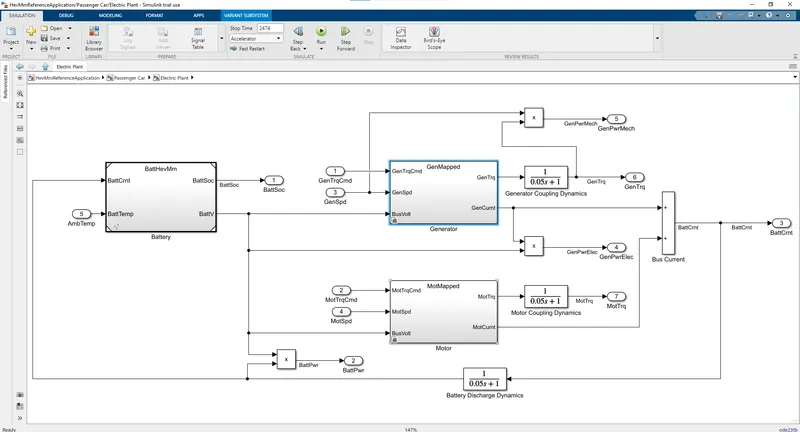
After that open the electric plant block. sub block sees below.
After that open the Generator block. Sub block see below.
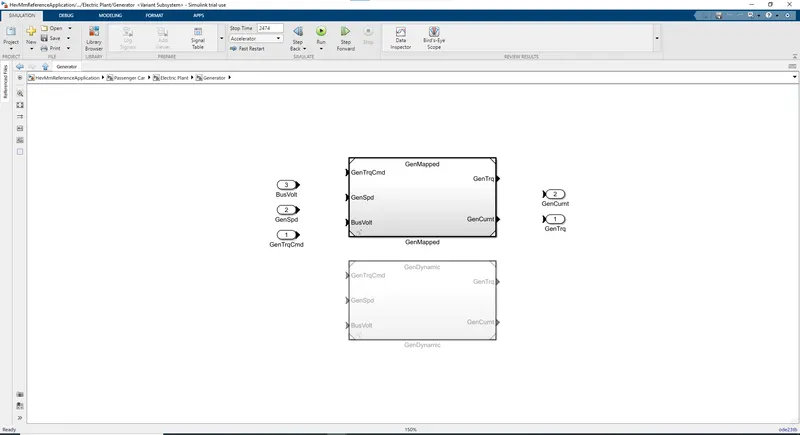
After that right-click and select the following option to change the model.
>> Variant
>>Label model Active choice
>> Gen Dynamic (GeDynamic).
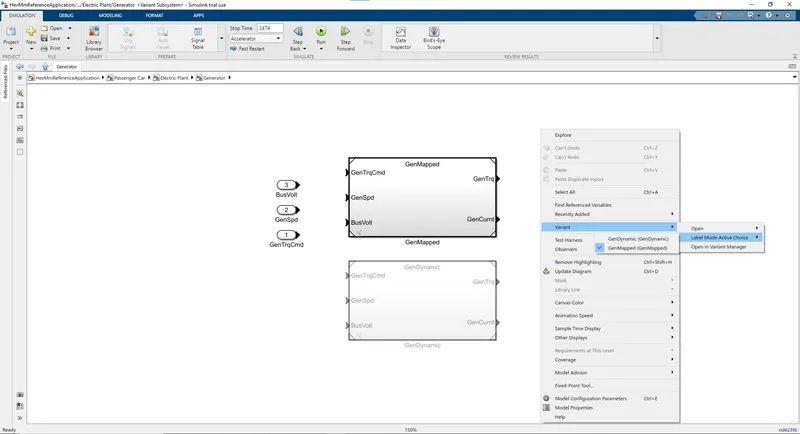
Another method is
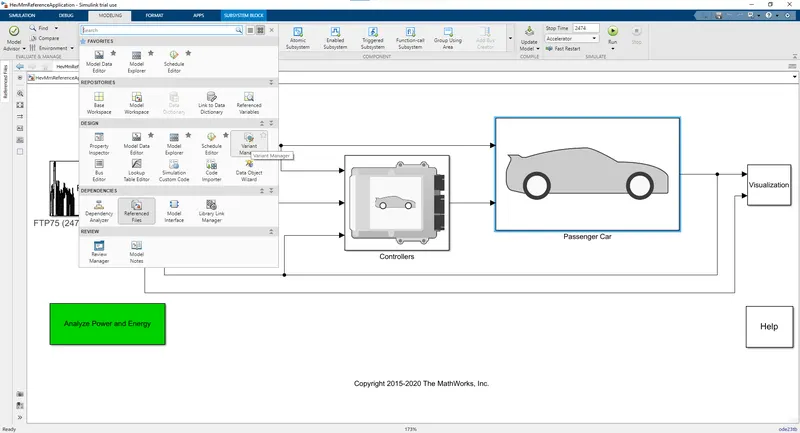
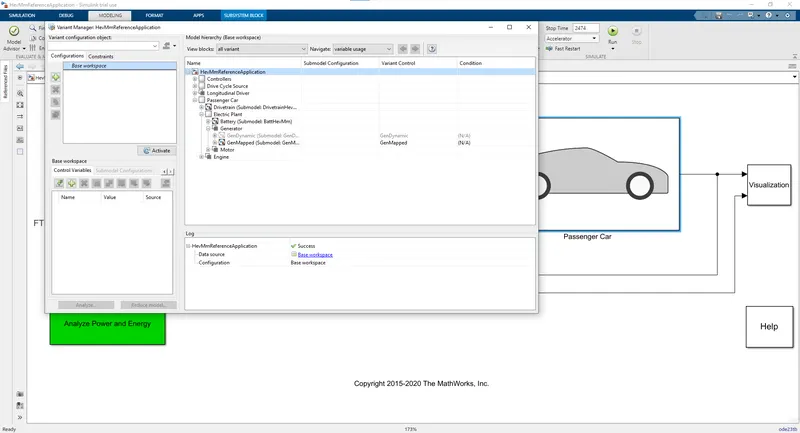
Click on the Modeling option then click on the Variant Manager then select Passenger Car then click on the Electric Path then click on a Generator then select model .......GenDynamic (GeDynamic) or GenMapped(GeMapped).
2. How does the model calculate miles per gallon? Which factors are considered to model fuel flow?
MPGe-
In the US compare the efficiency of gasoline vehicles with the BEVs, PHEVs, or FCEVs MPGeunit was formulated. MPGe stands for mile per gallon equivalent. It has been found that 1 gallon of gas has the same amount of energy as 33.7KWh of electricity.
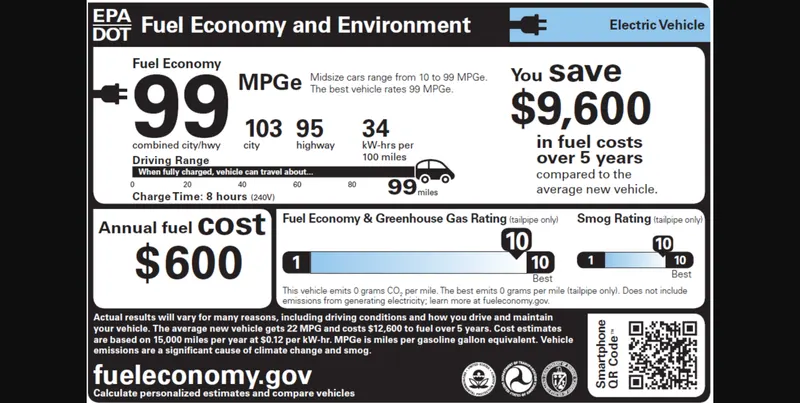
The above rating is given by EPA (Environmental Protection Agency). Here only one fuel economy is given as it runs only by electricity as it is a BEV.
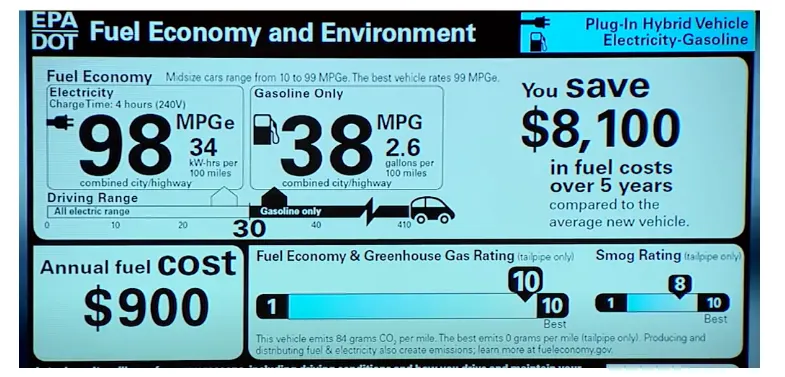
The above rating has two values as it is a PHEV. One is for pure EV mode and another one is for pure engine mode.
Eg. A battery propels the vehicle for 3.125 miles per kWh capacity the battery. So,
3.125 miles/kWh * 33.7 kWh/gallon = 105 MPGe
In the model it is calculated by this block:
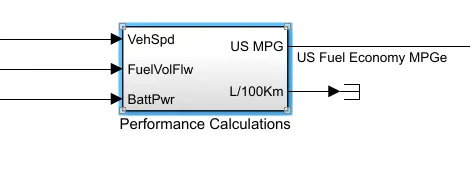
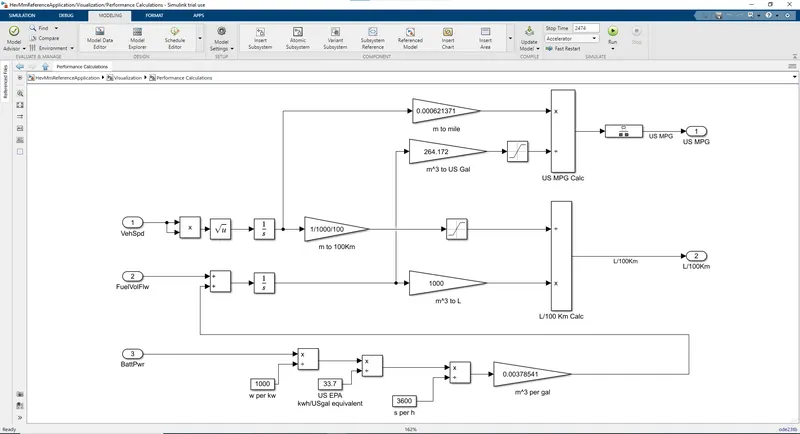
The above image has two fuels electricity and fuel. As discussed earlier 1 gallon of gas equals 33.7 kWh of electricity.
First converted battery power into KW (W/1000) then its divides by 33.7kwh. The fuel equivalent of the battery is added to the fuel flow. Using the vehicle speed and time the distance of travel is calculated. Then distance is converted into miles by conversions. Then as we have the fuel flow in m^3 and distance in miles.
3. Run the HEV ReferenceApplication with WOT drive cycle. Change the grade and wind velocity in the environment block. Comment on the results.
HEV ReferenceApplication with WOT drive cycle:
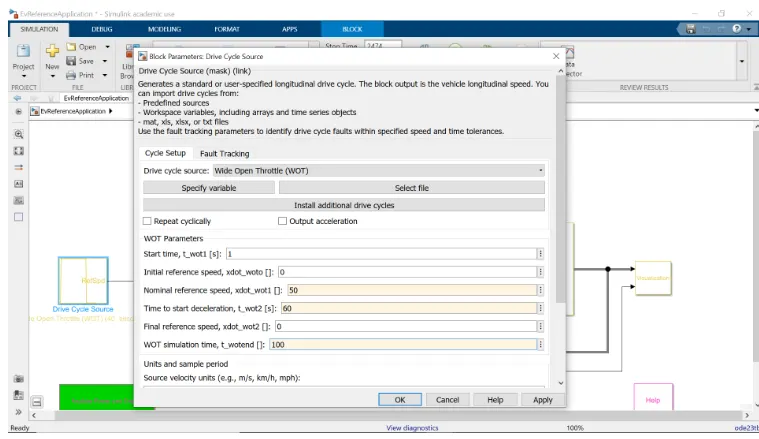
Double click the Drive cycle source block and then change the drive cycle to 'WOT' as shown in the below image. Also configure the parameters like time duration, WOT start time, initial speed, final speed, max speed, and time to start deceleration.
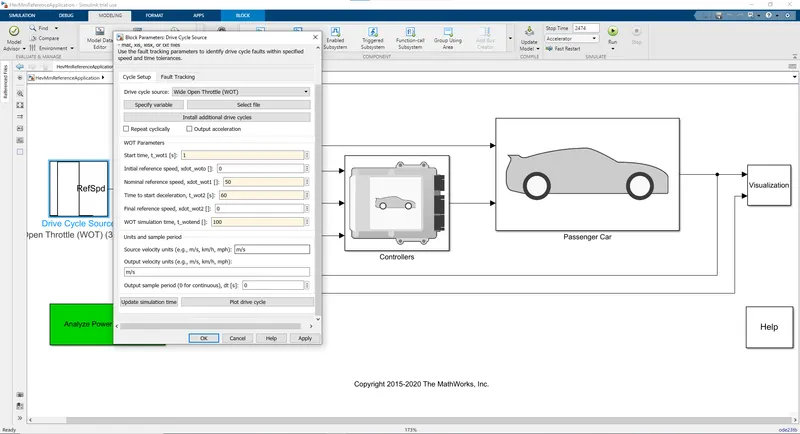
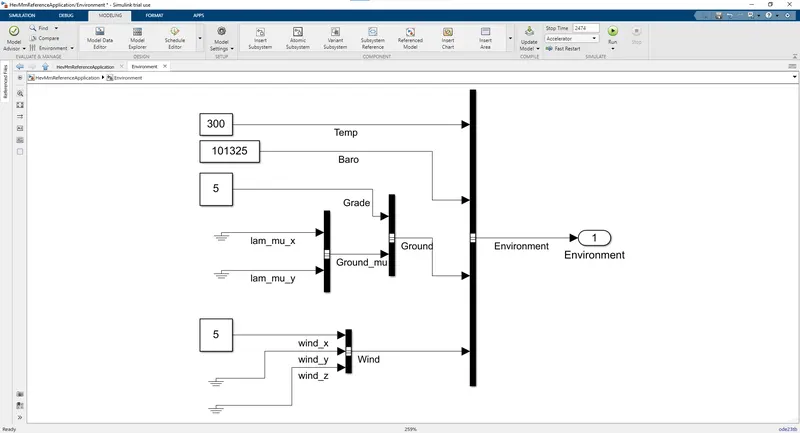
Change the wind speed and grade for the Environment block.
The graphs are obtained by WOT analysis -
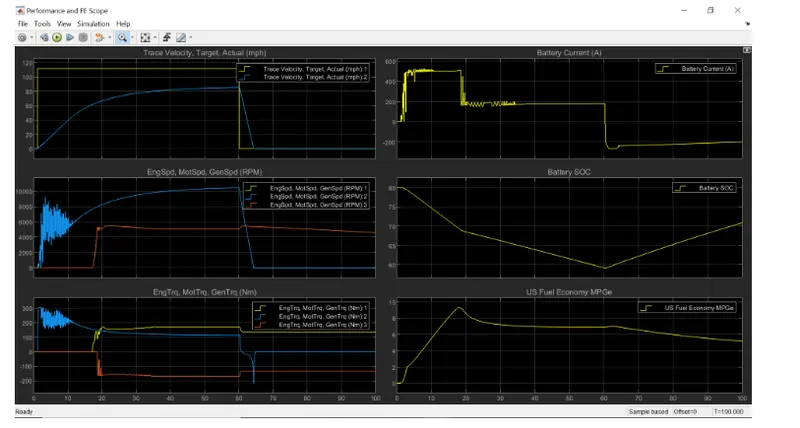
From the above graphs, we can see that,
Trace Velocity target and actual graph: The yellow line indicates the desired path and the blue line is the actual path. So it can be seen that battery power is not enough to meet the requirements of the grade and wind velocity.
Battery Current Graph: When the vehicle is accelerating the battery current is also increasing. When the velocity is constant the current requirement also becomes constant. When the deceleration starts the battery current becomes negative indicating regenerative braking.
Battery SOC: The battery SOC keeps on depleting until regenerative braking starts. This increases the SOC.
Engine, Motor, and Generator Speed: The initially only motor is used to start the vehicle as the motor has high initial torque. Later generator (red graph) kicks in charging the battery when SOC drops below 70%. Engine graph can't be seen as it may have overlapped with the generator.
Engine, Motor, and Generator Torque: Motor torque is high initially (blue line), and then the engine kicks in at a later stage (yellow line). Generator torque (red line) is negative as its charging the battery.
4. Keeping all other parameters the same, compare the simulated results of hybrid and pure electric powertrains.
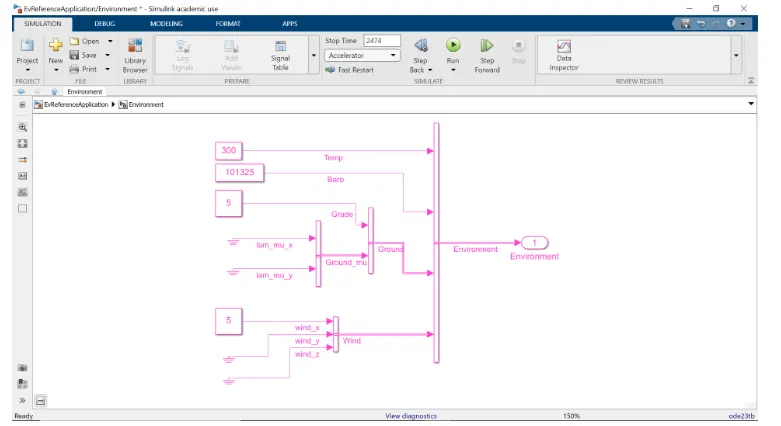
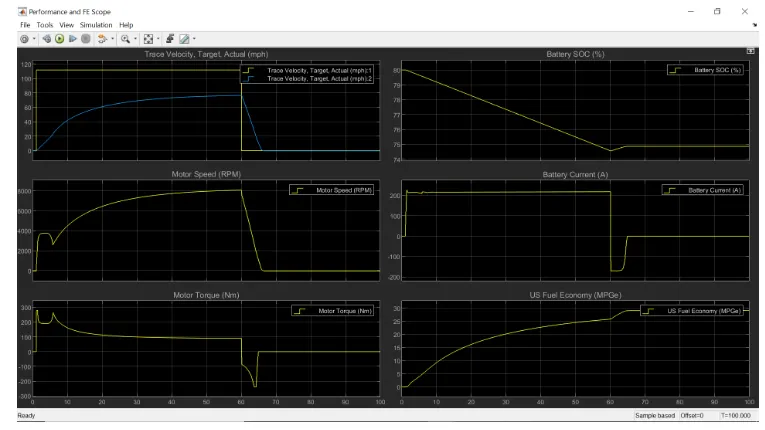
Now simulating the EV with WOT drive cycle, wind velocity as 5m/s, grade as 5 degrees, and keeping the rest of the parameters same as above HEVcase.
EV -
Change the wind speed and grade for the Environment block.
The graphs are obtained by WOT analysis -
HEV -
Change the wind speed and grade for the Environment block.
The graphs are obtained by WOT analysis -
After comparing the graphs of both EV and HEV following conclusions can be drawn:
1. The first graph (target and actual velocity graph) performance is almost the same. the reason could be that in that region only motor was operating so the performance in both EV and HEV is similar.
2. The battery current drawn by HEV initially is up to 500 A and later decreases to 200 A. This can be attributed to the fact that initially, the only motor takes all the load and later engine kicks in so motor load drop thus current drawn by the motor reduces. And during the deceleration, it is seen that negative current (regenerative braking) flows for a longer time in HEV as compared to EV. So we can say that regenerative braking is more aggressive in HEV.
3. SOC improvement of almost 15% is seen in HEV during deceleration and only 2% improvement can be seen in EV during deceleration. This can be understood by the same reason explained in point 2.
4. Motor torque and motor speed are stable in EV and they keep fluctuating a lot in HEV during the starting. Also, the peak RPM of the motor in EV is less than HEV. These differences can be attributed to the fact that the battery power of EV is more than HEV.
5. Fuel economy of EV is significantly greater than HEV. This is because an electric motor is more efficient than an engine.