Week-4 Challenge WOT Condition Part-2
Week 4 Challange
Powertrain blocksets- Powertrain Blockset provides a set of fully assembled reference applications, including gasoline (spark-ignition, SI), diesel (compression-ignition, CI), hybrid, and electric vehicle systems, as a starting point for your powertrain system model. To model a powertrain system for your project, you can select a reference application based on the powertrain type. Each reference application includes plant models, controllers, a longitudinal driver, and drive cycle data.
Powertrain Blockset provides a standard model architecture that can be reused throughout the development process. You can use it for design tradeoff analysis and component sizing, control parameter optimization, and hardware-in-the-loop testing. You can customize models by parameterizing components in a reference application with your own data or by replacing a subsystem with your own model.
Part 1 (A) Difference between dynamic and mapped model-
| MAPPED | DYNAMIC |
| Mapped model uses a set of steady-state lookup tables to characterize engine performance. | Dynamic model decomposes the engine behavior into engine characteristics that are separated into lower-level components. |
| The tables provide overall engine characteristics, including actual torque, fuel flow rate, and engine-out exhaust emissions. | It combines components in this way, the models capture the dynamic effects. |
|
We use mapped model when we have engine data from a dynamometer or a design tool like GT-POWER. |
We use dynamic model when we need a more detailed dynamic model and have component-level data. |
|
Useful for quasi steady-state engine simulations. |
Helpful in analyze the impact of individual engine components on the overall performance. |
(B) Steps for changing model type-
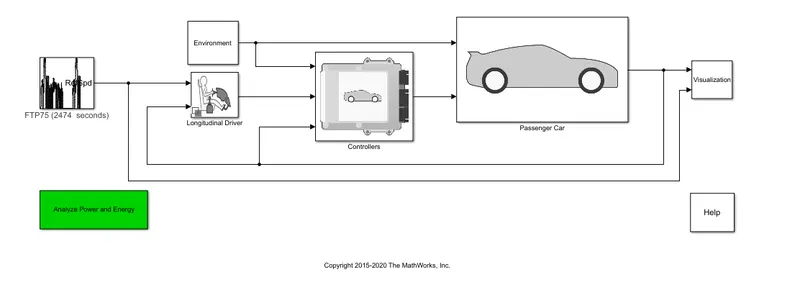
- Double click on 'passenger car' subsystem.
- Now select either engine or electric plant. Let select electric plant.
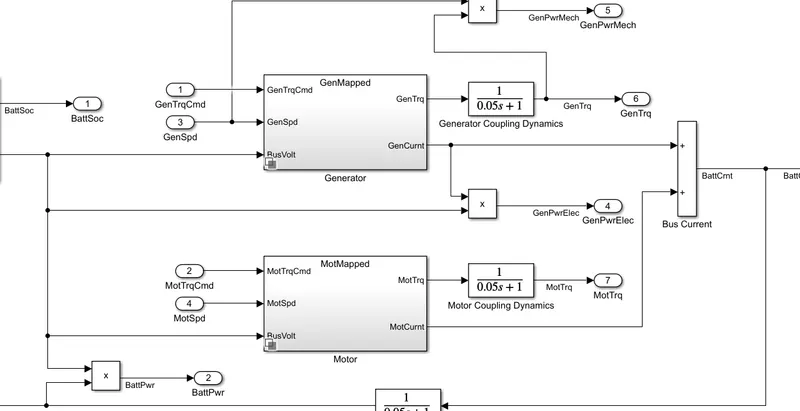
- Now right click on motor or generator, which you want change.
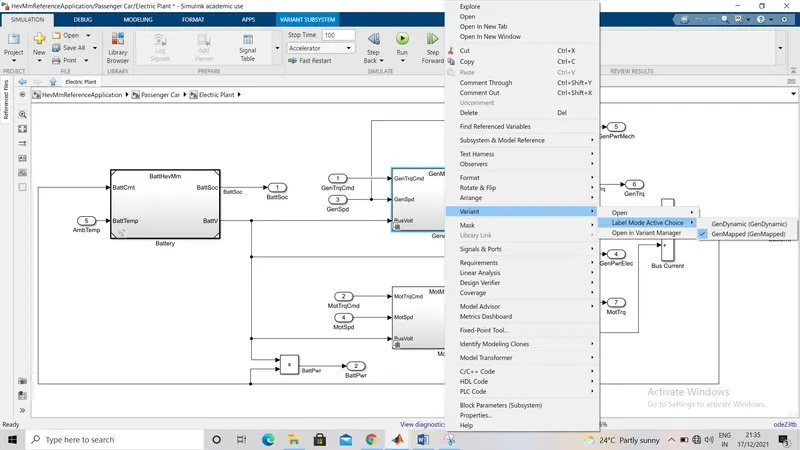
4. After that go to variant option.
5. Follow it to 'label model active choice' then select the model as shown below in figure.
Part 2 (A) Calculation of miles per gallon-
Double click on 'visualization' block and then double click on 'performance calculation ' subsystem block. Then we can see simulink model for calculating miles per gallon.
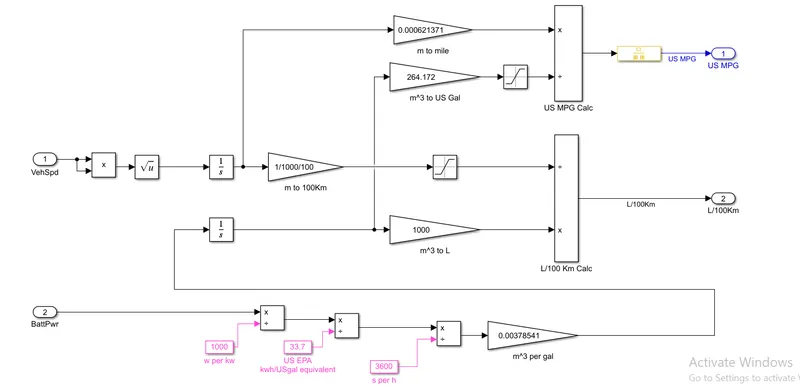
The above model is for pure electric vehicle. By analyzing the model we can summarize the steps involving for calculation -
As we can see, there are two inputs -1. Battery power 2. Vehicle speed
With the help of these two quantity, miles per gallon is calculated. So we will implement the inputs one by one.
Battery power
1. First we have to convert battery power to m^3 per gallon with help of different blocks according to equation as shown in model.
2. After converting to m^3 per gallon, integrate it. Then by using 'gain' block change it into US gal.
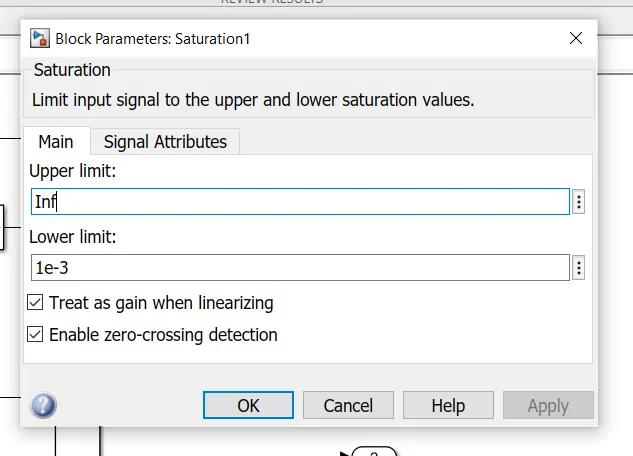
3. Now pass the obtained value through saturation block, which allows all values greater then 0.001.
Vehicle speed
4. First integrate speed to get distance travelled.
5. Then convert distance travelled from meter to mile.
6. Now divide the distanced travelled by US gal and the obtained value is miles per gallon .
(B) Factors for model fuel flow-
- For mapped model, a lookup table of fuel flow is given as input to the model.
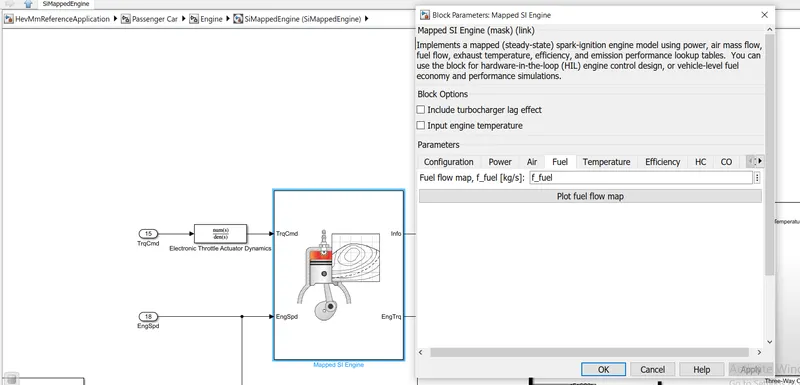
- For dynamic model, the fuel flow depends on following factor-
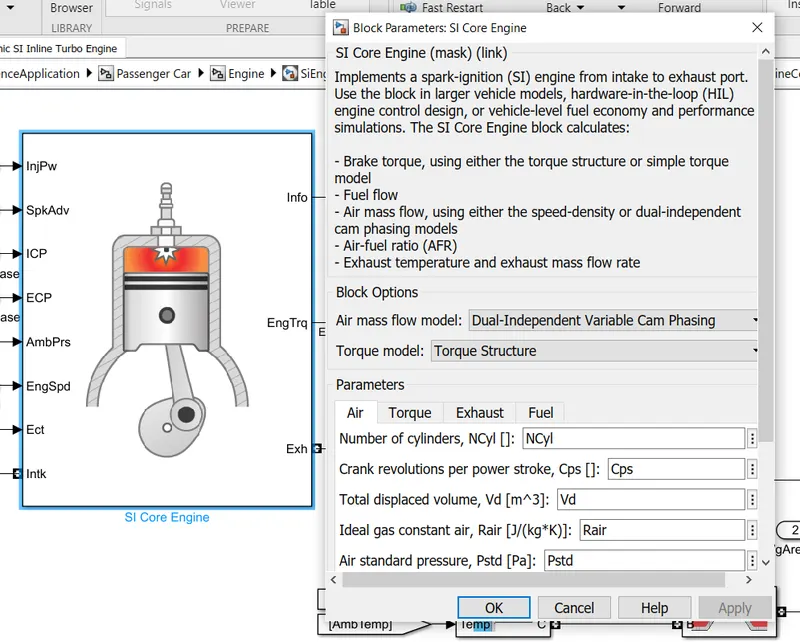
- Injector slope
- Stoichiometric air fuel ratio
- Fuel lower heating value
- Fuel specific gravity.
Part 3 HEV reference application (multimode)-
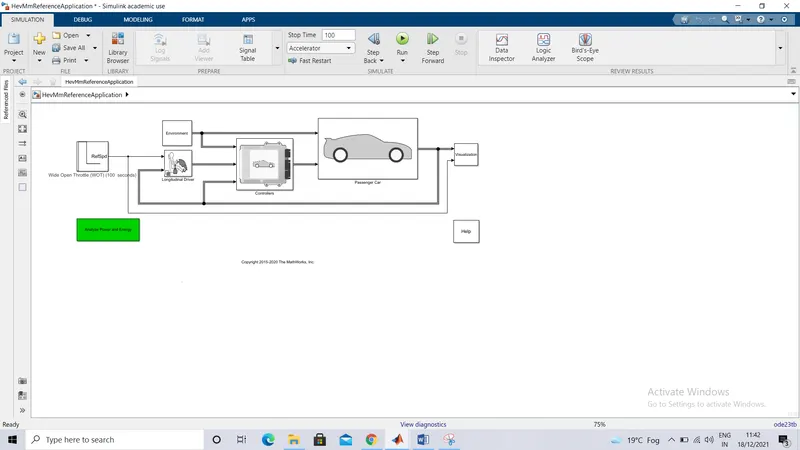
From help window we can open HEV reference application model. Here we are going to run HEV multimode reference application-
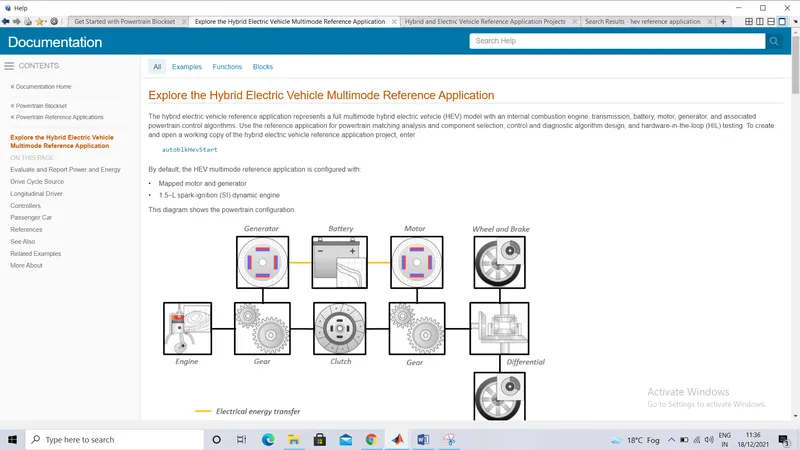
Click on 'autoblkHevStart'. Model will open in simulink window. As in figure shiwn below-
Double click on FTP75 drive cycle block and select WOT drive with following cofiguration-
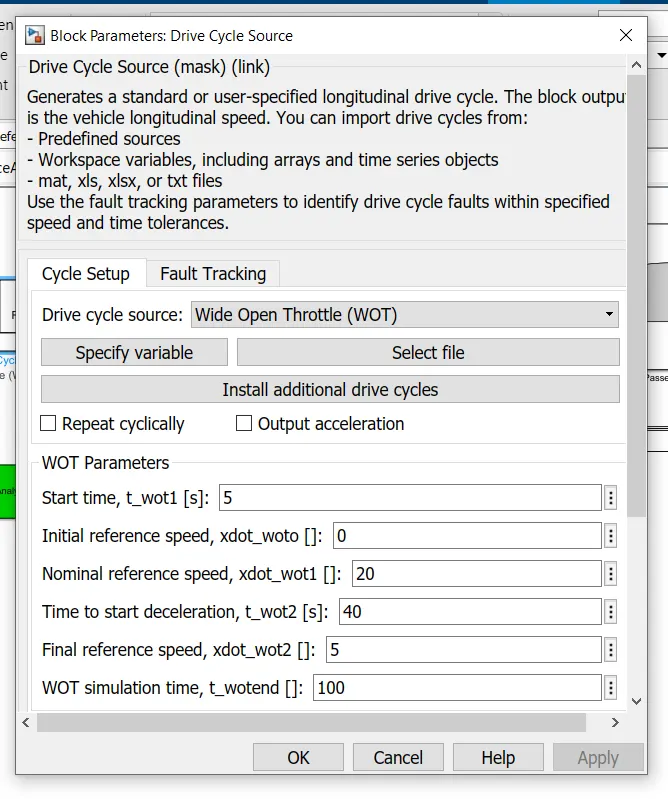
Click on 'OK' and run the model. After running the result is follows-
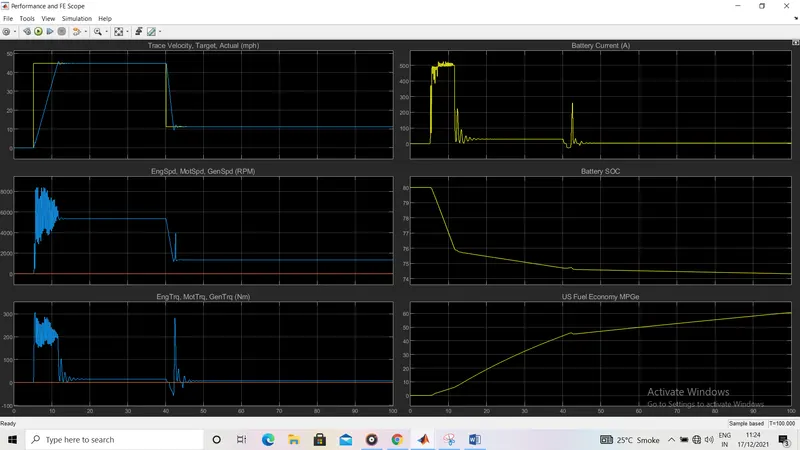
Here the sope ouput is showing six graphs -
- Trace velocity, Target actual vs time
- Engine speed, motor speed, generator speed (rpm) vs time
- Engine torque, motor torque, generator vs time
- Battery current vs time
- Battery SOC vs time
- US fuel economy MPGe vs time
Now change the wind velocity and grade in environment block and run the model again and see the differences in results of scope.
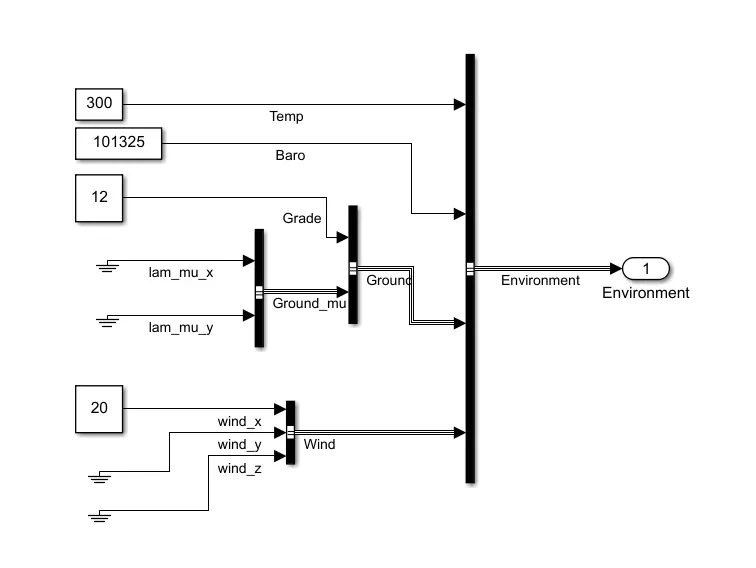
As we can see that the value of grade is 12 now and wind velocity is 20(in x-direction), previously both were zero. Let run the model and see the result-
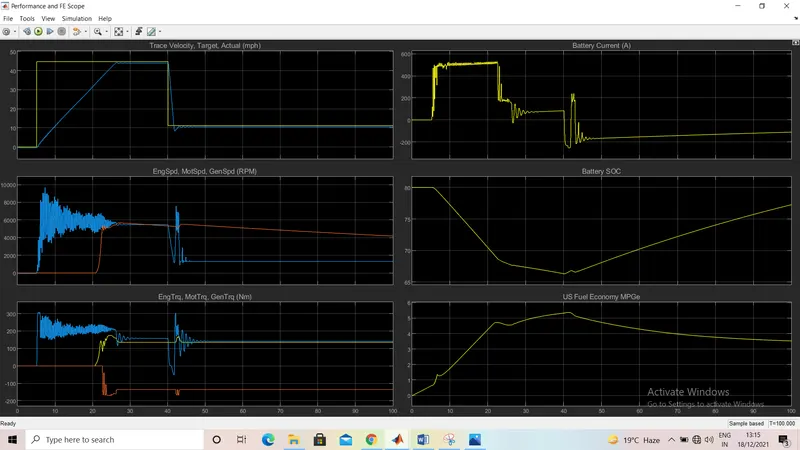
There is a lot of differences in scope output-
- In this case gap between actual velocity and trace velocity increases which means it is not following drive cycle accurately.
- Battery current is also high for long duration than before.
- State of charge is also decreasing rapidly.
- After applying grade and wind velocity fuel economy decreases.
Part 4 Comparison of hybrid and pure electric model(WOT drive cycle)
Let open the pure electric model shown in the figure below-
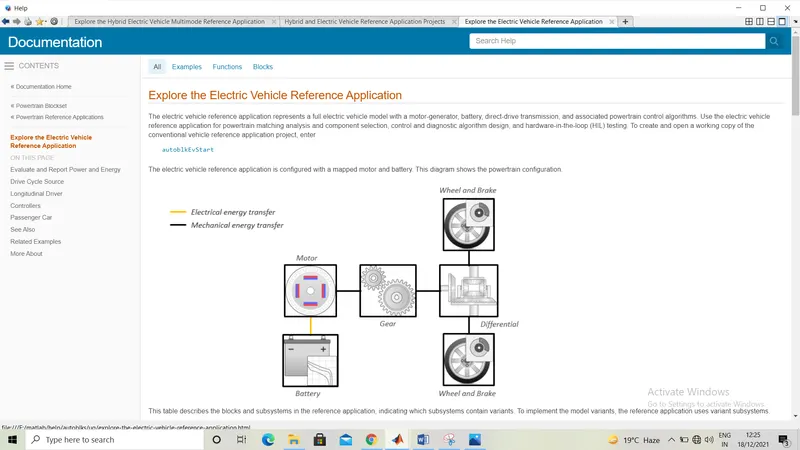
Click on 'autoblkEvStart' to open the model. After opening, the model is following-
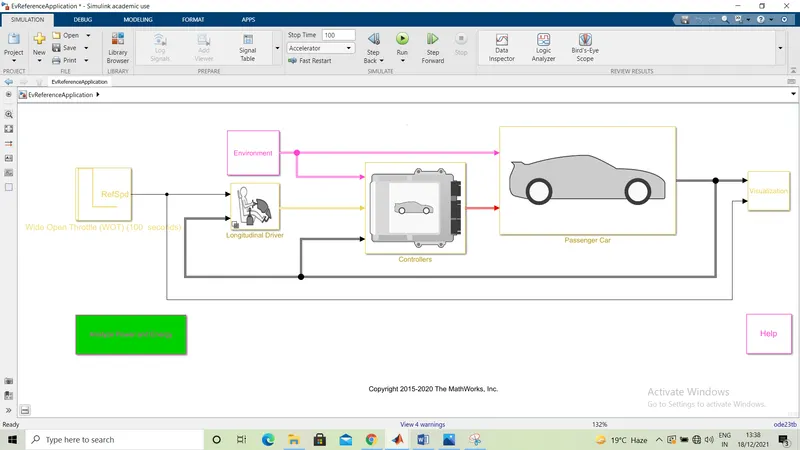
The above model is purely electric which means there is no engine block. Here we have to run this model, keeping all parameter similar to above problem. So double click on environment block and change grade to 12. Also change wind velocity to 20. Now run the model and see the scope output-
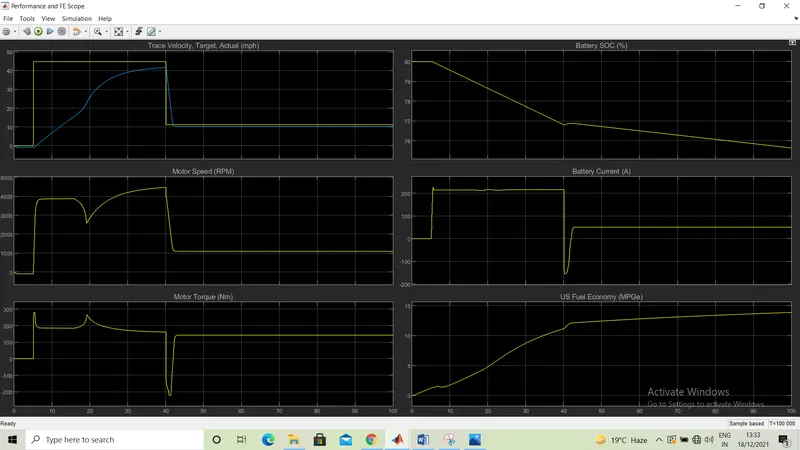
Let compare the results of both hybrid and pure electric vehicle with the help of table-
| PARAMETER | HYBRID VEHICLE | PURE ELECTRIC |
| No. of plots in a layout | As in hybrid vehicle there is engine part is also, so in output of scope, we can clearly see variation of engine's parameter w.r.t time. | In pure electric vehicle there is no plot for engine's parameter. There are only motor related and battery related plots. |
| Difference in velocity | Hybrid vehicle is more accurate in following the velocity of given drive cycle. | In pure electric vehicle, the gap between trace velocity and actual velocity is more. |
| State of charge | In hybrd vehicle, the SOC goes more down as compare to pure electric but it also start to rise after sometime. | In pure electric vehicle, the SOC is not less than 75% but it is continuously decreasing. |
| Fuel economy | Fuel economy is poorer as compare to pure electric vehicle. | It is better than hybrid one. |
| Battery current | In hybrid vehicle, the fluctuation in battery current is more. The current is higher also in case of hybrid vehicle. | In pure electric vehicle, the battery current is more smoother compare to hybrid. Its value is not going below -200. |