Week - 4
Week-4 Challenge
PART 1 Implementation of control logic for washing machine using stateflow in simulink.
Here are the conditions that we have to apply-
- If power is available then system gets activated.
- If water supply is not available then process is stopped and indicate it through LED.
- Soaking time =200 secs and washing time = 100 secs.
- Then rinsing for 20 secs and run the dryers for 50 secs.
- In last when washing is completed then indicate by LED.
Now to operate washing machine acoording to above sequence we use chart block in simulink and apply control logics in terms of different states.
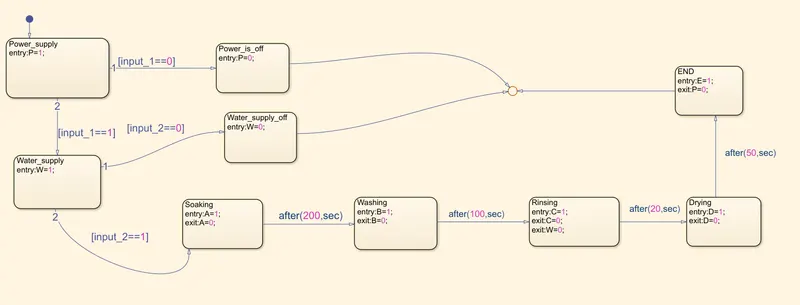
In above model we use nine different state as can be see in figure every state is connected in proper sequences to operate machine properly. Time delay is provided as control logic, after a finite delay states change from one to another. There is two input port in chart and seven output ports.
Here we use LED to indicate different states and finally process is stop on END state. Total nine LED is required in the model. Now we will observe different cases in model.
Case 1 Power supply is on and water supply is off.
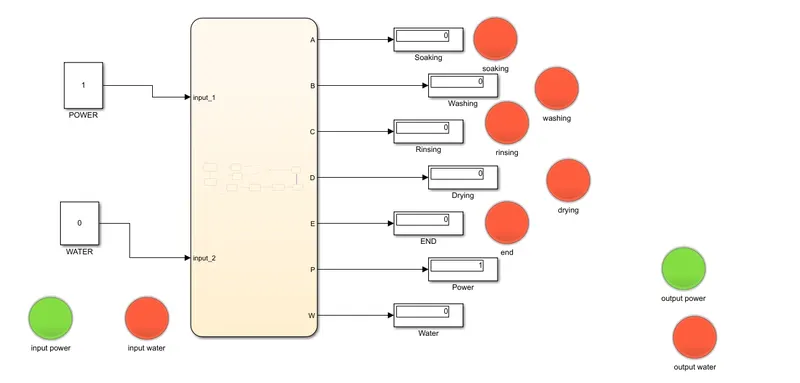
We can see input and output power is indicating ON and water supply is indicating OFF and process is stop.
Case 2 Power is on and water supply is on
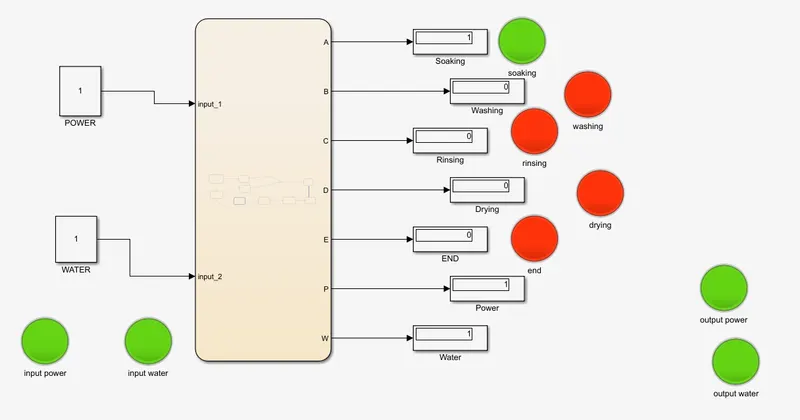
When both power and water is available then LEDs are indicating as green i.e. ON and soaking process is start. After certain time delay as provided in model states will change one by one. After soaking, washing then rinsing and then drying process start. As in drying there is no need of water so after this water supply is cut and indicated by LED shown below in figure
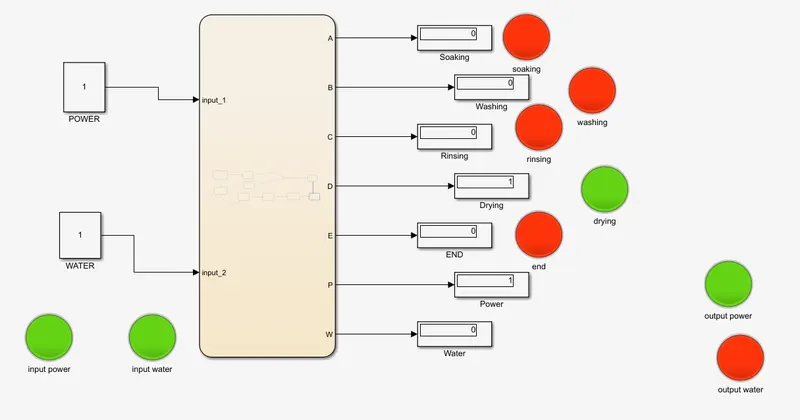
We can observe that input water supply is ON but output water supply is OFF. After drying finally process will stop.
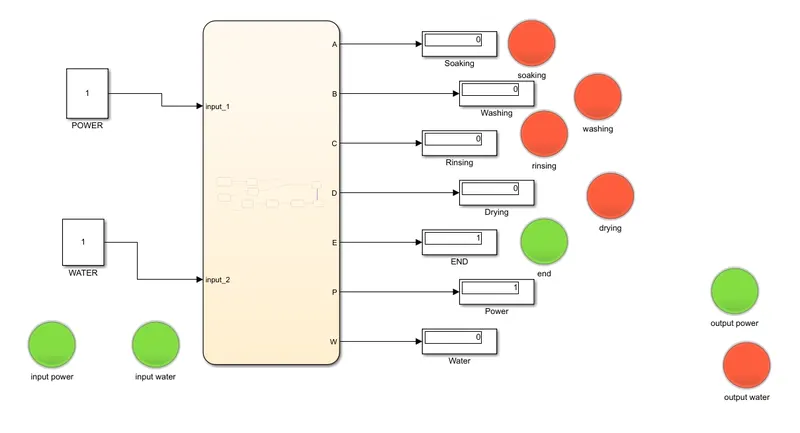
Result : When both power and water is available all states in chart will operate in sequentially after given time delay i.e. automatically.
PART 2 Chart for gear logic as given below-
Speed 0 to 15 16 to 25 26 to 40 41 to 60 61 and above
Gear 1 2 3 4 5
Similar to above problem chart is used to implement above logic. Different states are named in chart according to model.
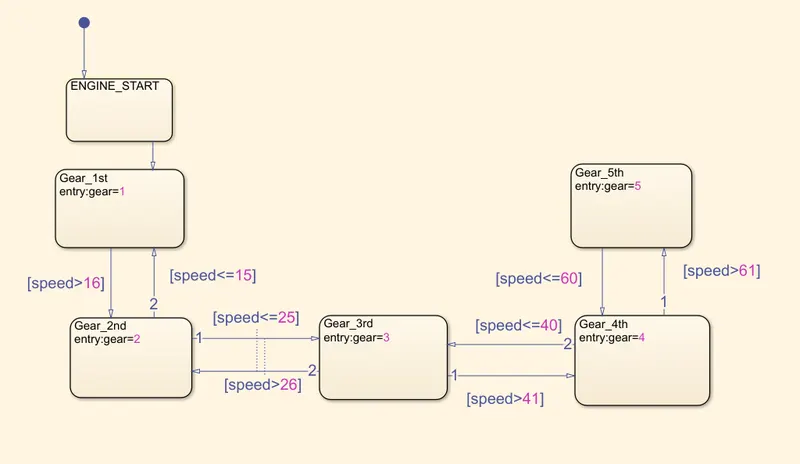
In figure we can see how control logics are provided in model so that system can change its state from one to another according to input. In this model there is one input port and one output port.
Speed is given as input and gear is displayed on output port.
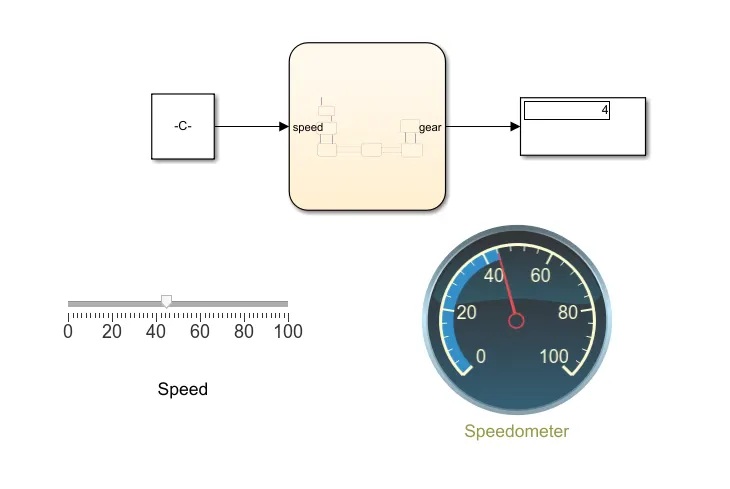
Slider is used to provide speed as input and speedometer is used to display the speed and gear number is shown in display block. Lets see what happens when speed is between 16 and 25 , which gear number is displayed.
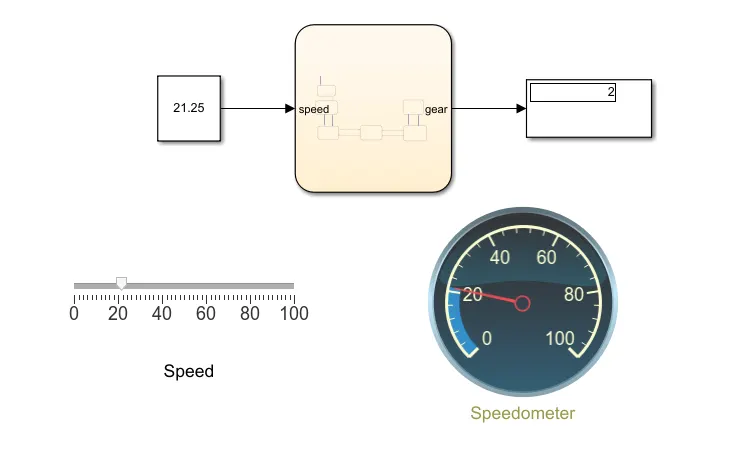
In above figure we can see that speed is 21.25km/hr and gear number displayed as 2 which is true according to conditions provided in problem.
Result : Similarly we can observe all gear output on changing speed with help of slider while simulation is running.