Week-4 Challenge WOT Condition Part-2
Aim:-
To study the powertrain blockset for EV & HEV for WOT drive cycle.
Objective:-
1) What is the difference between mapped and dynamic model of engine, motor and generator? How can you change model type?
2) How does the model calculate miles per gallon? Which factors are considered to model fuel flow?
3) Run the HEV Reference Application with WOT drive cycle. Change the grade and wind velocity in the environment block. Comment on the results.
4) Keeping all other parameters same, compare the simulated results of hybrid and pure electric powertrains.
Answer [1]:
a) Difference between mapped and dynamic model:-
Mapped Model:-
- The data used for the operation & simulation are to be entered in a form of Lookup Table which would be then configured with the operational parts and the analysis would be formed.
- The motor or engine torque required is sensed and motor or engine block generates the required output without considering the real time parameters.
- Output values are stored for corresponding given input values of engine, motor or generator.
- If lookup table data is available with us simulation becomes easier & it gives the result on basis of data interpreted. Also known as Global based Model.
- Accuracy of this type is not that high but simulation will be done in short time as it does not run by real time parameters.
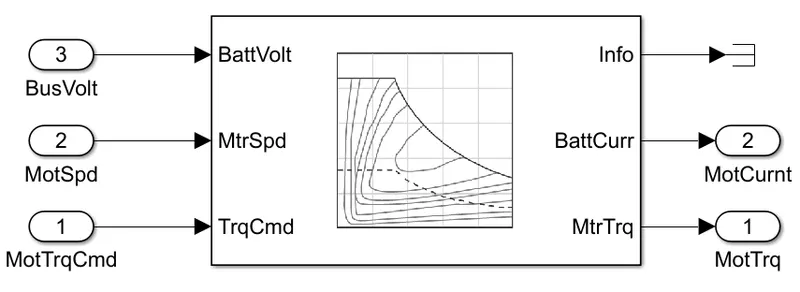
Fig.1:- Mapped model consisting of Lookup table.
Dynamic Model:-
- Dynamic model understands the behavior of the part/element and then behaves accordingly. It gives detailed analysis for the variations entered by us in the specifications whereas it stimulates according to real & dynamic operations.
- Dynamic model uses combination of the outputs from various subsystems to generate the output.
- Run by real time simulation where required input from drive cycle is taken & for that individual real time simulation gets performed and summing all the results of the subsystem gives output for simulation.
- Operates dynamically depending on the situation of operation detailed data and specifications are not required and the simulation gives the detailed analysis of the components simulated. Also known as Real time based model.
- Accuracy of this model is very high as it considers the real outputs from all subsystems to generate the output.
- Simulation takes very long time to complete as it has so many individual simulations running by all subsystem of the engine, motor & generator.
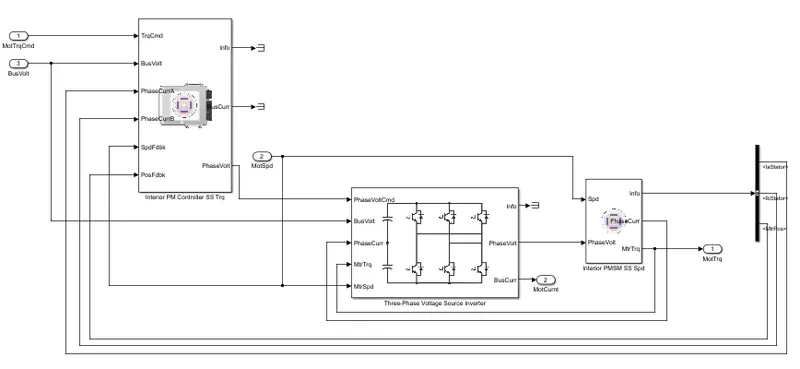
Fig.2:- Dynamic model.
b) How can you change model type?
We can change the type of model by just right click the block that we need to change. After that go to variant then Label Mode Active Choice and then select our choice as dynamic or mapped depending on requirement.
For example :-
- Consider the mapped motor for an HEV system:-
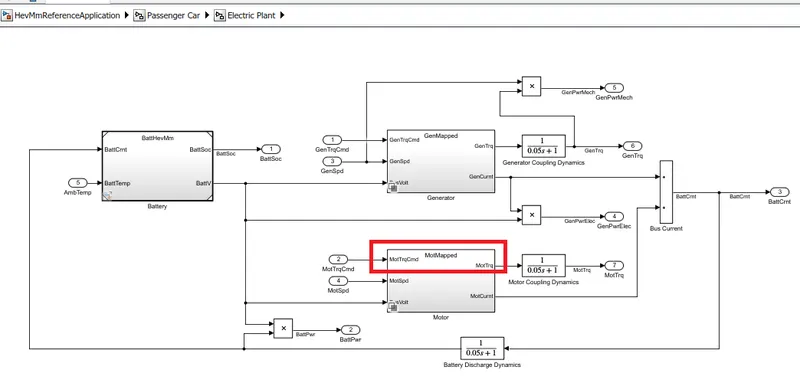
Fig.3:- Mapped motor.
- This mapped motor can be changed to dynamic motor type.
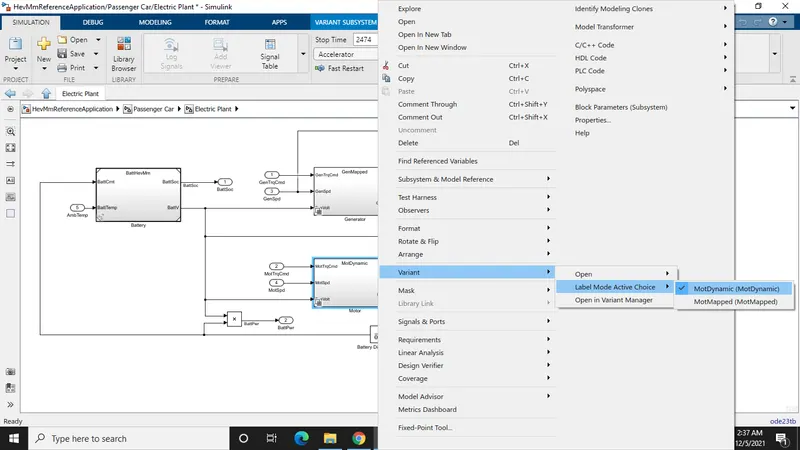
Fig.4:- Conversion steps.
- Thus we get the model as dynamic motor.
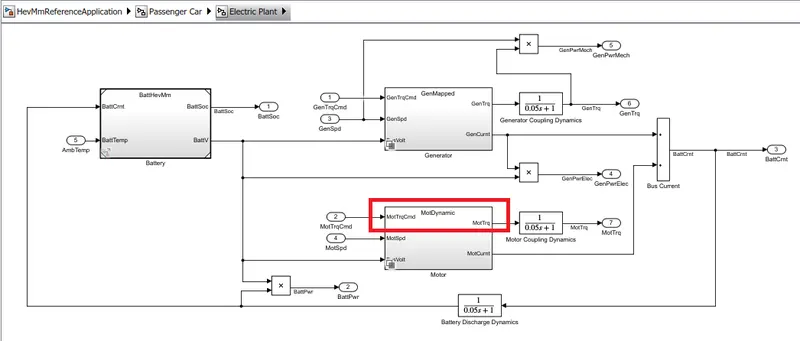
Fig.5:- Dynamic motor.
Answer [2]:
a) To calculate miles per gallon we need the hybrid electric vehicle.
Hybrid electric vehicle:-
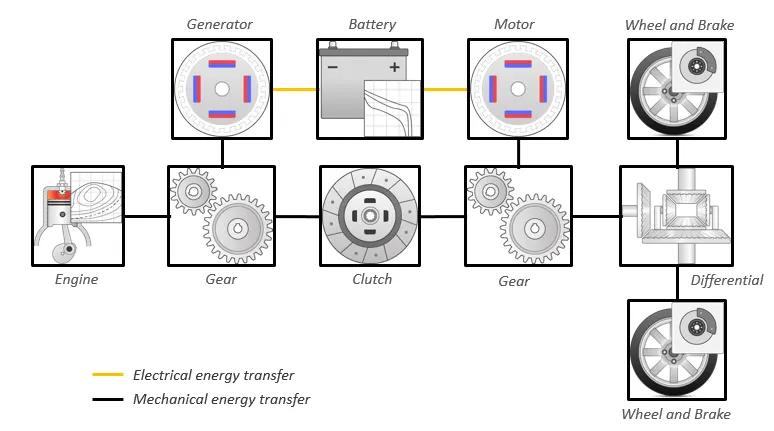
Fig.6:- Hybrid electric vehicle configuration.
- A hybrid electric vehicle is a type of hybrid vehicle that combines a conventional internal combustion engine system with an electric propulsion system.
- The presence of the electric powertrain is intended to achieve either better fuel economy than a conventional vehicle or better performance.
Now load the HEV multimode reference application in MATLAB & open the HEV model in simulink window.
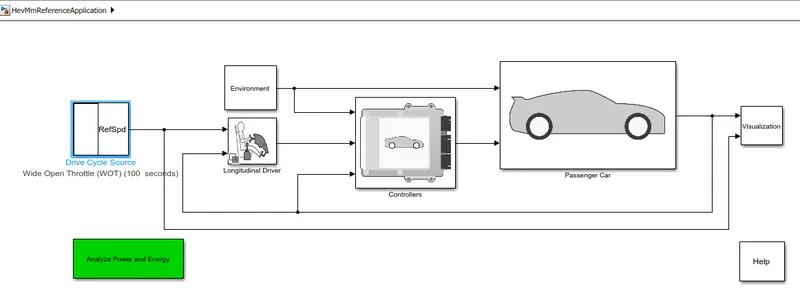
Fig.7:- Hybrid electric vehicle model.
Click on 'Visualization block' , in it click on 'Performance Calculations' block. This block is used to get the output as fuel economy in MPGe (miles per gallon). MPGe is the distance (in miles) travelled by the car per gallon of a fuel. Now study the performance calculation block to get output as miles per gallon.
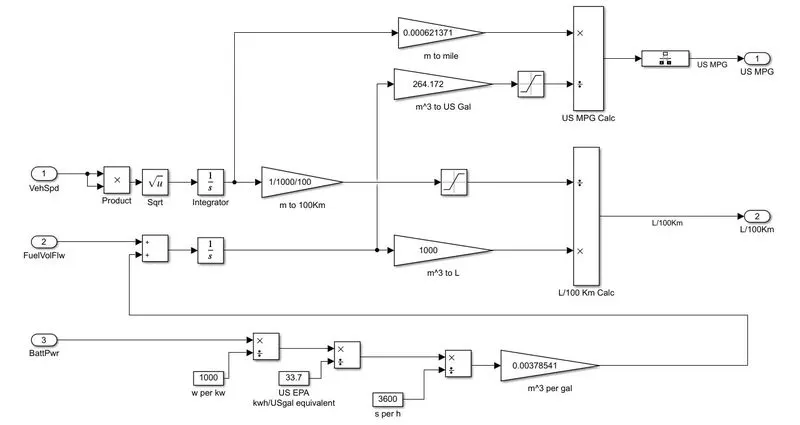
Fig.8:- Miles per Gallon Conversion Block.
- The battery power output in Watts is converted to KW by dividing it by 1000'. Then convert this value to (US EPA kmh/USgal equivalent) value by dividing it with '33.7'.
- Now to convert sec to hour divide the output by 3600. We get output in terms of KWs/Usgal. Now further multiply the output with the gain block by factor of 0.00378541 as we know 1gallon=0.003785411784m^3. Now unit of fuel energy & battery energy is same. Hence add this two values and integrate them to volume in m^3 by integrator.
- Convert this m^3 value to US Gal by multiplying gain by a factor of '264.172'. Give this value to saturation to limit input signal to the upper and lower saturation values.
- Now consider vehicle speed, square it using product block and then take square root of it so that we can get positive value vehicle speed. Now integrate the speed to get the distance travelled in m. Further m is converted into miles by multiplying gain block by factor of 0.000621371. This mile value is get divided by the output from saturation block i.e.US Gal. Thus output after division is in miles per gallon.
- In this way miles per gallon is calculated.
b) Factors are considered to model fuel flow are:- Vehicle speed, battery power, Fuel volume flow.
Answer [3]:
- To run the HEV Reference Application model with WOT drive cycle. Load the HEV multimode reference application in MATLAB. Then the model of HEV appears in simulink window.
Fig.9:- Simulink model for HEV.
- Double click on drive cycle block & select drive cycle source as 'Wide Open Throttle(WOT)'. Give some input values to it. Here we have given start time = 1sec, nominal reference speed = 50mph, time to start deceleration = 60s, and WOT simulation time = 100s. Lastly click on OK.
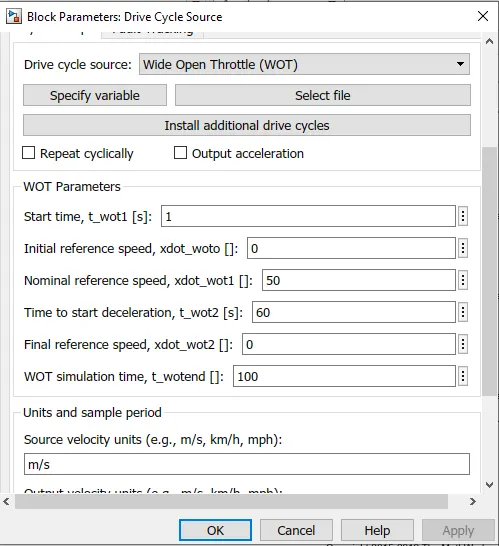
Fig.10:- Block parameter window of drive cycle source.
- Now double click on 'Environment block' in the model to change the grade & wind velocity.
Case I] When grade = 0 & wind velocity = 0m/s
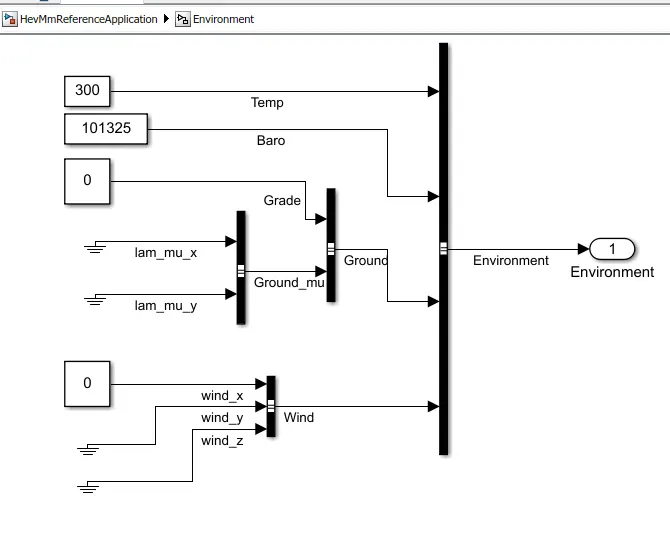
Fig.11:- Environment block subsystem of HEV where grade=0 & wind velocity=0.
- Now run the model to view the result for stop time=100sec. In the result we get six different types of plot to view.
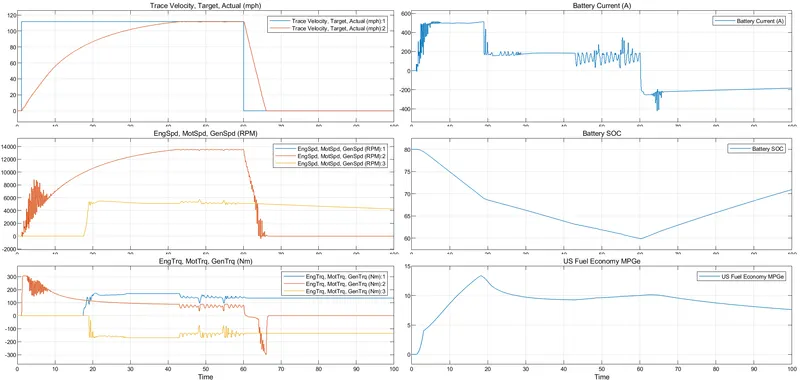
Fig.12:- Result of HEV system for grade=0 & wind velocity=0.
- Plot 1 is of velocity Vs time. Blue colour represents the input driving cycle. While orange colour represents output velocity. Here the vehicle accelerates till nearly 43sec and is kept constant till 60sec but after 60sec it start to decelerate. Maximum velocity achieved is near about 110mph at 60sec. Plot 2 is battery current Vs time. In accelerating mode current is positive while during deceleration it is negative. When motor speed is increased fast till 19sec at that time current is also increased, after that till 60sec current is nearly 200A as there is less change is motor speed.
- Plot 3 shows the change in speeds of engine (blue), motor (orange) & generator (yellow) with respect to time. Here engine is not used, vehicle takes supply from battery itself. For 19sec the motor speed increases drastically at that time generator speed is zero. After 19sec till 60 sec the motor speed is gradually increased at that time generator speed is increased. Plot 4 is Battery SOC vs time. Here SOC is decreased from 80% to 60% and after 60sec i.e. during deceleration SOC increases as battery is get charged.
- Plot 5 shows torque characteristics of engine (blue), motor (orange) & generator (yellow). Plot 6 is fuel economy in MPGe (mile per gallons) vs time. The fuel economy is suddenly increase when there is sudden decrease in SOC upto nearly 19 sec. After 19 sec fuel economy reduces very slow.
Case II] When grade = 5 & wind velocity = 10m/s
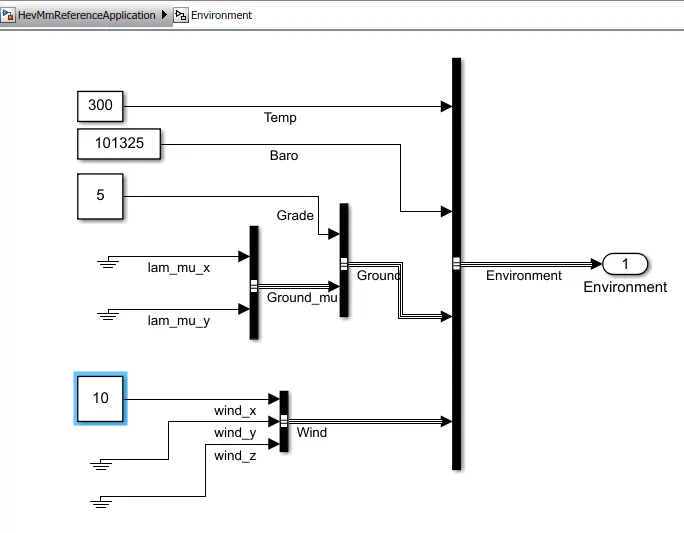
Fig.13:- Environment block subsystem of HEV where grade=5 & wind velocity=10.
- Now run the model to view the result for stop time=100sec. In the result we get six different types of plot to view.
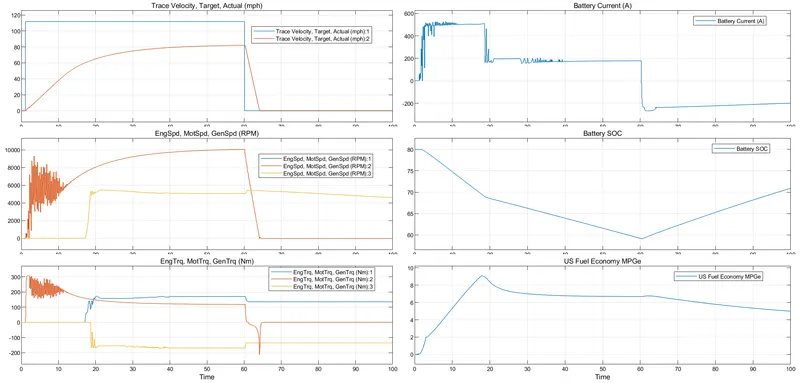
Fig.14:- Result of HEV system for grade=5 & wind velocity=10.
- Although we have kept same driving cycle & vehicle parameters as previous case, the grade and wind velocity is changed. We have changed grade from '0' to '5' & wind velocity from '0' to '10'.
- Plot 1 is of velocity Vs time. Blue colour represents the input driving cycle. While orange colour represents output velocity. Here the vehicle accelerates till nearly 60sec and after 60sec it start to decelerate. Maximum velocity achieved is near about 82mph at 60sec. Plot 2 is battery current Vs time. In accelerating mode current is positive while during deceleration it is negative. When motor speed is increased fast till 19sec at that time current is also increased, after that till 60sec current is nearly 200A as there is less change is motor speed. The only difference in previous case and this case is that current is less oscillating here.
- Plot 3 shows the change in speeds of engine (blue), motor (orange) & generator (yellow) with respect to time. Here engine is not used, vehicle takes supply from battery itself. For 19sec the motor speed increases drastically consists of more oscillations than previous case at that time generator speed is zero. After 19sec till 60 sec the motor speed is gradually increased at that time generator speed is increased. Plot 4 is Battery SOC vs time. Here SOC is decreased from 80% to 60% and after 60sec i.e. during deceleration SOC increases as battery is get charged.
- Plot 5 shows torque characteristics of engine (blue), motor (orange) & generator (yellow). Plot 6 is fuel economy in MPGe (mile per gallons) vs time. The fuel economy is suddenly increase when there is sudden decrease in SOC upto nearly 19 sec. After 19 sec fuel economy reduces very slow.
Answer [4]:
Keeping all other parameters same, compare the simulated results of hybrid & pure electric powertrains.
Pure electric vehicle:-
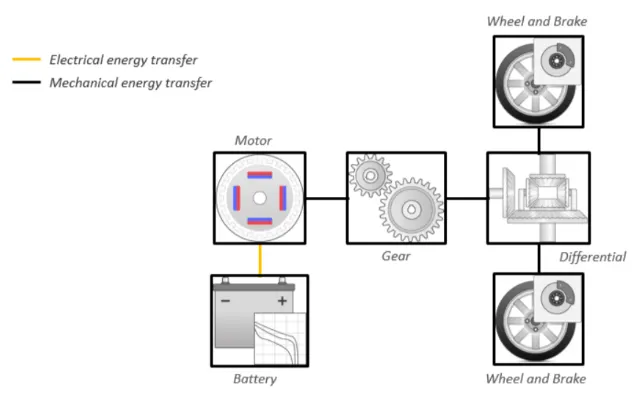
Fig.15:- Electric vehicle configuration.
- Pure Electric Vehicles also know as battery electric vehicles. There is no combustion engine present which means they are the cleanest option.
- An electric vehicle (EV) is a vehicle that uses one or more electric motors for propulsion.
Here we have to compare both hybrid and electric vehicle. For hybrid results ref to fig.14 where grade=5 & wind velocity=10m/s. Now build EV model for same parameters to compare with hybrid model. For this load the 'Electric Vehicle Reference Application' file in Matlab. Then the model of pure EV appears in simulink window.
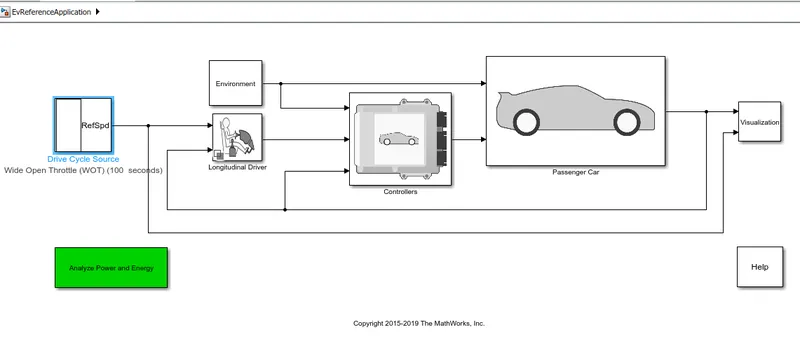
Fig.16:- Simulink model for pure EV.
- Double click on drive cycle block & select drive cycle source as 'Wide Open Throttle(WOT)'. Give some input values to it. Here we have given start time = 1sec, nominal reference speed = 50mph, time to start deceleration = 60s, and WOT simulation time = 100s. Lastly click on OK. Same as in case of HEV.
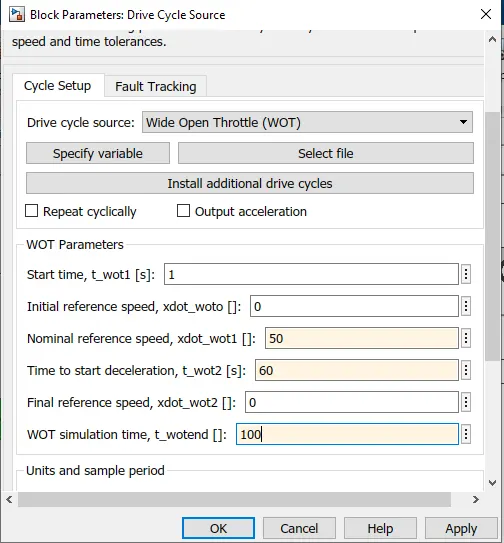
Fig.17:- Block parameter window of drive cycle source.
- Now double click on 'Environment block' in the model to change the grade & wind velocity. Keep grade = 5 & wind velocity = 10m/s.
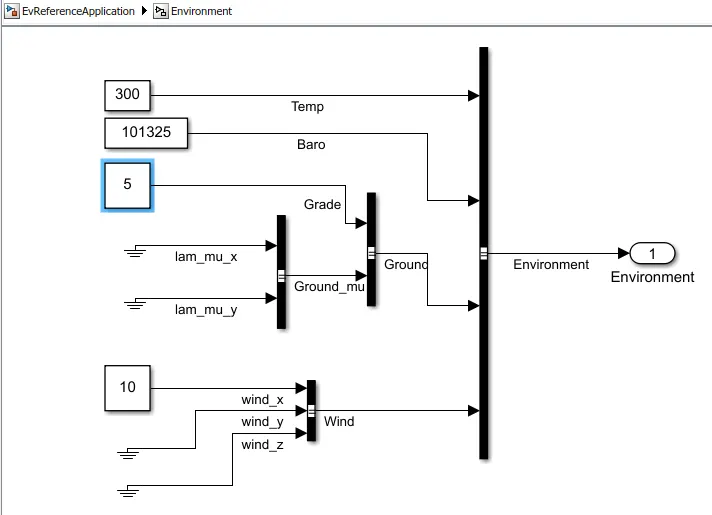
Fig.18:- Environment block subsystem of EV where grade=5 & wind velocity=10.
- Now run the model to view the result for stop time=100sec. In the result we get six different types of plot to view.
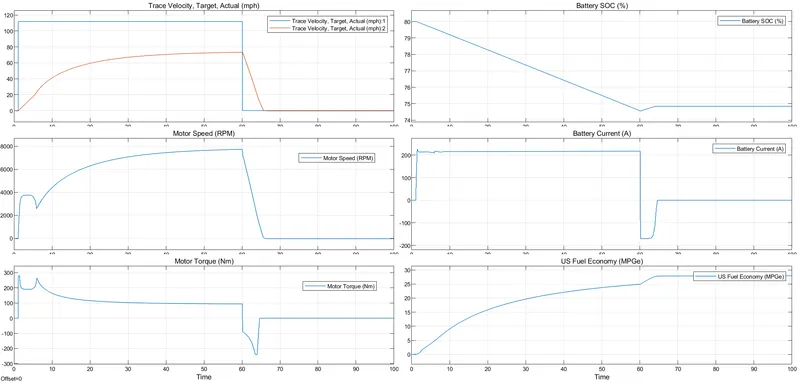
Fig.19:- Result of EV system for grade=5 & wind velocity=10.
- Plot 1 is of velocity Vs time. Blue colour represents the input driving cycle. While orange colour represents output velocity. Here the vehicle accelerates till nearly 60sec and after 60sec it start to decelerate. Maximum velocity achieved is near about 72mph at 60sec. Plot 2 is motor speed Vs time. Here when there is fast increase in vehicle speed after 1sec till nearly 5sec, there is drastic change in motor speed upto 3900rpm. When there is very little change in vehicle speed, at that time motor speed is decreased say till 7sec. And after that till 60sec as vehicle speed is increased gradually, motor speed is also increased upto 7900rom. After 60sec during deceleration motor speed is also decreased and finally comes to '0' when vehicle is at rest.
- Plot 3 is motor torque Vs time. We know motor speed and motor torque are inversely proportional so here the graph of motor torque is opposite to motor speed plot. Plot 4 shows battery SOC plot vs time. Here SOC is decreased from 80% to 74.7% and after 60sec i.e. during deceleration SOC slightly increased as battery get charged. When vehicle is at rest, SOC remains constant.
- Plot 5 is Battery current VS time. When battery is discharging the battery current is high upto 220A till 60sec. At 60sec, the current suddenly becomes negative as battery enters in charging state. Till the battery is in charging state, the current is negative. After that when vehicle is at rest, the current becomes '0 Ampere'. Plot 6 shows the fuel economy in MPGe (mile per gallons) vs time. Here there is no fuel in EV however this gives equivalent battery energy required that of the fuel energy and calculate fuel efficiency. The maximum miles that car can travel per gallon is 27miles, for given EV vehicle.
Compare the simulated results of hybrid & pure electric powertrains:-
- From both the simulated results we can say that the motor speed & torque plot of EV consists of less damping than HEV.
- Electric vehicle produces more values of motor speed and more torque compared to hybrid electric vehicles motor alone, but HEV when combines the torque of both motor and its engine it is higher than the EV torque. This is responsible to pull the HEV at higher top speed compared to EV.
- Efficiency of EV is higher than HEV which is evident from miles per gallon number of both cars.
- Battery current in EV is remained unchanged from 1 to 60sec till the battery gets discharged but in case of HEV there is change in current as soon as the engine comes into action.
- Similarly for SOC of EV linearly decreases during discharging mode but in case of HEV it do not vary linearly. This is because in HEV engine comes into action.
- In EV when vehicle is at rest condition (after60 sec), battery current suddenly becomes '0 ampere', while in case of HEV it keeps constant showing last current value before vehicle is at rest.
- SOC is kept constant when EV is at rest (after60 sec) while in HEV SOC keeps on increasing. This is because engine keeps on deliver the supply to battery for it to be charged.
Conclusion:-
We can conclude from this challenge that we can differentiate mapped and dynamic model and how to convert its type. Also learnt how miles/gallon is calculated in model. We also studied HEV & EV powertrain model with WOT drive cycle.