Week -2
Answer [1]:
Aim:-
To create a Simulink model of Doorbell using Solenoid block.
Objective:-
The main objective is to build a doorbell model and create a situation where the switch is closed for 2 seconds and then released. Also observe the physical movement of the plunger.
Basic Schematic Diagram:-
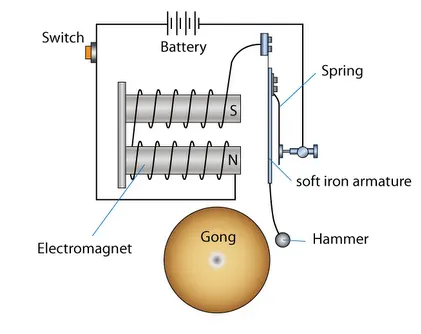
Fig 1:- Basic circuit diagram of Doorbell.
The electric doorbell is a simple device that generates sound on completing the circuit by pressing switch/button. The switch is pressed and current flows through the circuit from battery. Due to the current flow, electromagnet is energized and it generates a magnetic field that attracts the iron strip towards it. Due to this hammer/striker will strike the bell/gong. This produces the doorbell sound. As soon as current flowing through circuit is restricted by opening of switch, the circuit breaks and the circuit is incomplete again. Thus the hammer return to its original/rest position and the noise is also stopped.
Simulink Model:-
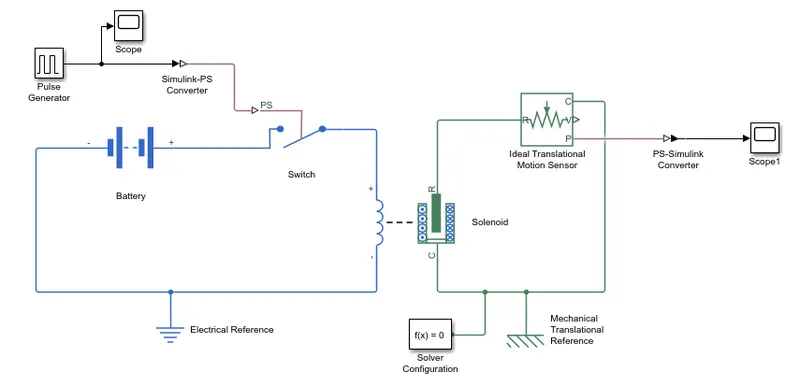
Fig 2:- Simulink model of Doorbell using solenoid block.
Simulink Model Description:-
The above figure (fig 2) is the model of Doorbell using solenoid block & different simulink blocks. From the schematic diagram of doorbell, we will get rough idea that we need a battery, a switch, a solenoid, something as a input for switching action and display to view a result. So to get all these devices in simulink model, we have used the blocks that perform same action in simulink as that of above mentioned devices. So first take the “Battery block” to represent battery of 12V, then “Solenoid block” consisting of 4 ports (+ve, -ve, R and C ports) to represent solenoid and “Switch block” consisting of 3 ports to represent a switch, from the library browser of simulink. To build a model, first connect the battery’s positive terminal to switch and connect the other terminal of switch to positive terminal of solenoid block. Also connect negative terminals of battery and solenoid together. Now for switch to operate we need to provide “Physical signal” through “PS” port in the switch block.
Now we used a “Pulse Generator block” to provide a physical signal for operating the switch, which generates the continuous square pulse. The pulse generator block is connected to third port of switch (“PS” port) through “Simulink-PS Converter block”. Pulse generator block is simulink system block and switch is a physical system block to connect this both system blocks we have used “Simulink-PS Converter block”. We have also connected one scope at pulse generator block side, so that we can observe the input signal/waveform given to switch.
Solenoid block has R & C ports which are mechanical translational conserving ports that represent Plunger and case (fixed point) respectively. We need a block which senses the position of plunger in the solenoid block, for this we have used “Ideal Translational Motion Sensor block”. The “R” port of solenoid block is connected to the “R” port which is input port of ideal translational motion sensor block. Similarly “C” ports of both solenoid block and ideal translational motion sensor block are connected to each other. The “Ideal Translational Motion Sensor block” has two output ports given as “V” & “P” which represent velocity and position of the plunger. Here we are only interested in change in position of the plunger, so we need results of “P” output.
Since position of plunger is an output from “Ideal Translational Motion Sensor block” which is a physical system block need to be connected to “PS-Simulink Converter block” before connecting to “Scope block” which is simulink system block. Port “P” is connected to the “PS-Simulink Converter block” where physical value from port “P” is converted into simulink value and then this “PS-Simulink Converter block” is connected to “Scope block” which will generate a plot for change in position of plunger. “Solver Configuration block” is also connected anywhere in the model, it generates equations and solve the whole model in the back end, to give the results of whole simulink model. The “Electrical Reference block” is connected between the negative terminal of battery block and negative terminal of solenoid block. Also “Mechanical Translational Reference block” is connected between the “C” port of the solenoid block and ideal translational motion sensor block. In this way a model is created and run for a doorbell system.
Generation of Input Signal:-
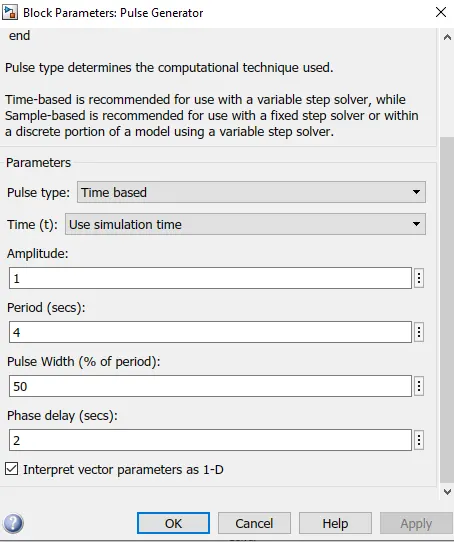
Fig 3:- Pulse Generator block parameters.
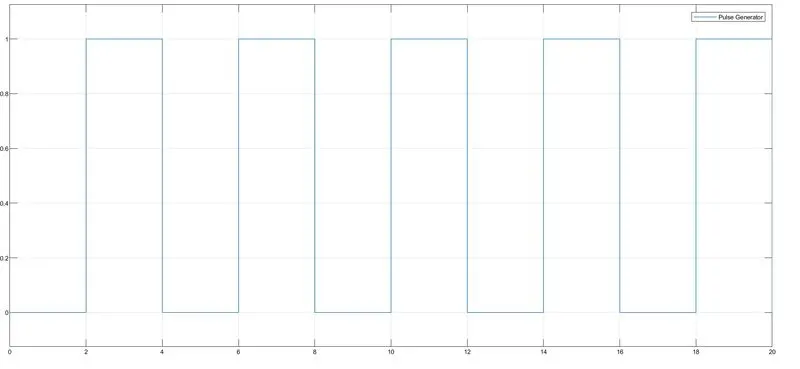
Fig 4:- Input signal from Pulse Generator.
To operate the switch (shown in Fig 2) of the model, we need to provide the input signal. This input signal is generated by using "Pulse Generator block". For this we have to provide some input parameters as shown in Fig 3. It is given that we need to operate switch for 2 seconds. For this we have given period value as “4”, pulse width as “50 (% of period)”, phase delay as “2 seconds” and keeping amplitude by default “1”.
Figure 4, shows the input signal that we are going to provide for switch. After running the simulation, we get the input signal plot as in figure 4. Initially the pulse is zero. Since phase delay is of “2 sec” so till 2 sec, the pulse will be zero for 2 seconds. At a time of “2 seconds” pulse will start rising from zero to 1, as amplitude given is “1”. So for next 2 sec, the pulse will be “1” and then it will again come down to zero at “4th second”. For next 2 seconds i.e. up to 4-6 seconds, again the pulse is zero and for time period of “6-8 seconds” again the pulse is “1”. In this way, the cycle keeps on repeating the pattern in which only for “2 seconds” the pulse is “1” and for remaining “2 seconds” the pulse is “zero” as period given is “4 seconds”. When amplitude/pulse is “1” it signifies that the switch is closed and current starts flowing in the circuit, giving desired output and when pulse is “0”, the switch is open and current stops flowing in the circuit. In this way a input pulse signal is generated to get the desired output.
Simulation Results From Scope:-
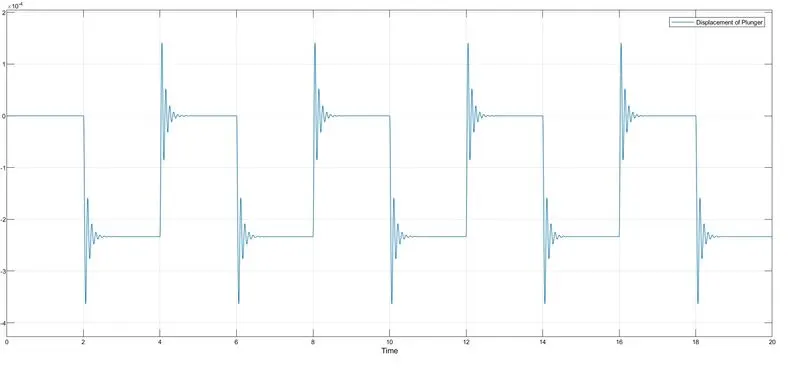
Fig 5:- Plot showing displacement of plunger for all default values.
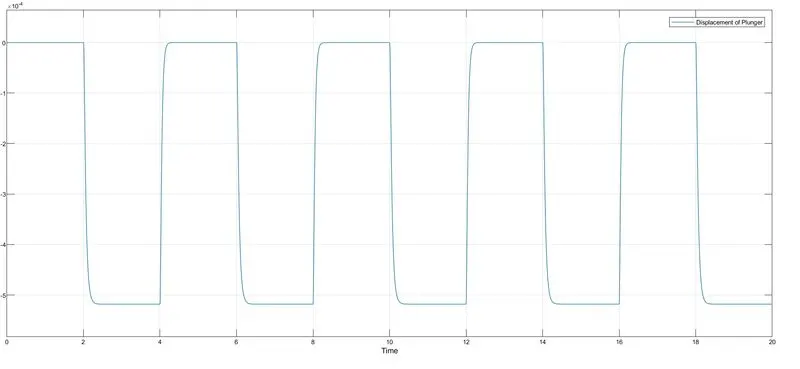
Fig 6:- Plot showing displacement of plunger for spring constant (K) =100 and damping=5.
Figure 5, shows the displacement of a plunger for all default values when battery of 12V is given. The figure tells us that, when initially the switch is open for 2 seconds, circuit is incomplete at that time the plunger is away from port C of solenoid and when switch is closed for next 2 seconds, the circuit is complete at that time the plunger starts to displace to the near port C of solenoid. From this, we can observe that when circuit is closed the distance between plunger & port C is reduced, resulting the Doorbell to produce the sound and when circuit is open the distance between plunger & port C increases. This cycle continues for complete time interval. During the change in operation of a switch (i.e. opening and closing of switch), we can observe that some spikes are produced for very small amount of time. This is because of the recoil of spring, each time when plunger is moving.
In order to reduce the spikes, in "Solenoid block" we will reduce the spring constant from "default value" to "100" and increasing the damping coefficient from "default value" to "5". This will result in smooth waves.
Conclusion:-
Thus by creating a doorbell model, we have observed & simulated the movement of a plunger. Also we have created a situation where the switch is closed for 2 seconds and then released for 2 seconds.
Answer [2]:
Aim:-
To build a simulink model using a thermistor, to sense the temperature of a heater & turn on or turn off the fan.
Objective:-
The main objective to build this model is to sense the temperature and turn ON/OFF the fan by considering following conditions-
Temperature source: 20 °C from 0 to 10 seconds, 27 °C from 10 to 30 seconds, 23 °C from 30 to 50 seconds
Fan conditions: ON if the temperature is above 25 °C and OFF otherwise
Simulink Model:-
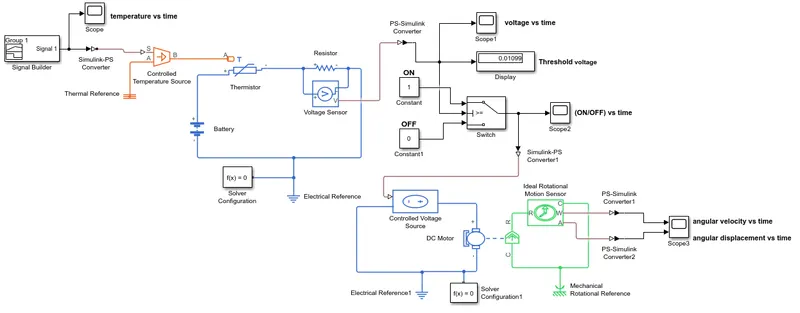
Fig 7:- Simulink model for Fan operating system using thermistor.
Simulink Model Description:-
The above figure 7 is the simulink model for Fan operating system using thermistor. We want to sense the temperature & turn ON or OFF fan by considering few conditions. For this purpose we have used first the "Signal Builder block". Signal builder generates the input pulse that we want to give as input for a thermistor. Figure 8, shows the input signal generated using signal builder block. The input pulse generated from signal builder block is: for time 0-10seconds, it shows temperature of 20°C (i.e. 293K); for 10-30seconds, it shows temperature of 27°C (i.e. 300K) & for 30-50seconds, it shows temperature of 23°C (i.e. 296K).
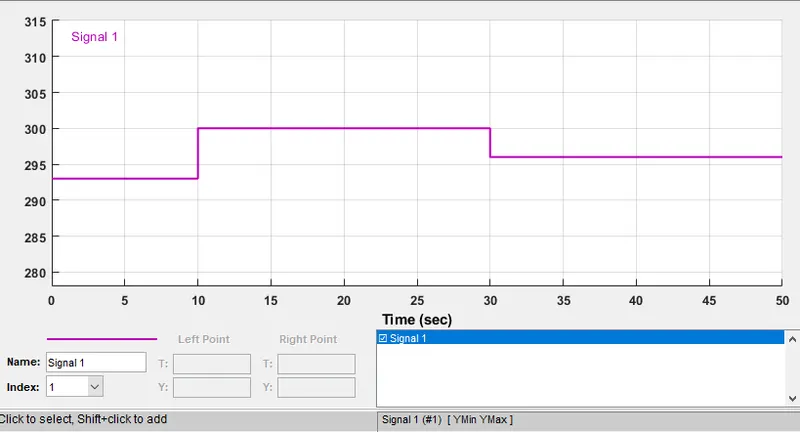
Fig 8:- Input Signal generated in signal builder.
The input generated in "Signal Builder block" is given to scope to examine input; also it is further given to "Controlled Temperature Source block" through "Simulink-PS Converter block". As signal builder is simulink system block and controlled temperature source block is physical system block, so we need a "Simulink-PS Converter block". Signal from "Simulink-PS Converter block" is given to "Controlled Temperature Source block". "Controlled Temperature Source block" is used to control the temperature value that further gives filtered input to thermistor block. Controlled Temperature Source block consists of three ports i.e. 'A', 'S' & 'B'. Port 'A'is grounded to thermal reference. The temperature difference is set by the physical signal port 'S'. If value of port 'A' is greater than port 'S', then signal will not pass further. If value of port 'B' is greater than port 'A' that means value of port 'S' is greater than port 'A', then signal will pass further to "Thermistor". A Thermistor block, temperature priority is set to 'Low'. Thermistor used here is 'NTC thermistor'. Resistance of NTC thermistor will decrease as the temperature increases. "Thermistor block" is connected to a 12V "Battery" and a "Resistor" of 1 ohm in series. A "Voltage Sensor block" is connected in parallel to a "Resistor block", in order to sense the voltage drop across resistor. Then the negative of resistor is given back to the battery and circuit is completed. This electrical circuit is grounded with a "Electrical Reference" and a "Solver Configuration block" is also provided.
Voltage sensor block's third port 'V' is a physical signal port that outputs voltage value. In order to examine this output voltage values, the physical signal is converted into simulink signal by using "PS-Simulink Converter block". Hence further this converted signal is given to "Scope" to view the plot of voltage with respect to time and also given to "Display" to get the threshold voltage value. Also the converted signal of voltage sensor is given to a condition switch. This "Switch" consists of 3 ports. The first and third input ports of switch are data ports, and the second input port is the control port. The signal from PS-Simulink Converter block is given to the second input port of a switch. First and third input ports of switch are provided with constant values, "1" to first port and "0" to third port. The signal passes through input 1 when input 2 satisfies the selected criterion; otherwise, pass through input 3. The criteria for passing first input: value > threshold. We assign the threshold value to the switch from "voltage vs. time graph" obtained in the scope. We want a fan to be ON if the temperature is above 25°C i.e 298K. The voltage value at 298K is 0.012; this is the threshold value that is set for the switch. So when voltage at port 2 of switch is below or equal to the threshold value [i.e. below or equal to 25°C (298K)], the third input port of switch is provided i.e. the "0" value is passed further through the switch resulting fan to be OFF. Also when voltage at port 2 of switch is above the threshold value [i.e. above 25°C (298K)], the first input port of switch is provided i.e. the "1" value is passed further through the switch resulting fan to be ON. This ON/OFF operation of the fan with respect to time is observed through one more "Scope". The output signal from switch is examined through "Scope".
We can get the required result of a fan to be ON/OFF either by using condition switch as explained above or by using DC motor as a fan. For a DC motor case, the output signal from switch is converted to physical signal using "Simulink-PS Converter block". This converted signal is further given to physical signal input port of "Controlled voltage source". The "Controlled voltage source" maintain the specified voltage at its output regardless of the current passing through it. The positive and negative terminals of controlled voltage source are given to the positive and negative terminals of "DC Motor". The "Electrical Reference" and "Solver configuration" are given to this circuit. The rotary part of motor is connected to the "Ideal Rotational Motion Sensor". Port R of motor that represents rotor of the motor is connected to the port R of ideal rotational motion sensor. Similarly port C of motor that represents motor case is connected to the port C of ideal rotational motion sensor. "Ideal Rotational Motion Sensor" has two more ports i.e. 'W' and 'A', these are physical signal output ports for angular velocity and angular displacement, respectively. This physical signal outputs are converted to simulink by using "PS-Simulink Converter block" for both outputs. These converted outputs are given to scope to view the results. As there is a mechanical system involved so we provide the "Mechanical Reference" to circuit. In this way a model is build for Fan operating system using thermistor.
Simulation Results From Scope:-
1] Output from Signal builder:
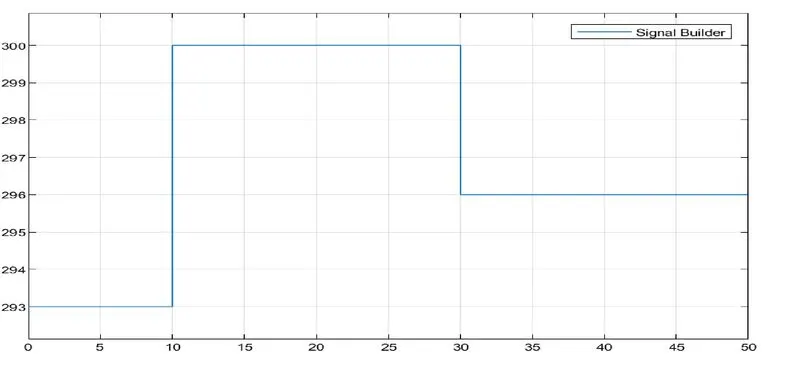
Fig 9:- Input Signal generated from Signal Builder.
The above plot is of "Temperature Vs Time". The input signal generated in Signal Builder block is examined in the scope. From plot we can see that the condition given for us regarding temperature is fulfilled. Therefore the given input is:-
For time period "0-10sec" → temperature is 293K (20°C).
For time period "10-30sec" → temperature is 300K (27°C).
For time period "30-50sec" → temperature is 296K (23°C).
2] Output from Voltage sensor:
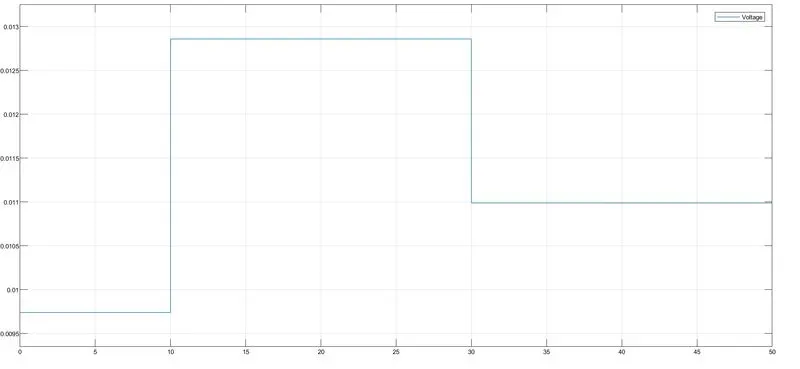
Fig 10:- Plot shows change in voltage with respect to time.
The above plot is of "Voltage Vs Time". From this plot we can find what the voltage value is at that particular time; which indirectly tells at a particular temperature what particular voltage value is. We know fan to be ON, the temperature should be above 25°C. Therefore at 25°C (298K), the voltage value is approximately "0.012", from plot. This value is entered in switch block as a threshold value.
3] Output from Switch:
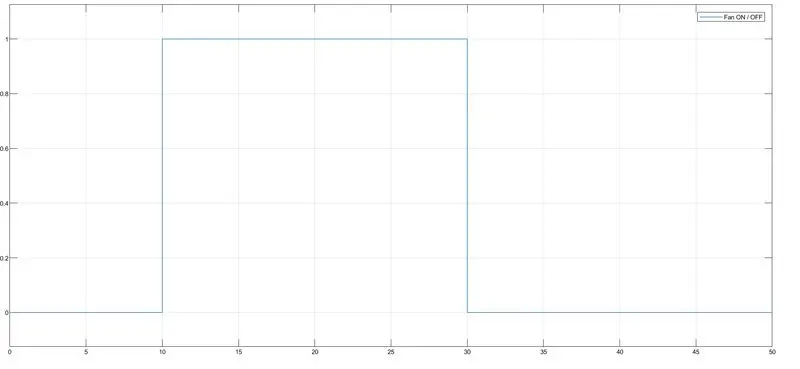
Fig 11:- Plot showing fan ON/OFF with respect to time.
The above plot is of "Fan ON/OFF Vs Time". If the voltage (shown in fig 10) is below or equal to the threshold value, then fan is OFF and if voltage (shown in fig 10) is above threshold value, then fan is ON. Switch takes care of this condition. So you can see from this plot:
For time period "0-10sec" → Fan OFF (i.e. constant 0 passes through switch).
For time period "10-30sec" → Fan ON (i.e. constant 1 passes through switch).
For time period "30-50sec" → Fan OFF (i.e. constant 0 passes through switch).
This is happening because it is given that fan is ON when the temperature should be above 25°C (298K), otherwise it is OFF. So here for 27°C (300K), i.e. for time period "10-30sec", the fan is ON and for rest time it is OFF.
4] Output from Ideal Rotational Motion Sensor:
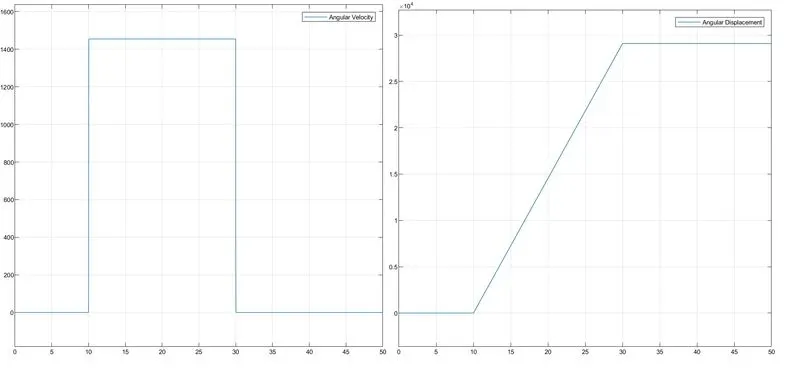
Fig 12:- Angular velocity and angular displacement with repect to time.
The above figure shows two different plots. One "Angular Velocity Vs Time" and other is "Angular Displacement Vs Time". Plot for "Angular Velocity VS Time" shows same pattern as "Fan ON/OFF Vs Time" graph as both the graph represents ON and OFF operation of fan. "Angular Velocity VS Time" shows that fan is ON for time period "10-30sec", as it shows some angular velocity and for the rest of the time it is OFF as angular velocity is "zero". Here from "Angular Displacement Vs Time" plot we can also see that, for time period "10-30seconds" i.e. when fan is ON, there is linear increase in angular displacement and for the rest i.e. when fan is OFF, there is no change in it.
Conclusion:-
From this we can conclude that Fan is ON for 10-30seconds and OFF for rest time. This fan ON/OFF condition is achieved either by using Switch or by using DC motor also. Similar approach can be used for simulating other physical device using Simulink.