Week-4 Challenge WOT Condition Part-2
Aim:
- To study the difference between the mapped and dynamic models of engine, motor, and generator and check if the model type can be changed.
- To study the calculation of miles per gallon by the model and the factors that are considered to model fuel flow.
- To run the HEV ReferenceApplication with WOT drive cycle and comment on the results by changing the grade and wind velocity in the environment block.
- To compare the simulated results of hybrid and pure electric powertrains by keeping all other parameters the same.
Solution 1:
Difference between the mapped and dynamic models of engine, motor, and generator
| Mapped Engine | Dynamic Engine |
|
Mapped engines represent macro engine behavior as a set of lookup tables (brake torque, fuel flow, air mass flow, exhaust temperature, efficiency, and emissions) as functions of commanded load and measured engine speed. |
Dynamic engines decompose engine behavior into individual component models that account for engine dynamics, most notably intake airflow and turbocharger dynamics. |
|
Mapped engine models are suitable for analysis and design activities that do not require engine subsystem dynamic characteristics, for example, in engine and transmission powertrain matching analysis for fuel economy, emissions, and performance tradeoffs. |
Dynamic engine models are suitable for designing control, estimator, and diagnostic algorithms that depend on dynamic subsystem states, for example, in closed-loop AFR control algorithm development. |
| In mapped models, the data is taken from a lookup table that characterizes the Engine/Motor/Generator performance under certain parameters. This model leads to faster solving times | Dynamic models are used if you need more detailed and component-level data and to analyze the impact of individual engine/Motor/Generator components on the overall performance. |
Steps to change the model type:
- Open the powertrain blockset for the required vehicle and click on the passenger vehicle block.
- Select the electric plant or engine plant block.
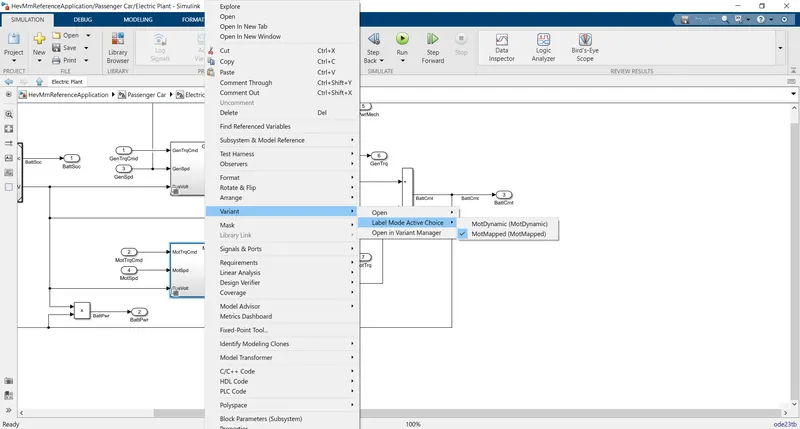
- Next, Right-click on the Engine/Motor/Generator based on vehicle model, select the Variant and select Label Mode Active Choice and choose Mapped or Dynamic for the required calculation.
Solution 2:
For a conventional gasoline vehicle, the fuel efficiency is calculated via miles-per-gallon (MPG). However, the fuel efficiency for hybrid models is calculated via miles-per-gallon equivalent (MPGe).MPG is the number of miles your car can drive per gallon of gas. Figuring out an MPGe rating is a little more complicated. Since engines that use an alternative source of fuel can’t be measured by liquid gallons of fuel, the MPGe rating is calculated by figuring out the number of miles a vehicle can go using the same energy content as a gallon of gas. The EPA calculates that 33.7 kilowatt-hours of electricity are equivalent to one gallon of gas.
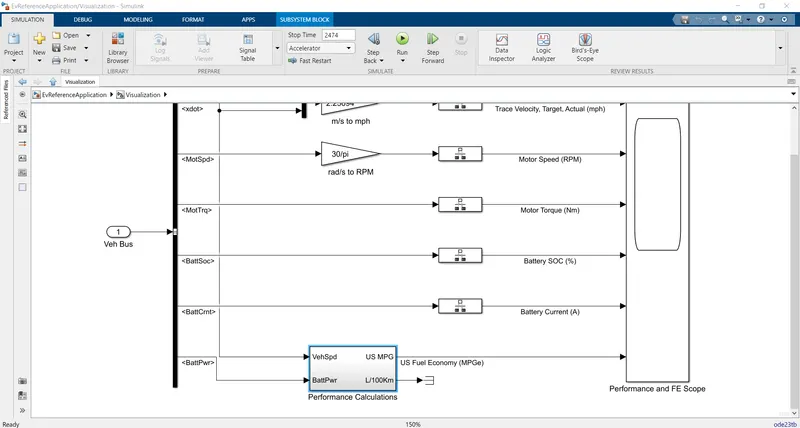
By clicking on the Performance Calculations Block, we get the below output which shows the calculation of miles to gallons by the model:
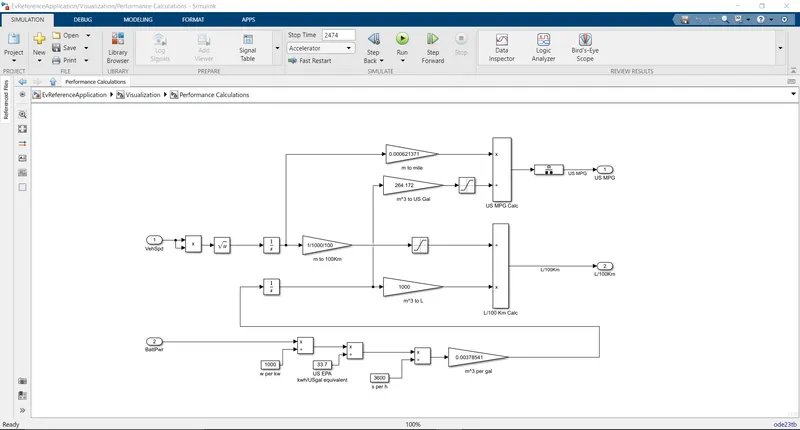
The model calculates the MPG & L/100km by considering the Vehicle Speed, Fuel volume flow & Battery power as Input.
The Inputs for the US MPG calculation are Vehicle speed in Miles & fuel flow volume in US gallons.
The vehicle speed input is in m/s which is converted into miles by multiplying with 0.000621371.
Similarly, the kilogram of fuel is converted into cubic meters by multiplying by 1/(1000*0.739).
This cubic meter value is then converted into gallons by multiplying it with 264.172. The mile value and gallon value are used to find the MPG of the vehicle.
Now the battery value is initially converted from watts to kWh by dividing with 1000 and then to gallon equivalent by again dividing it with 33.7 (since 33.7 kWh = 1 gallon).
Then the value is divided by 3600 to get in per second and multiplied by 0.00378541 to get the value in cubic meters per gallon.
Solution 3:
The Drive Cycle source is changed to WOT cycle with a simulation time of 100 seconds.
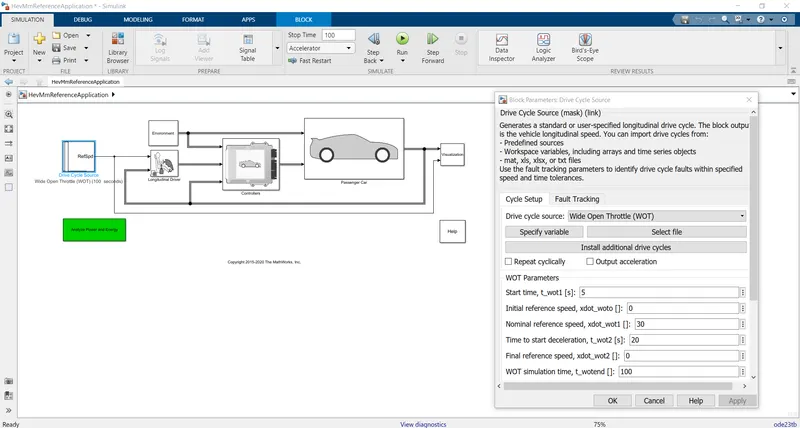
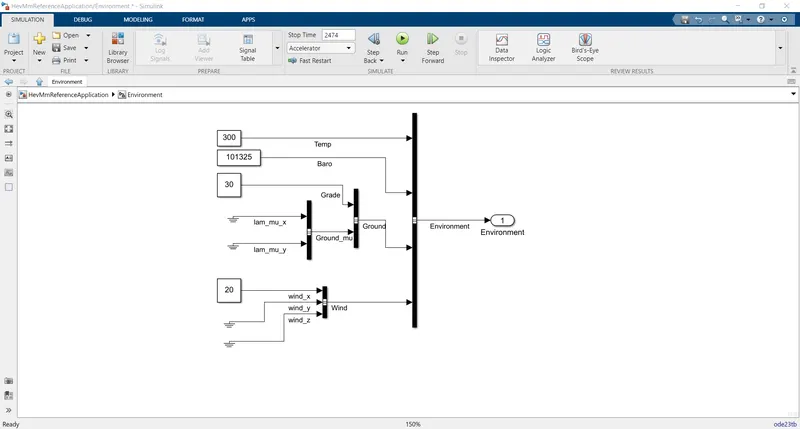
In the Environment block, the wind speed & grade are changed to 20 m/s and 30 respectively.
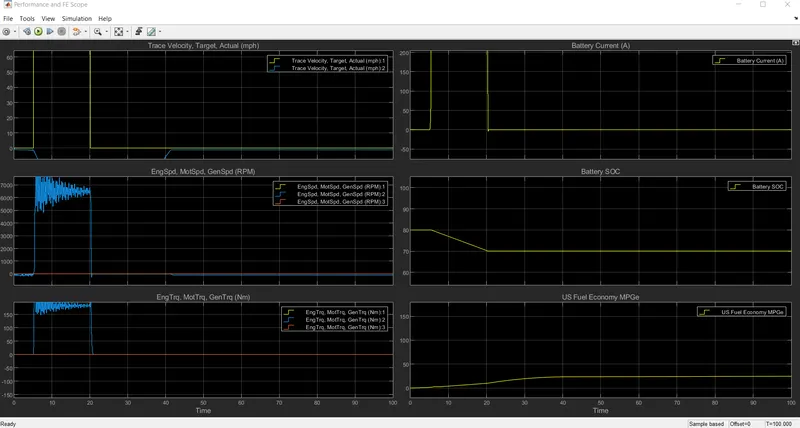
Output: Performance and Emissions graphs of HEV
Observations:
When the vehicle is accelerated, the Motor speed and Torque fluctuate.
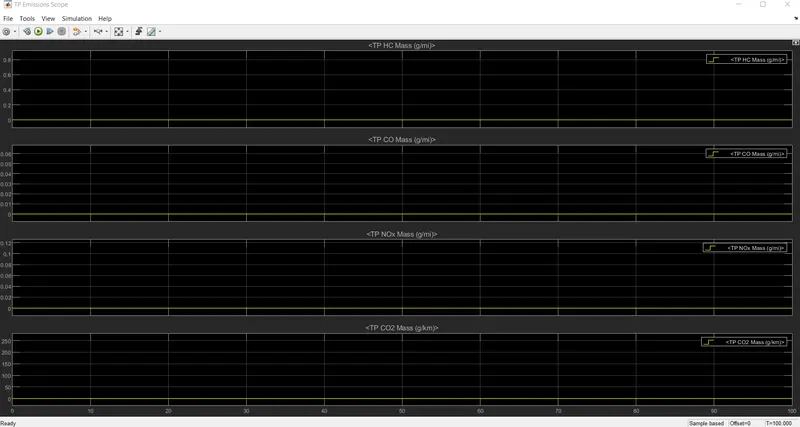
Since it is an HEV, there are no emissions produced.
The Fuel Economy MPG increases slightly after 20 seconds.
Solution 4:
All the input parameters are kept the same for HEV and EV models:
Drive Cycle: - Wide Open Throttle (WOT)
Simulation Time: - 100 seconds
Grade: 30
Wind Velocity: 20 m/s
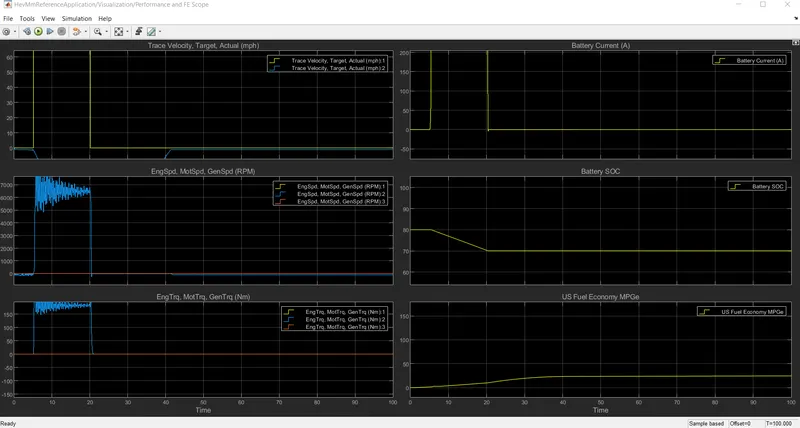
Output: Individual and Combined outputs of HEV and EV models.
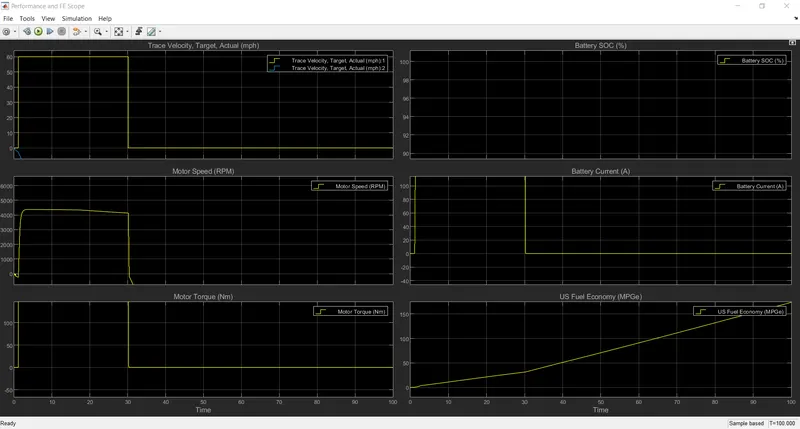
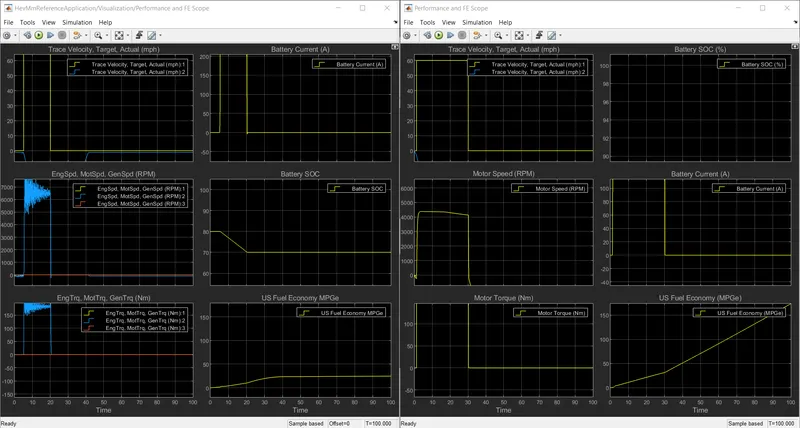
Observations:
- The top speed achieved by hybrid vehicles is more than that of pure EV.
- The battery current capacity of pure EV is much higher compared to that of HEV since in EV the battery is the only driving unit.
- Higher fuel economy is achieved in the case of pure EV.
Conclusion:
The WOT Condition Part - 2 challenge was successfully studied and simulated.
References: HEV command, EV command