Week-4 Challenge WOT Condition Part-2
- AIM: To Solve the following questions:
- Objective:
- What is the difference between mapped and dynamic model of engine, motor and generator? How can you change model type?
- How does the model calculate miles per gallon? Which factors are considered to model fuel flow?
- Run the HEV ReferenceApplication with WOT drive cycle. Change the grade and wind velocity in the environment block. Comment on the results.
- Keeping all other parameters same, compare the simulated results of hybrid and pure electric powertrains.
- Case 1
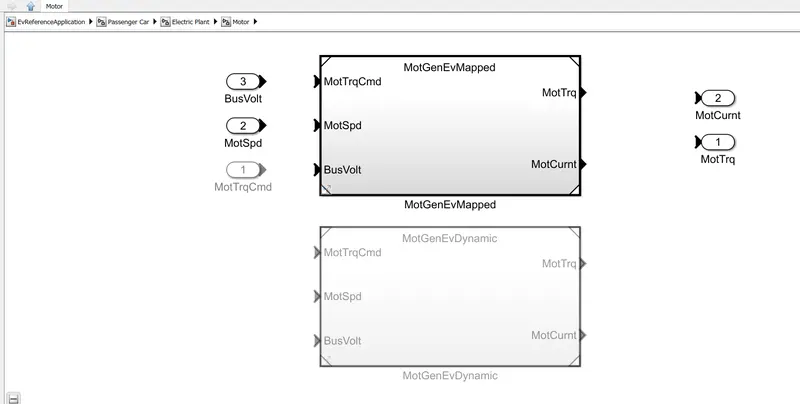
Difference between mapped and dynamic model of engine, motor and generator:
Mapped model: This model for the engine, motor and generator represents with a set of the look up tables such as motor speed, power, torque, current, voltage, fuel flow air mass flow, efficiency ,emmisions, battery current and temperature. Here values specified having real time block. These models are suitable for analysis and design activities. Also we can map the available data i.e.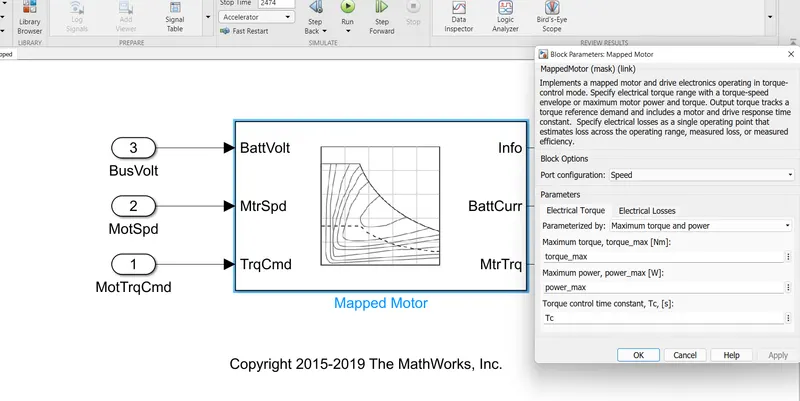
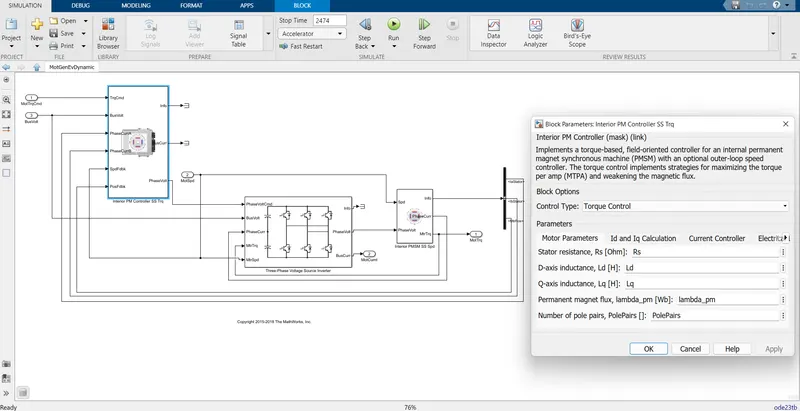
Dynamic Model: This model for the engine, motor and generator represents the real components which is suitable for designing control, estimator and diagnostic algorithm that depends on dynamic subsytems states. Power electronics simulations are mostly performed dynamically here used as to perform subsystem transient simulations shown in the image below where PM controller and three Phase voltage source inverter is used:
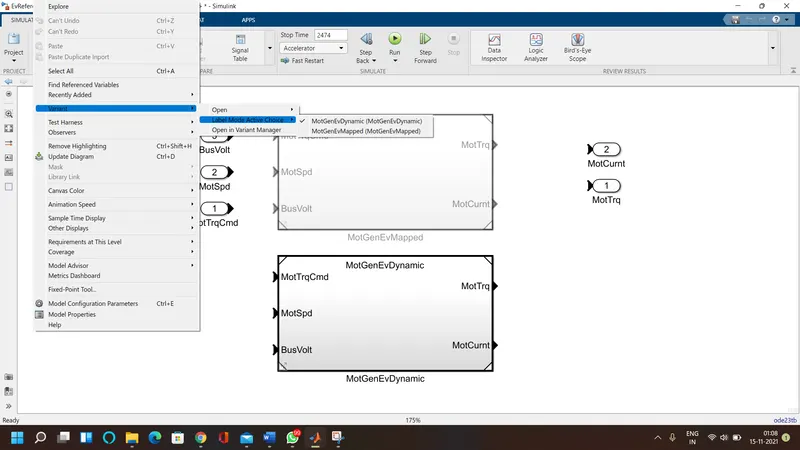
- To change a model:
We go through the following steps:
- First of all we will open the EV model an open the Passanger car model,
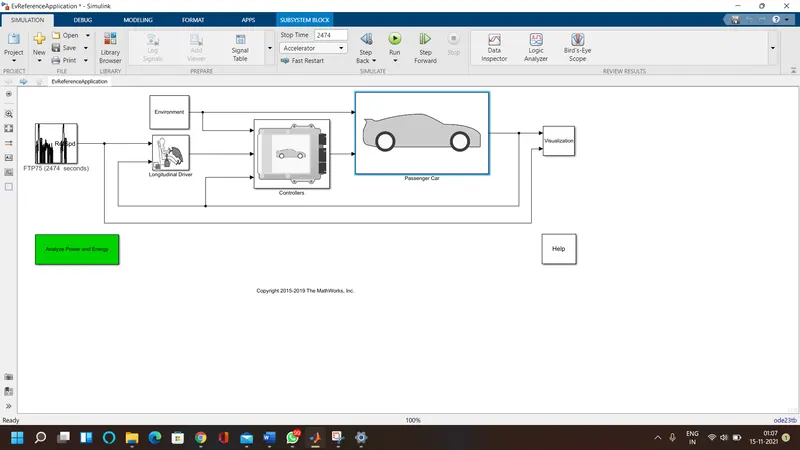
2. now we will open the subsyem for Electric plant,
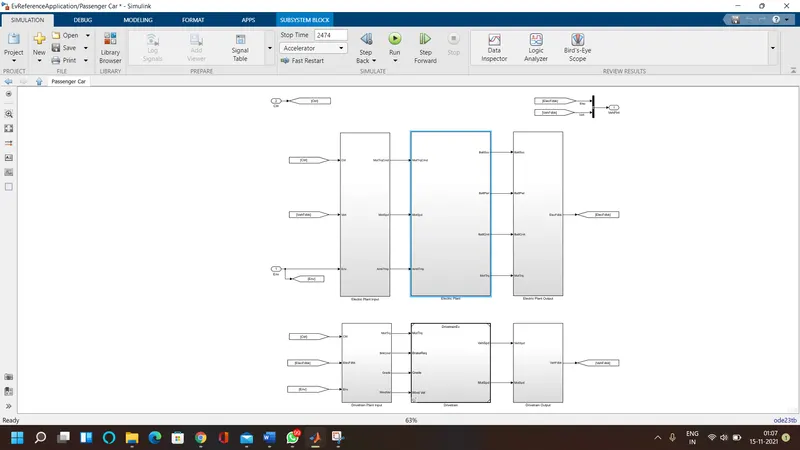
3.
Now we will open the motor model,
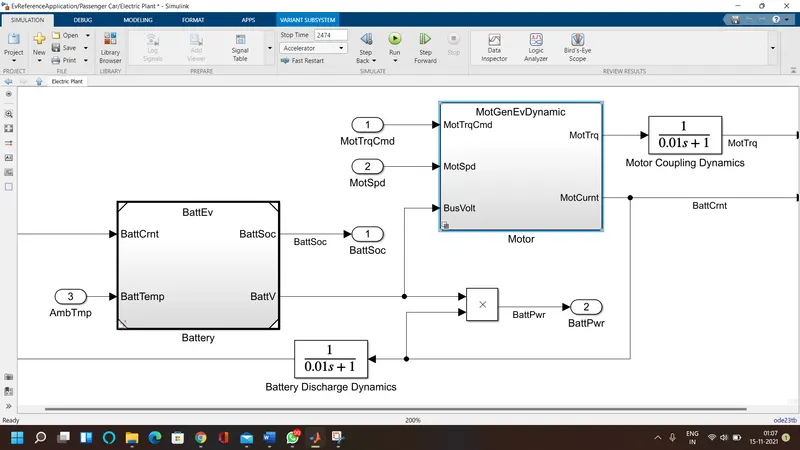
4. opening the motor sub model we can go to the variant by clicking right over the empty screen and change the lable made Active choice.
- Case 2: To calculate miles per gallon and also factors considered to model fuel flow: The Powertrain Block set has a model that calculates the miles per gallon for all the kinds of the vehicle, To obtain the results for the vehicle distance travelled as per the fuel or the battery power source, also which is more economical and how much comparing the vehicle engine fuel consumption and the power delivering Battery. As miles per gallon is equivalent to energy generated by the electric power.
Hence here we are converting the battery power to gallon and vehicle speed in miles using the steps shown in the image using Simulink blocks:
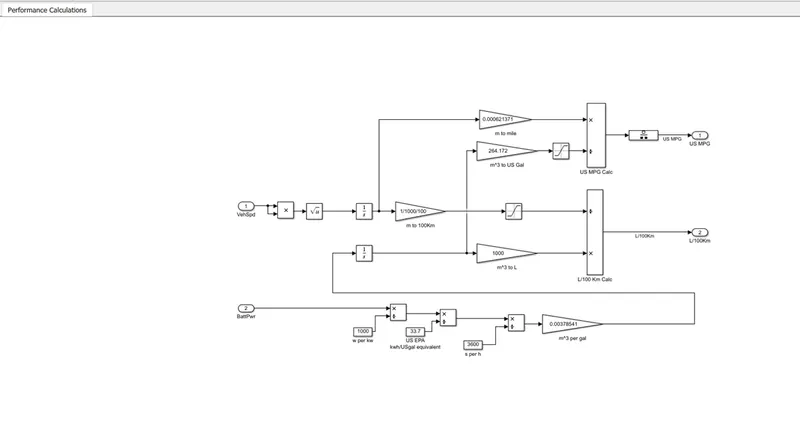
Above image shows Using the inputs as Vehicle speed, and the Battery power to calculate the calculations ;
- Vehicle speed :
Here to convert speed to distance we are integrating it with respect to time , and further
the results we get amount of consumption of fuel to run a vehicle 100 km.
- Battery power:
Similarly the amount of energy from battery power given in watt is converted to Kw and then by multiplying by time to KWh, for conversion in US gallon of automotive gasoline by dividing through 33.7, dividing by 3600 to convert hour to seconds , further multiplying by 0.00378541 m^3 per gallon is again integrated with respect to time multiplied by 1000 we get that in litres.
- Calculating miles per gallon:
Taking inputs from vehicle speed (distance) we found in metres is used by multiplying by 0.000621371 converted to miles,
Also now inputs from Battery power is converted to Us gallons by multiplying with 264.172 hence both the inputs are further divided and results obtained as Miles per Gallon.
- Hence both the Battery Power and the Vehicle Speed is considered to Model the Fuel Flow.
- Case 3
Run the HEV Reference Application with WOT drive cycle
We will select the specified model and than run the model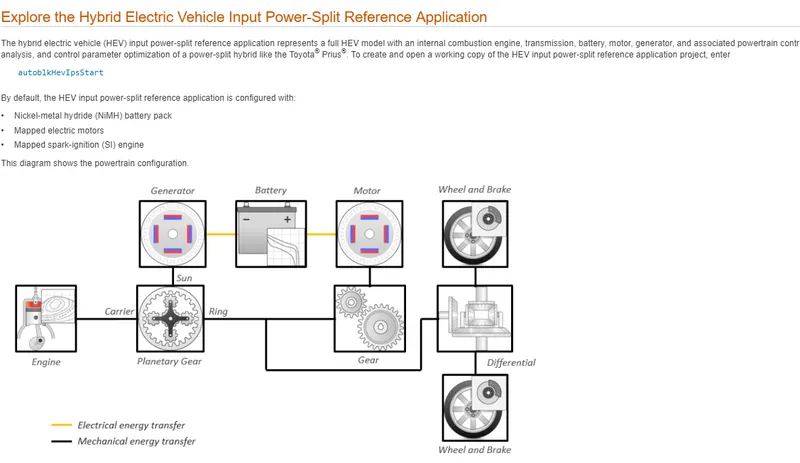
After opening the model we are going to change the drive cycle to WOT
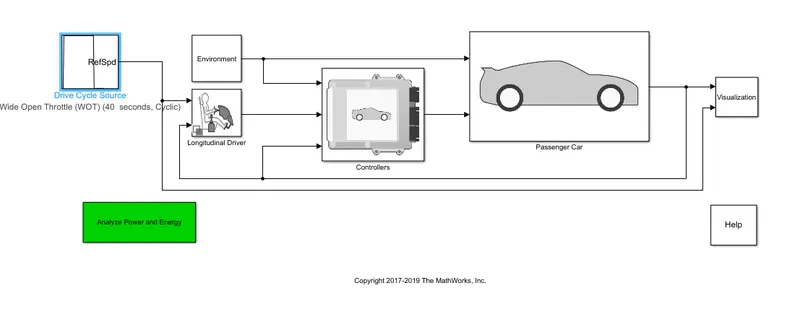
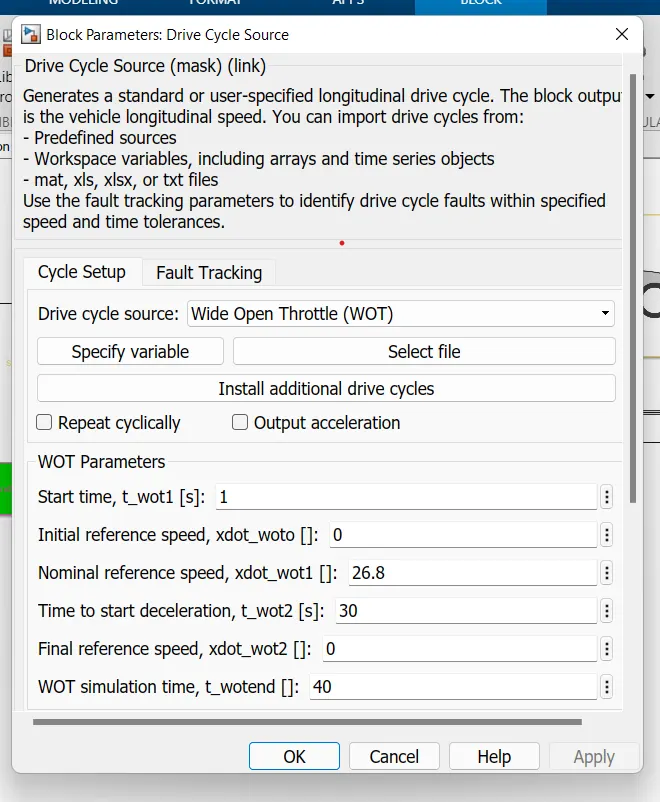
And will run the model for 40 seconds and all other parameters are same as given,
Results : obtained on viewing Scope
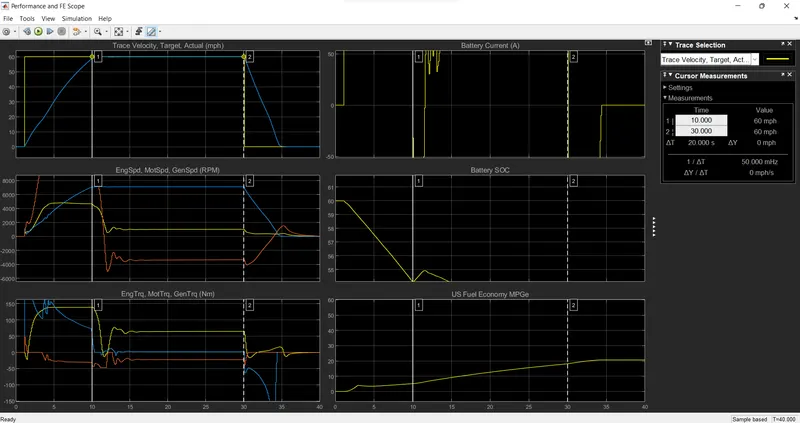
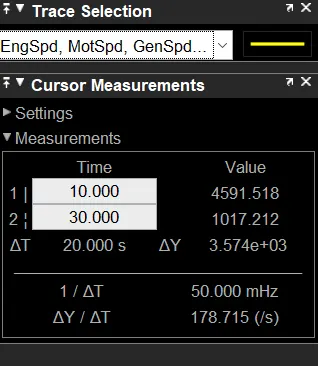
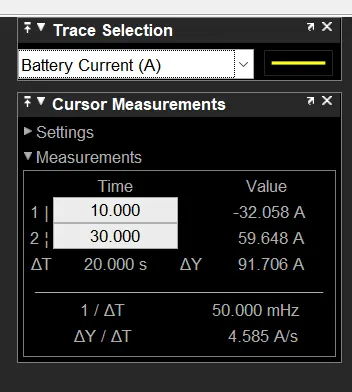
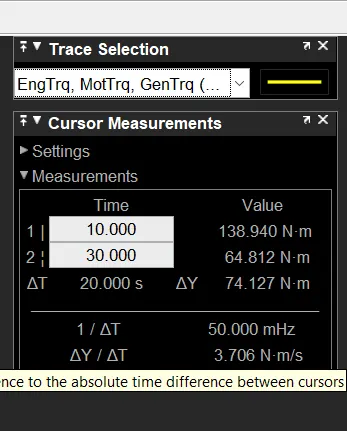
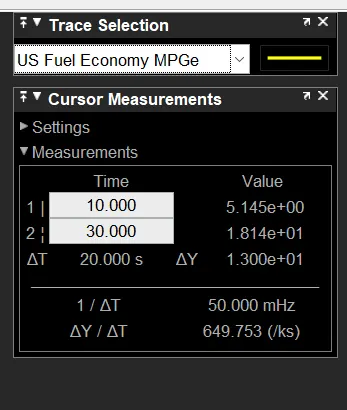
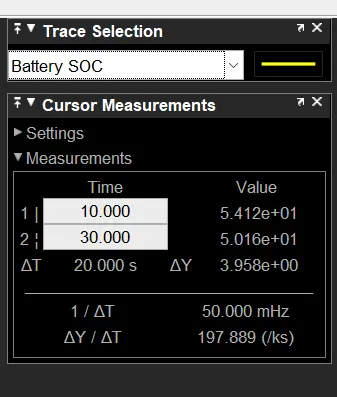
Now on changing the grade and wind velocity in the environment block;
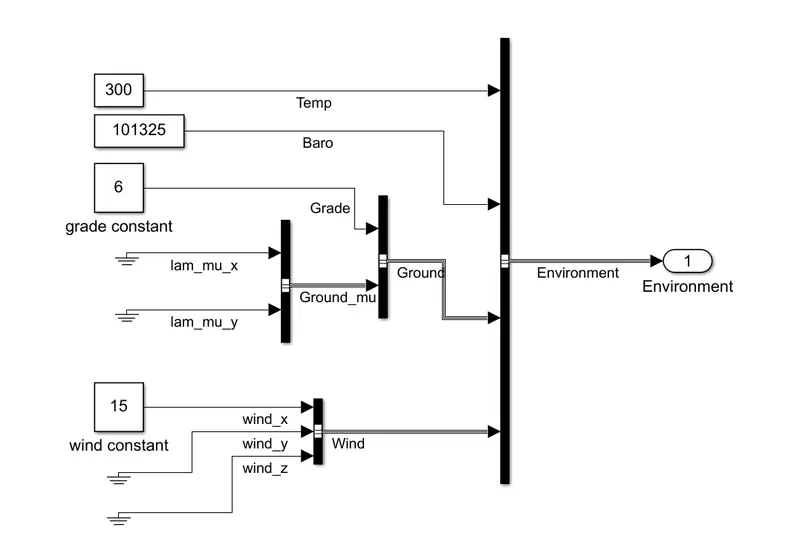
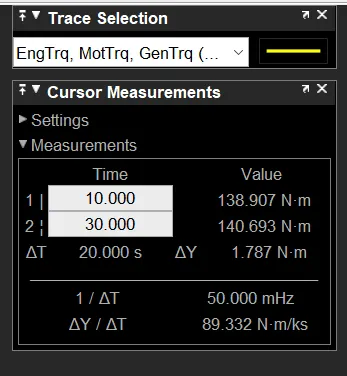
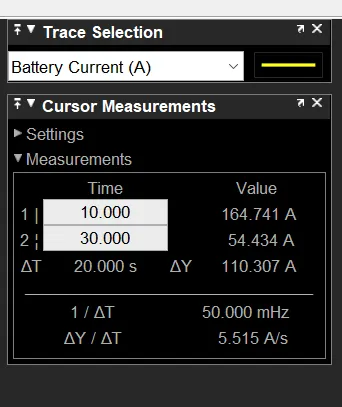
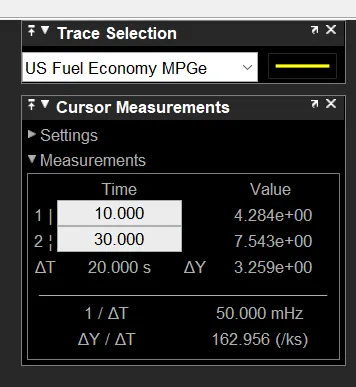
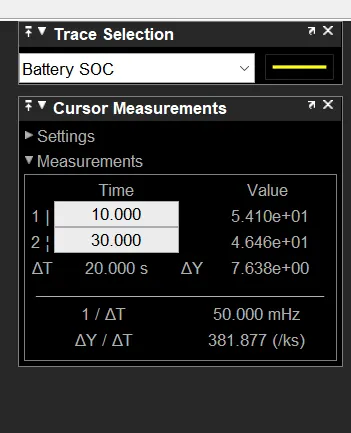
here we have changed the gradeability input to 6 and the wind constant to 15,
We get results as ;
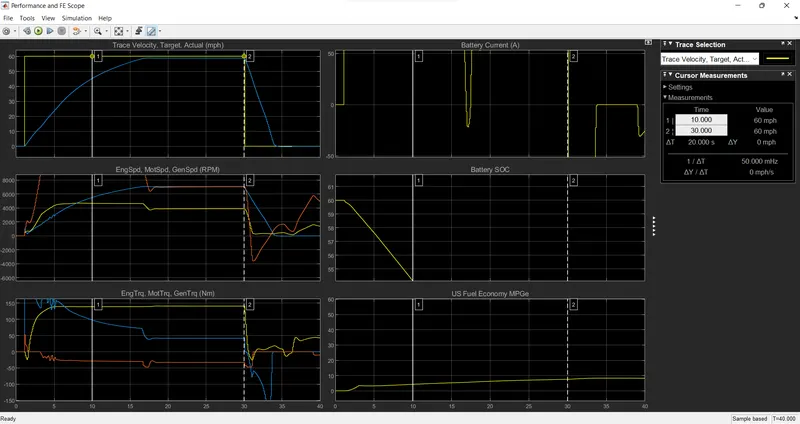
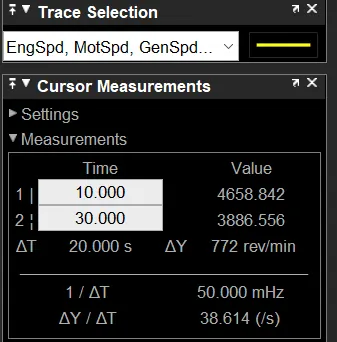
- Observations :
On changing the values of gradeability and wind constant we get that,
- The Visible traces on both the tests it is observed a difference between the actual trace velocity curve and the input changed value traces due to lack of power available from the energy power source.
- The attained maximum speed is low comparatively to the actual model.
- There is a decrease in the Battery Soc and the battery current an the fuel economy due to the requirement of more power due to the resistive characteristics such as high wind and more gradeability.
- Case 4:
Keeping all other parameters same, compare the simulated results of hybrid and pure electric powertrains.
Hence as per question we have to compare the two models of the Hybrid and pure electric model
Also we are comparing the results for both on the WOT Drive cycle:
Model 1 Pure electric vehicle model: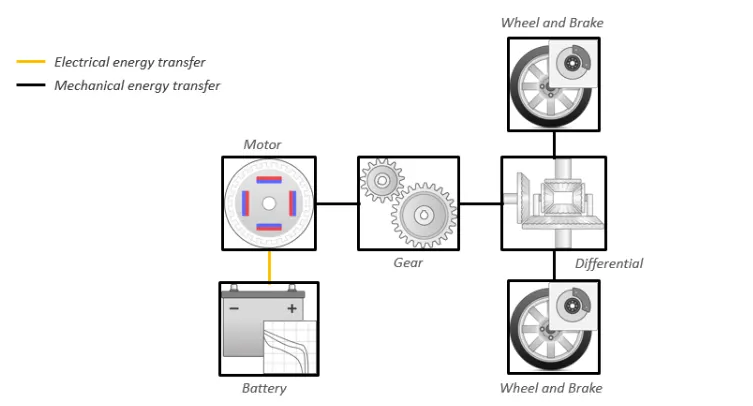
Simulink model for the Pure Electric Vehicle
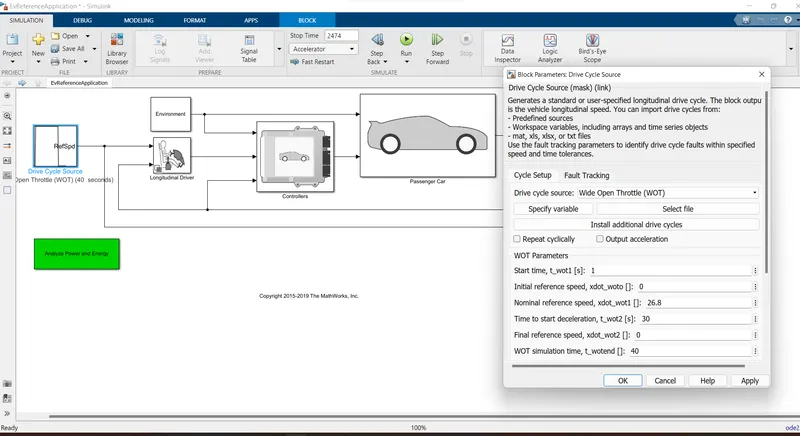
Result obtained on visualation: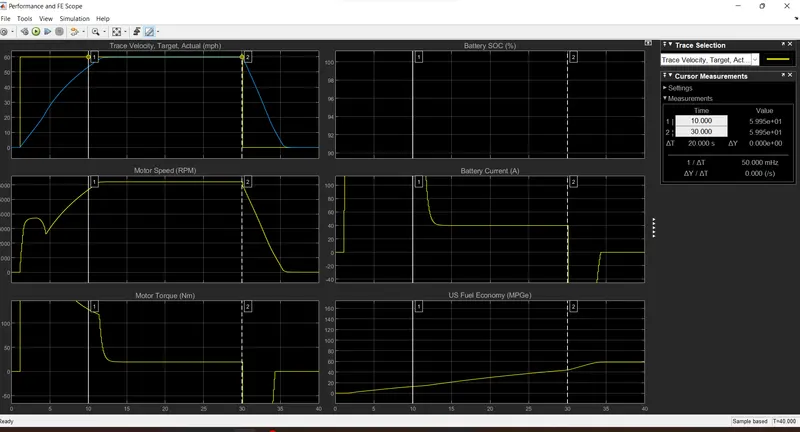
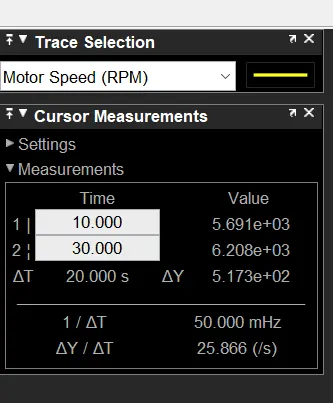
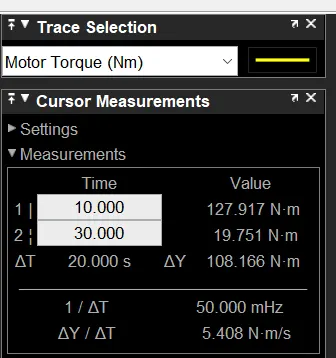
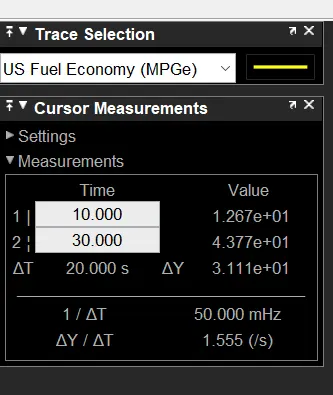
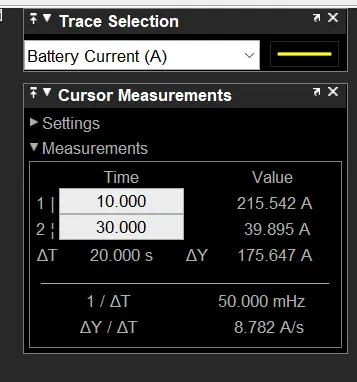
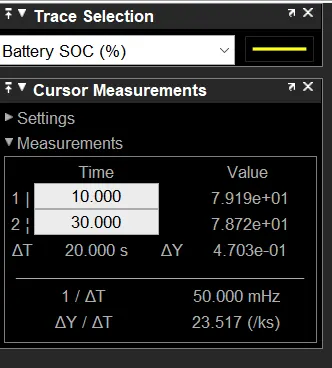
Model for the Hybrid Electric Vehicle and the results can be viewed from the case no 3
As the outputs and the model for the actual model is same ,
Hence we can now compare the Results for both the model
- Observations:
- Comparing the top speeds for the both the model HEV goes with a plus point.
- As in Hev we have both the Ic Engnine with an addition of a battery source as energy to run the vehicle it is trustworthy with more range compared to the Pure electric vehicle.
- The pure electric vehicle uses Lithium ion cells battery which has comparatively more power energy than the HEV’ s Lead Acid Battery.
- EV shows more fuel comparatively with the battery running time than in the HEV.
- CONCLUSION:
Here we have solved three cases as per given in the Question;
- We have compared difference between the Mapped and The Dynamic Model stated in the US Miles per gallon fuel calculations.
- Also we have performed silution on the Pure EV and Hybrid Ev.
- Comparing the performances of the vehicle model by changing the Parameters such as Gradeability and the environmental change as Wind disturbance.