Week - 4
- Aim: To solve the following questions:
- Question 1.: To implement control logic of a “washing machine” using State flow as per given sequence.
- Objects:
- If the power supply is available, the system gets activated.
- If the Water supply is not available, stop the process & indicate through LED.
- Soaking time should be 200s followed by Washing time of 100s.
- Then rinsing happens for next 20s & dryer runs for 50s
- After all the processes have completed turn on the finished LED.
- Processing steps:
For Washing the clothes :
- Soaking
- Washing
- Rinsing
- Drying
- Simulink Model:
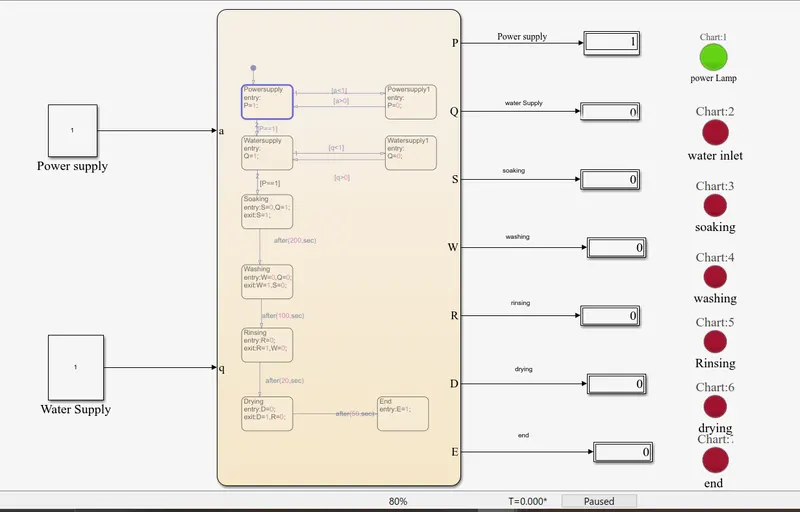
- Simulink Blocks Used:
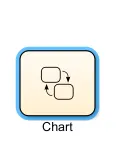
- Charts- This block demonstrates State flow chart is a graphical representation of a finite state machine consisting of states, transitions, and data. You can create a Stateflow chart to define how a MATLAB algorithm or a Simulink model reacts to external input signals, events, and time-based conditions. For more information, see Model Finite State Machines.
- Constant - This block used as a constant signal input with real or a complex value . The block generates scalar , vector or matrix output .
- Display - This block shows the value of the data.
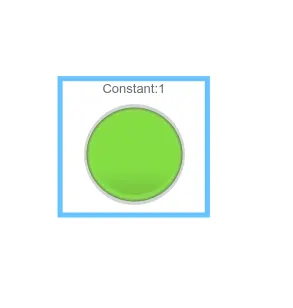
- Lamp – This block is used as a components that indicate state using color. Properties control the appearance and behaviour of a lamp. Use dot notation to refer to a specific object and property.
- Logics Implemented:
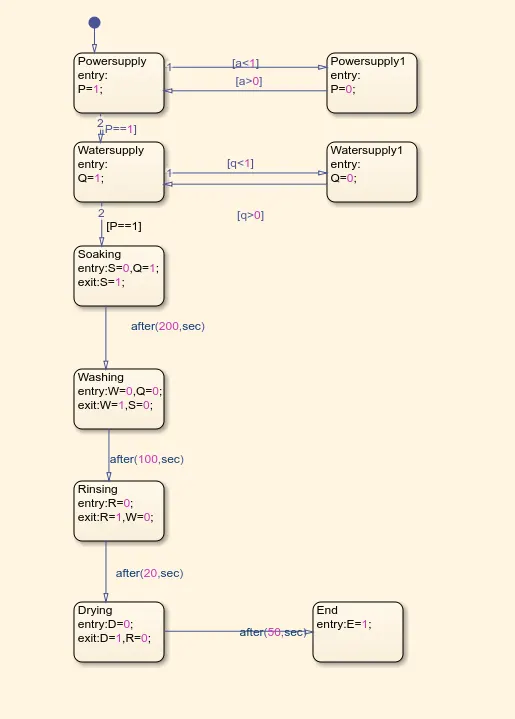
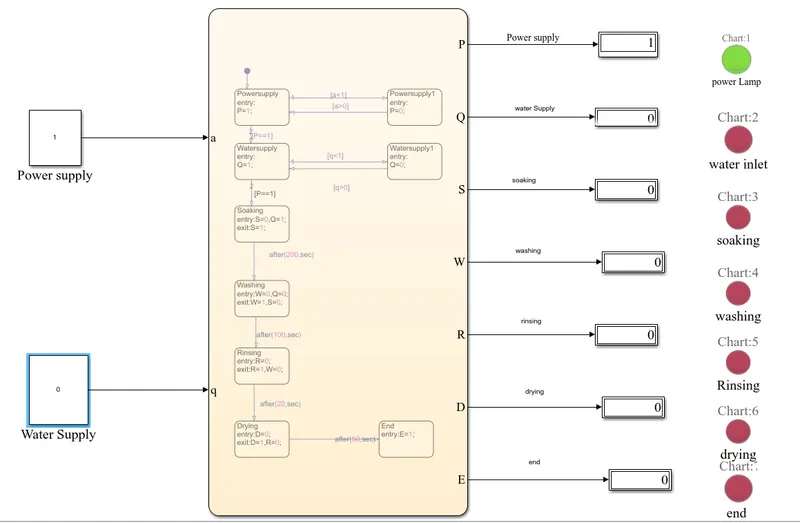
Above image shows the state flow chart, in which logics are implemented for the working of a washing machine.
- Given input conditions are two input ports:
- Power Supply input P=1 shows the supply is on lamp is green and P=0 shows no power and the lamp is red.
- Water Supply input Q=1 shows the supply is on lamp is green and Q=0 shows no power and the lamp is red.
- Soaking Process- Clothes are soaked under water for 200seconds. Supply of water is stopped here and the lamp denoting soaking turns green until the tiume of soaking.
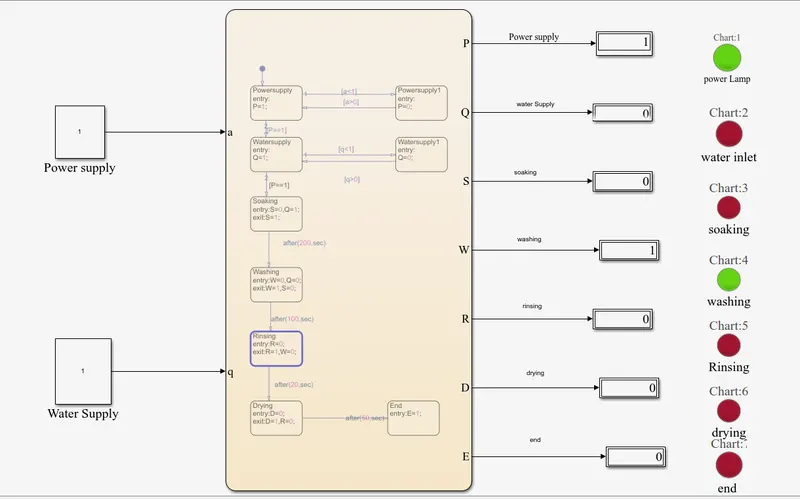
- Washing- Clothes washing process takes place for 100 seconds and lamp turns green for washing and soaking lamp turns red.
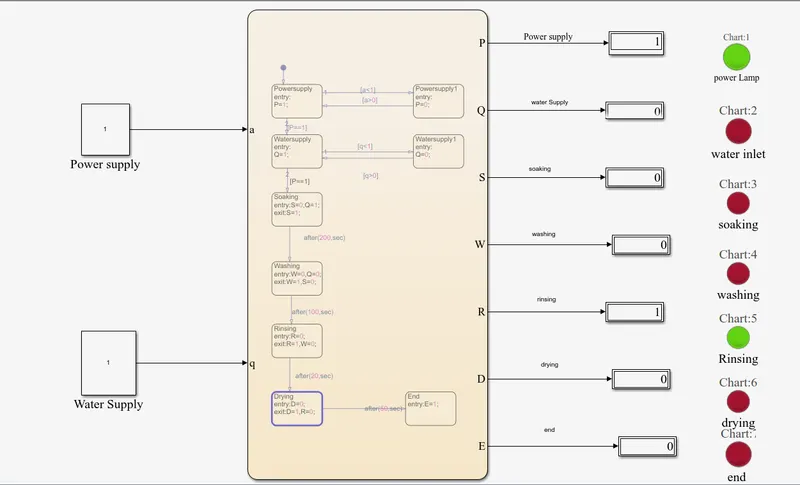
- Rinsing – Water gets rinsed out from the machine for 20 seconds and lamp turns green indicates rinsing process uner going.
- Drying – Clothes get dried buy spinning for 50 seconds and lamp turns red for Rinsing and for drying it turns green
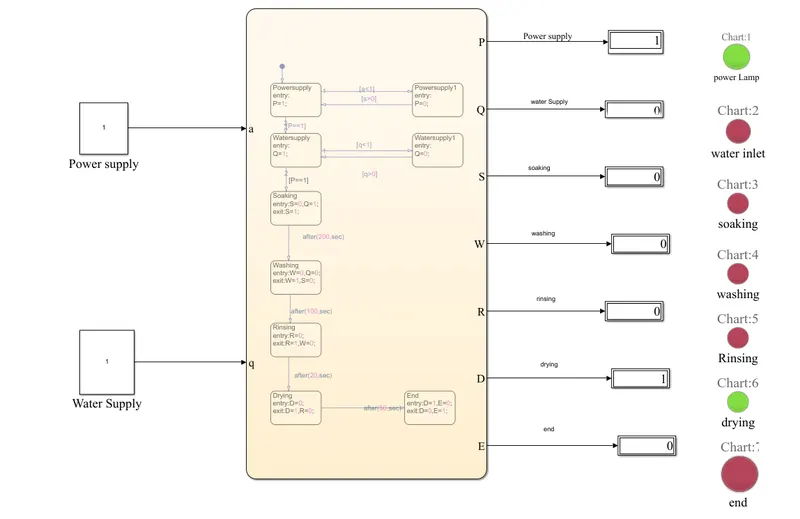
- End - The process of washing gets end, showing green lamp for end finishing Process power lamp and End lamp is green, Rest all the lamps are in the red glowing state.
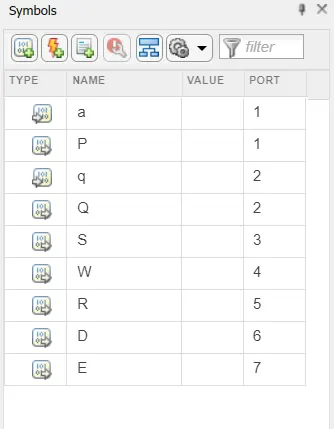
- Symbols used in the chart:
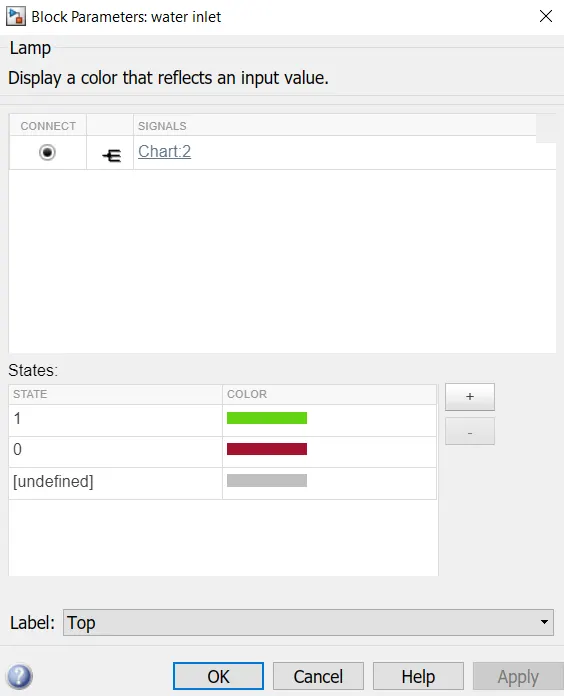
- Lamp properties:
Green lamp shows the signal 1 as input which means the supply is on or in the working condition.
- Results:
- If the power supply is available, the system gets activated:
Above image shows the power supply for the model is on as given input is 1.The green lamp denotes that the system is activated.
2. If the Water supply is not available, stop the process & indicate through LED.
 Above image shows the Supply of water is not available and the lamp glows red for water supply.
3.Soaking time should be 200s followed by Washing time of 100s.
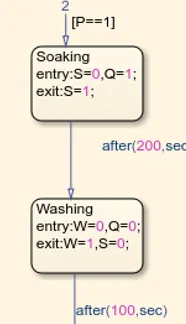
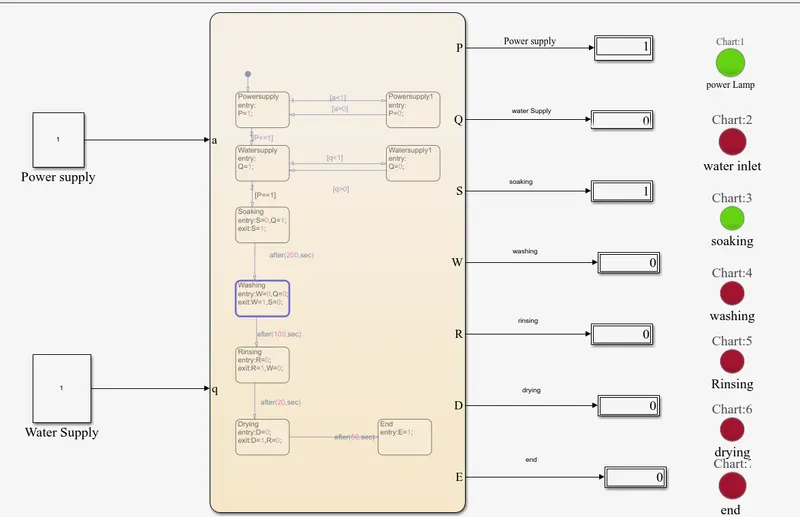
soaking time for clothes 200 seconds. followed by washing in next image for washing 100 seconds.
4. Then rinsing happens for next 20s & dryer runs for 50s
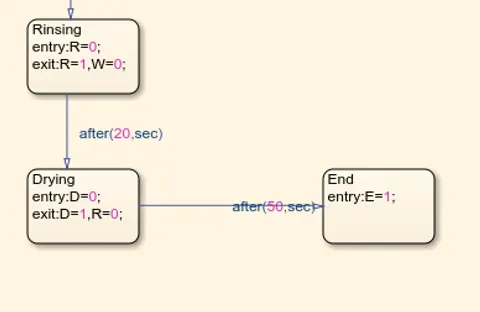
Above chart shows the timing for the following operations
Bellow the image show the operations taking place.
5.After all the processes have completed turn on the finished LED.
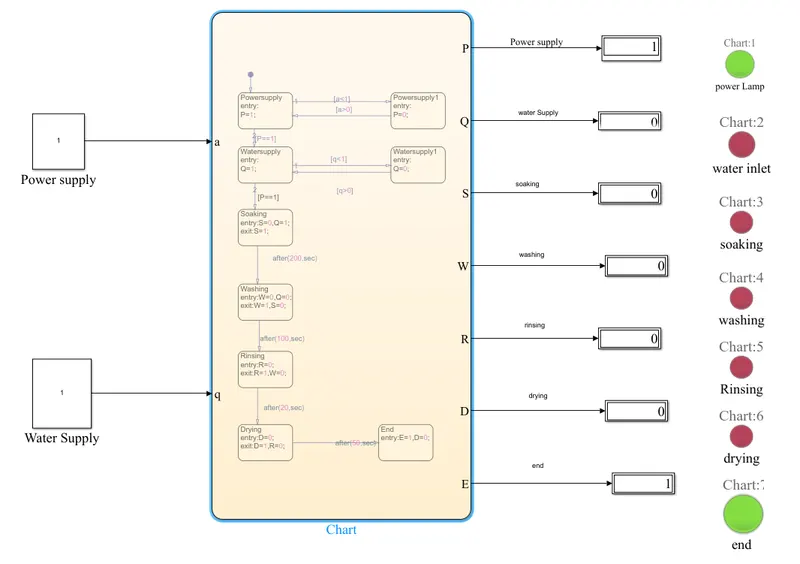
After all the washing processes our task completes and at last the last lamp glows green.
- Question 2:Make a Simulink chart for the “Gear shift” logic as per below conditions:
- Objects: Speed Range (kmph)
Gear 0 to 15 1
16 to 25 2
26 to 40 3
41 to 60 4
Above 61 5
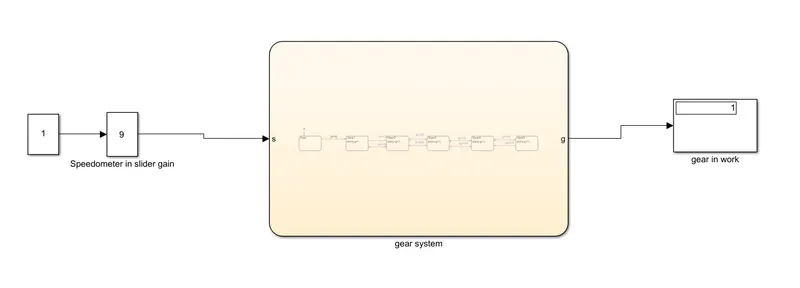
Give speed input while the simulation is running & display the gear number.
- Simulink Model:
- Simulink Blocks Used:
- Charts- This block demonstrates State flow chart is a graphical representation of a finite state machine consisting of states, transitions, and data. You can create a Stateflow chart to define how a MATLAB algorithm or a Simulink model reacts to external input signals, events, and time-based conditions. For more information, see Model Finite State Machines.
- Constant - This block used as a constant signal input with real or a complex value . The block generates scalar , vector or matrix output .
- Display - This block shows the value of the data.
- Slider gain- This block is used as to vary a scalar gain during a simulation using a slider. The block accepts one input and generates one output. Data type support for the Slider Gain block is the same as that for the Gain block .
- Logics Implemented:
- Slider gain: Here we are providing the input data to run the simulink model.
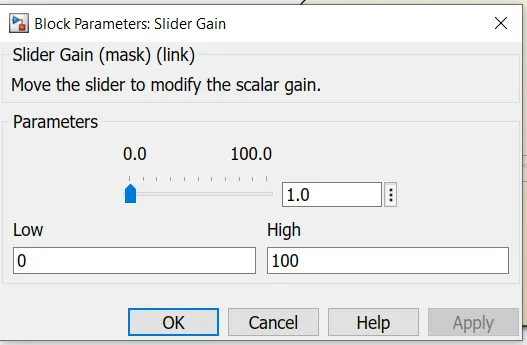
Above Slide gainer used as a Speed generator,
Slider is used to modify the values of speed as a scalar chain,
Parameters showing speed from 0 to 100.
2. State Flow Chart:
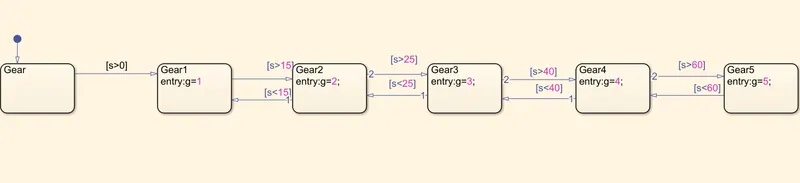
Above chart is implemented for the shifting of gears in the simulinkl model.
The logic created such that when the vehicle runs at different speeds it is required to shift the gear and the gear shifting is pattern as follows:
Speed Range (kmph)
Gear 0 to 15 1
16 to 25 2
26 to 40 3
41 to 60 4
Above 61 5
Also we are using Display Simulink block here for the output result,
Running the vehicle at different speed the gear in action is seen in the display.
- Results:
- Gear 0 to 15 kmph is 1:
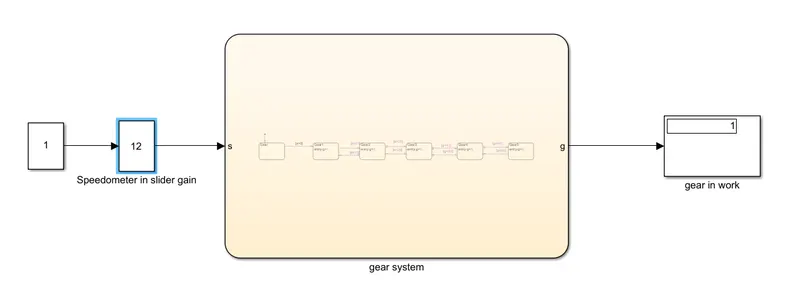
Observations from the above image shows the input speed as 12 kmph and display shows the Gear 1 in use.
2. Gear 16 to 25 kmph is 2: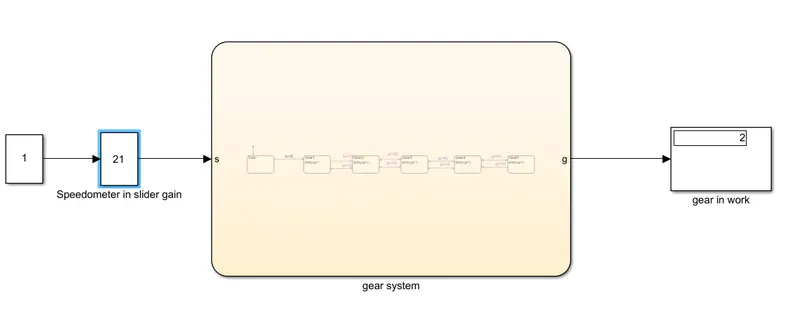
Observations from the above image shows the input speed as 21 kmph and display shows the Gear 2 in use.
3.Gear 26 to 40 kmph is 3: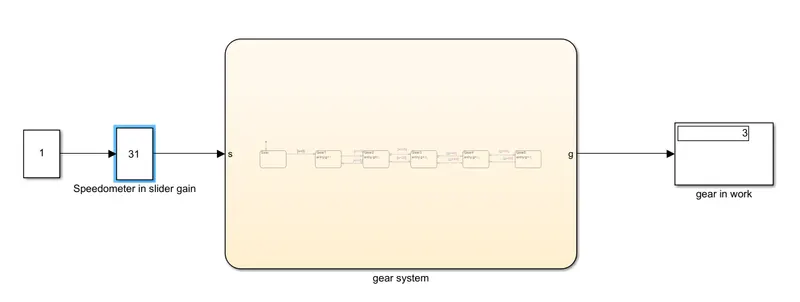
Observations from the above image shows the input speed as 31 kmph and display shows the Gear 3 in use.
4. Gear 41 to 60 kmph is 4:
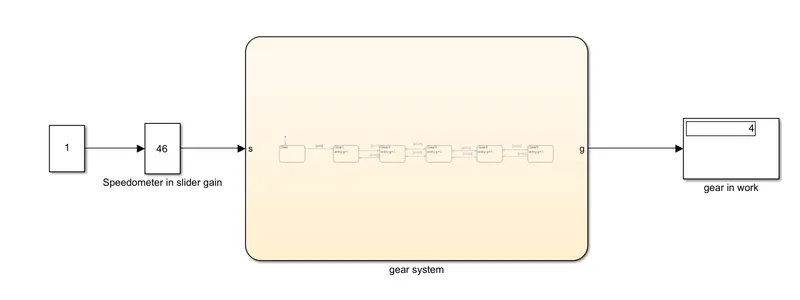
5.Gear Above 61 kmph is 5:
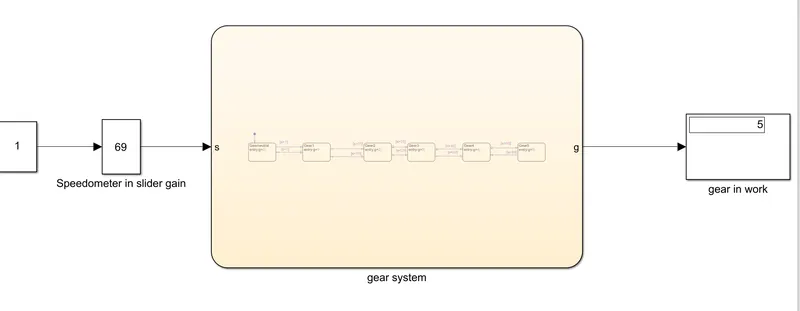
Observations from the above image shows the input speed as 69 kmph and display shows the Gear 5 in use.
- Conclusion:
Solving the above Questions 1 and 2 we have successfully simulated the objects and obtained the results , we have understand the concept of a automatic washing machine used as a our daily need. Also the working principle of changing an shifting of gears in the automobile.