Week-4 Challenge WOT Condition Part-2
Aim : What is the difference between mapped and dynamic model of engine, motor and generator? How can you change model type?
1) The powertrain Blockset provides the type of Model for simulation of the Vehicle
- Mapped Model
- Dynamic Model
Mapped Model :
-The maped model used for the vehicle simulation in the powertrain blockset uses the 2-D look up table with Set of Steady state which includes the characteristics of the Engine and motor performances
-These 2d look up table provides the engine characteristics details such as Actual torgue , Fuel flow rate , engine exhaust emmision and etc
Dynamic Model :
Dynamic model simulate the model based on the inupt recived from the actual componont such as , motor, generator , accessories
Following point illustrates the difference between the Mapped Model and the Dyanamic Model
| Mapped Static Model | Dynamic Model | |
| 1 | Runs the simulation based on the data present in the 2d look up table | Runs the simulation based on the actual compononent such as Motor, Generator, etc |
| 2 | Runs fast compared with Dynamic Model | It takes more time to simulate as it involved proceesing of the data from the diffeent componont level |
| 3 | It is carried out when we have the data from Dynamometer | It is carried out when we need more detail compnont level result of the simulation |
| 4 | It is used for the engine -quasi -steady-state engine simulation | It is sued to analyse/study the performance of the model with respect to each componont |
# How to change the Model type
- To switch between the Mapped and Dynamic Model
1) Open the powertrain modul blockset for the required vehicle
2) Click on the passanger/car vehicle block and select the "Electric Plant " or "Engine"
3) Right Click on the Engine/EV Motor/Generator based on vehcile model and select variant
4) Under Variant Scroll down to Lable model active choice and select the "Mapped " or "Dynamic "
#Study 2 : How does the model calculate miles per gallon? Which factors are considered to model fuel flow?
-The Miles Per Gallon (MPG) , is used to show the Fuel Economy of the Vehicle
-The MPG shows the How much distance Vehicle can travel , for the aount of one Gallon of Gasoline used
-It is widely used in USA to understand the Fuel econmoy of the all types of Vehicle EV, PHEV, HEV etc
The powertain Blockest has an inbuilt block to calculate the MPG whcih is present inside the "Visualozation block "
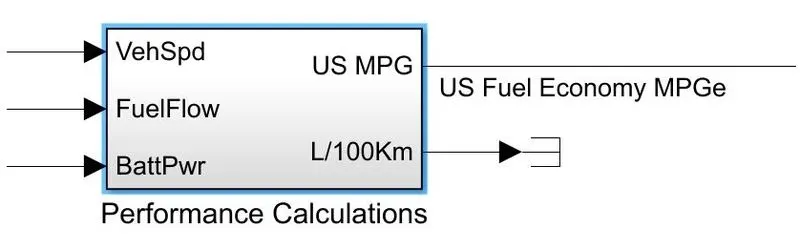
As shown in above block to calculate/messure the MPG for the particular input different inputs are taklen into the account -
- Vehicle Speed = VehSpd
-Fuel Flow = Fuel flow used for the vehicle
-BattPwr = Batter power
Followign block shows the Details schematic of the Above block , whcih shows the Different block used for the Calculation of the MPG
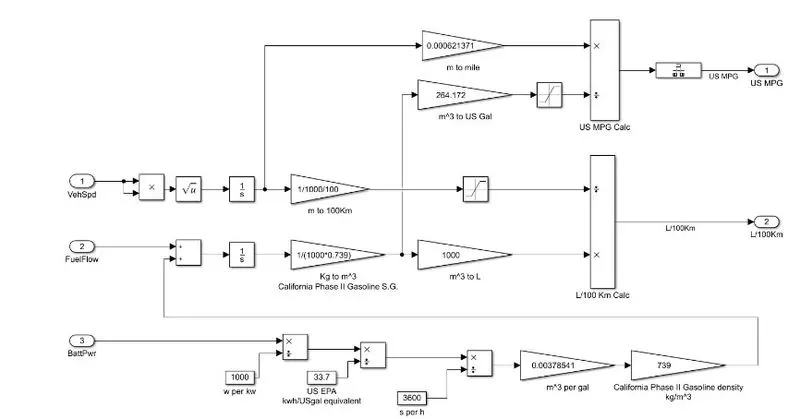
As shown above , it use the Input as Veh speed , Fuel flow, and The BattPwr
As shown above
- the Battery Power is converted in to KW by using the required block above (W/1000)
- The KW value obtained is furthewr divided by the 33.7 to get the one gallon of the gas equivalant to the 33.77KWH of Electricity
-The obtained fuel equivalant of the battery is added to the Fule flow further
- Using Vehcle Speed and Time , the distance of travel is calculated , the obtained distance is then converted in to the Miles as shown above
- The one input from the Fule flow is taken to the" m^3 to US Gal" block , which is further given to the US MPG Calculation block to calculate the MPG value
#Study 3 :
Run the HEV ReferenceApplication with WOT drive cycle. Change the grade and wind velocity in the environment block. Comment on the results.
- Following is the HEV ReferenceApllication BLOCK SCHEMATIC
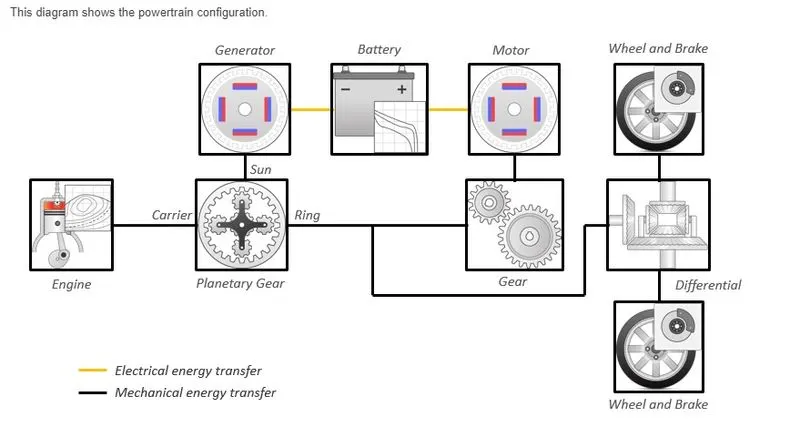
- HEV Refrence model with WOT drive cycle as inuput
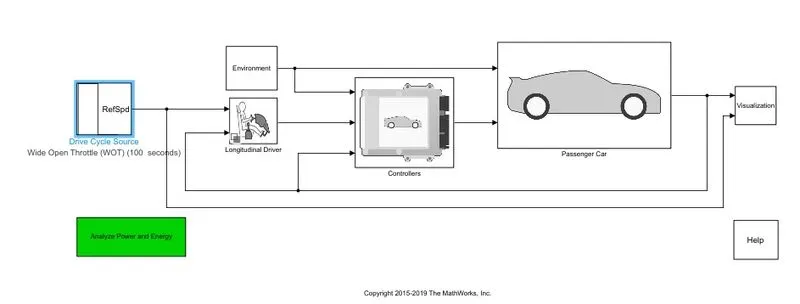
- The following inputs are given to the WOT Drive cycle with , START Time = 1 sec, Nominal Speed = 50 m/s, Deacceleration speed = 50 m/s, WOT Simulation time =100 sec
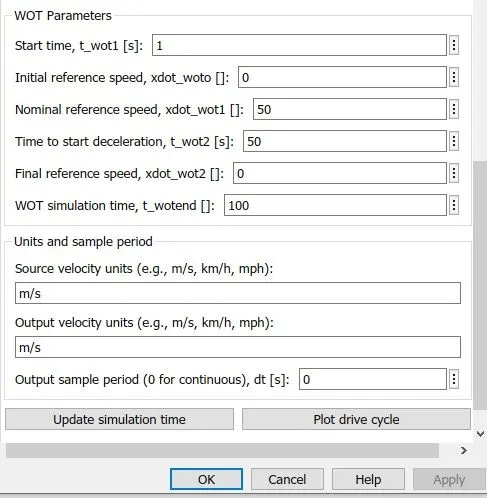
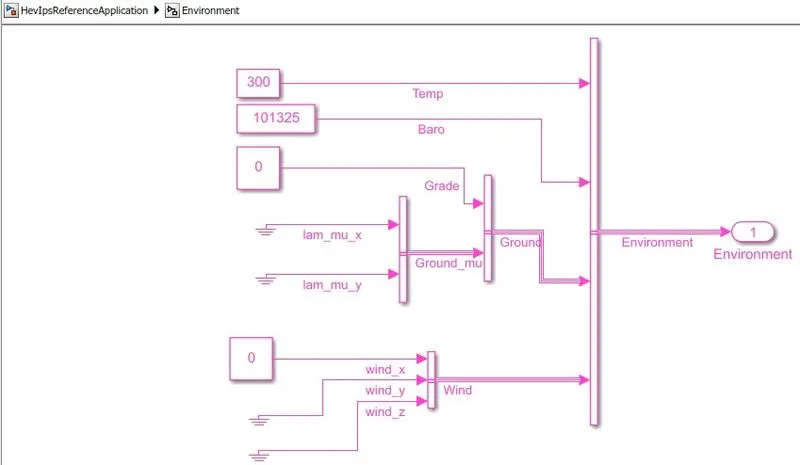
-With above parameter constant , The Enviorment parameter WOT and Grade velocity are changed as follows
Case -1 : Grade =0 , Wind velocity =0
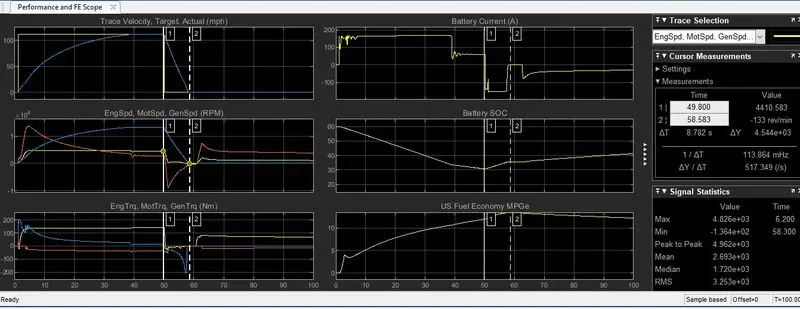
- For the Above Input of the Grade and Wind Velocity we get the Following ouput scope result for the HEV model
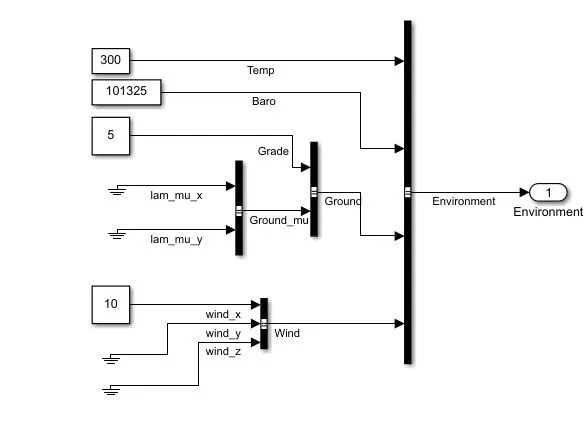
Case 2: Grade = 5 , Wind Velocity = 10
-Output for the Above Grade and WInd velocity input (Grade =5 , Wind Velocity =10)
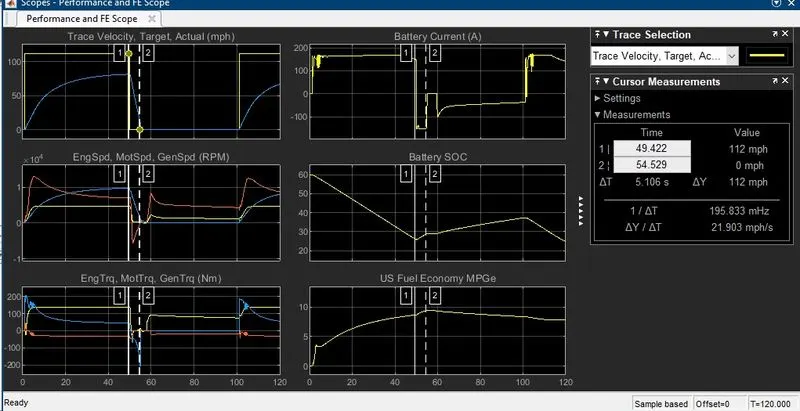
Following table shows the Comparison betwwen above two cases
| Sr No | Parameter | Case 1 | Case 2 |
| 1 | Grade | 0 | 5 |
| 2 | Wind Velocity (m/s) | 0 | 10 |
| 3 | Deaceleration Time(s) | 8.782s | 5.106s |
| 4 | Maximum Speed (Mph) | 111.3 | 81.18 |
| 4 | Max Battery Current Drawn (A) | 169.7 | 169.6 |
| 5 | Battery SOC (%) | 60% to 30.65% | 60% to 25.79% |
| 6 | Fuel Economy (MPG) | 13.37 | 9.368 |
| 7 | Maximum Engine Torque (Nm) | 140.4 | 139.4 |
| 8 | Peak Motor Torque(Nm) | 207 | 207 |
Observation :
- From above case we can conclude the following important points
1) For the Case -1 with Zero Grade Angle , the vehilce is driving without any grade on planer path , so it acheives the Maximumu speed of the 111.3 Mph as compared to the Case 2
2) Where as the Maximum speed gets decreased to the 81.18 Mphfor the Case 2 in which Grade and Wind Velocisty is intoduced
3) The Maximum current drawn remain almost simillar for both cases around 169 A
4) The Fuel ecomonmy also gets hampered for the Case -2 Due to the Grade and the Wind velocity applied to the vehicle
5) The Deacelaration gerts reduced for the Case -2 to the 5.106 s as compared to the Case-1 where it was observed to be substetially higher around 8.782 s
#Study 4: Keeping all other parameters same, compare the simulated results of hybrid and pure electric powertrains.
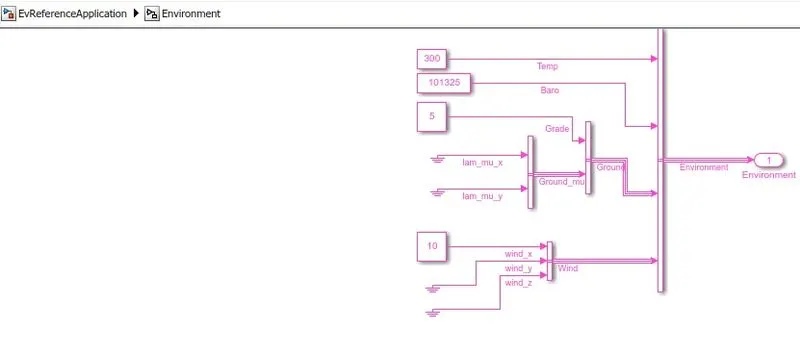
The following fig shows the enviroemt used for the EV vehicle( Grade =5 , Wind Velocity = 10)
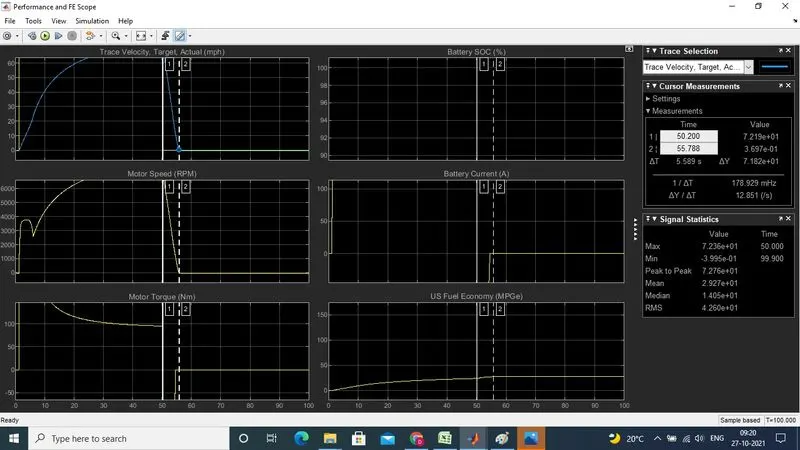
-Following is the Result of EV Powertrain with Grade =5 , Wind Velocity = 10
Conclusion
| Sr No | Parameter | Case 1 :HEV | Case 2:EV |
| 1 | Grade | 5 | 5 |
| 2 | Wind Velocity (m/s) | 10 | 10 |
| 3 | Deaceleration Time(s) | 5.106S | 5.588s |
| 4 | Max Battery Current Drawn (A) | 169.6 | 225 |
| 5 | Battery SOC (%) | 60% to 25.79% | 80% to 75% |
| 6 | Fuel Economy (MPG) | 9.368 | 27.23 |
| 7 | Maximum Engine Torque (Nm) | 139.4 | NA |
| 8 | Peak Motor Torgue(Nm) | 207 | 280 |
| 9 | Maximum Speed (s) | 81.8 Mph | 72.07 Mph |
Observation :
From above comparsion we can conclude following important point between HEV and EV
1) The EV is more fuel efficeint as compared to HEV which is evident from above table, for the same Grade and Wind Velocity EV is giving the 27.23MPG of Fuel Economy
2) The Battery SOC is also better in EV Vehicle as its has the minimum SOC of 75% as compared to the HEV which goes to the 25.79%
3) The Maximum current drawn in case of the EV is also high at 225A
4) The EV Vehcile produces the Peak Torque of 280 which is much higher as compared to the HEV with same condition
5) Overall the EV vehicle performace is Much better except the maximum speed achive which is little lower as comapred to the HEV