Week-3 Challenge: ADVISOR Tool
Aim :Use ADVISOR tool and simulate the following
1. For EV_defaults_in file, if cargo mass is 500 kg with all other default conditions, can the vehicle travel for 45 km with FTP drive cycle? Conclude your observations.
Ans :
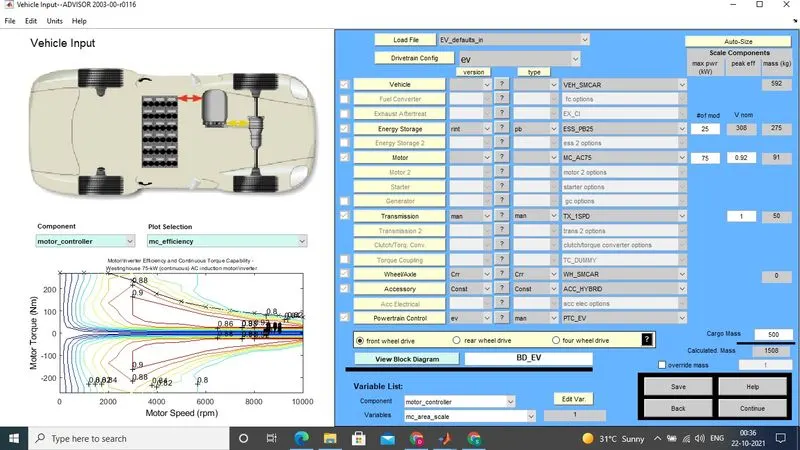
1.Following Fig shows the ADVISOR model of the for the EV_defailts_in file , with Cargo mass of 500 Kg.
2) In the above model following specfifications are used
- Energy Storage :Lead Acid Battery (Pb) is used , with 25 Module, 308 V -Vooltage
- Transmission ; Manual (MAN)
- Motor : AC induction motor with 75KW
- Drive : Front wheel Drive
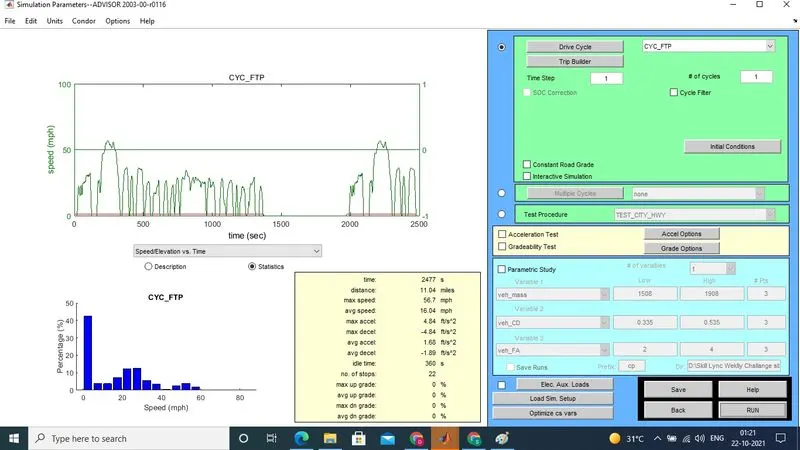
3) The single Drive Cycle of "CYC_FTP" is of "11.04" miles ,which is equal to 17.76Km long in distance
4) So to travel the vehicle over the Dsitance of 45 kM , we should aplly the 3 Driving cycle each of 11.04 Miles (17.76*3 = 53.28 km)
The following fig shows the above model with FTP Drive cycle selected as the "Drive cycle input " with
Case: 1- No of time Drive CYcle used =1
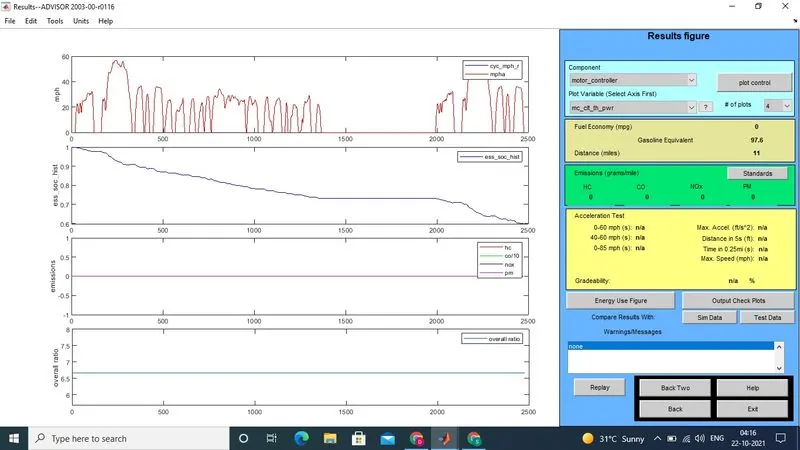
Result : for above One Drive Cycle .
6) Following fig shows the result for the 2 driving cycle
Case 2 : Result for "No of Times Drive cycle used =2 "
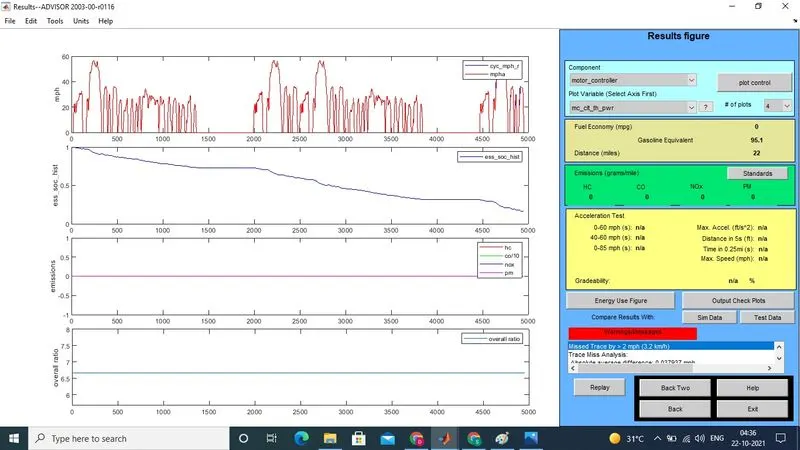
7) As shown in above Driving cycle , the total distacne travelled by the Vehicle = 22 miles ( 35.52 km) using 2 Driving cycles
8) Following is the Result for the "No of times the Driving cycle used= 3"
Case- 3: Driving cycle = 3
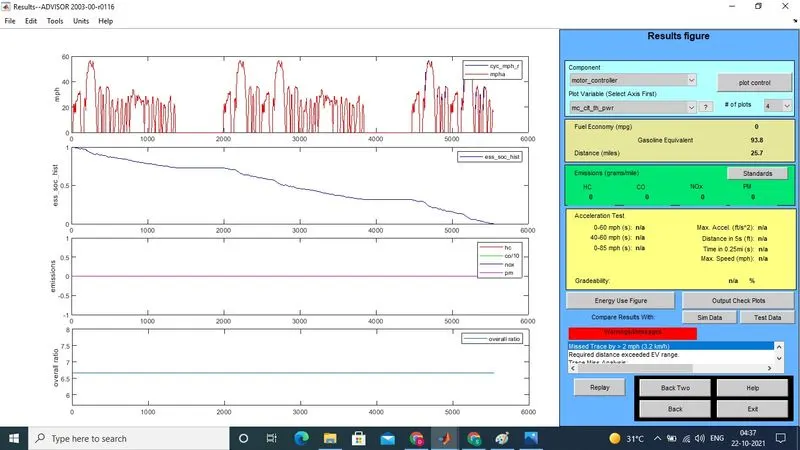
9) As shown above the distance travelled by the vehicle for the given driving cycle (3) is equals to 25.7 Miles ( 41.36Km)
10 ) So after apllying the 3 Driving Cycle ,which is of the total 33.09 Miles ( 53.14 kM ) the total distance travelled by the vehicle is equals to the 25.7 Miles (41.36 Km )
11) This happens as the the Battery used in the model gets completely discharged before 3 drives cycles gets completed, limiting the Vehicles maximum distance travelled to 25.7 Miles (41.36Km)
Conclusion
1) So as Battery itself got completely discharged , so vehicle would not be able to drive further even though we appllies the More Driving cycle (More than 3 )
2) So , in this case with given configuration the Vehicle would not be able to complete the (Travell) the distance of 45 kM , as Battery will gets discharged completely before the 3 drive cycle itself
3) We need to Increase the Range of the Vehicle ( Ability to travel the distance ) , which is in this case is 41.36 Km , by Changing the Battery capacity .
Q.2. In the above case, try changing the battery capacity and repeat the simulation.
1) We can chnage the "Battary Capacity" in above model to increase the "Range of Vehicle "
2) Following Fig shows the model for the same above model with change in "Battery Capacity " to increase the range of the Vehicle
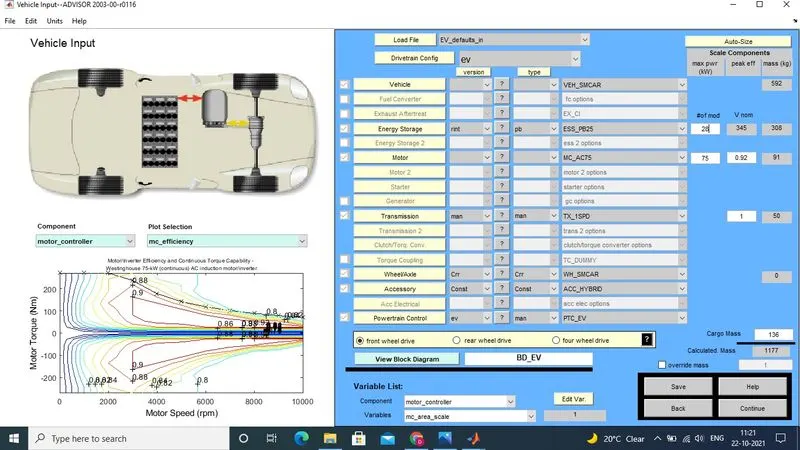
3) As shown in above model , the "No of Module " are increased to the 28 , which results in increase in the Voltage (Vnominal ) euqals to 345
4) The following is the Result of the above model with 4 "CYC_FTP" Driving cycle
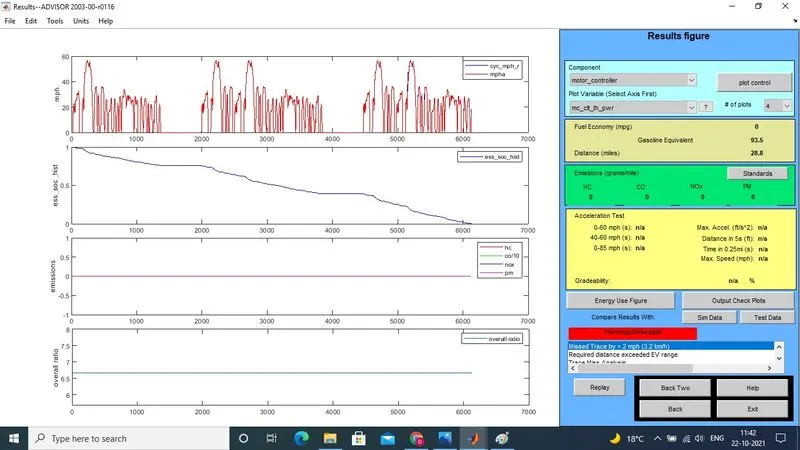
5) In above Result you can see the "SOC' Plot where the "Range " of the Vehicle got increased , which eventually helps the vehicle to achieve the desired distance of 45 Km
6) In this case the vehicle travels the 28.8 Miles ( 46.34Km) , which is achieved due to change in the Charigng capacity by keeping all other parameters same as used before
Q.3 Perform gradeability test with PRIUS_Jpn_defaults_in file
Compare your results in table and conclude.
1) Following Fig shows , the ADVISOR model for the PRIUS_Jpn_defaults_in file for the Gradibility test
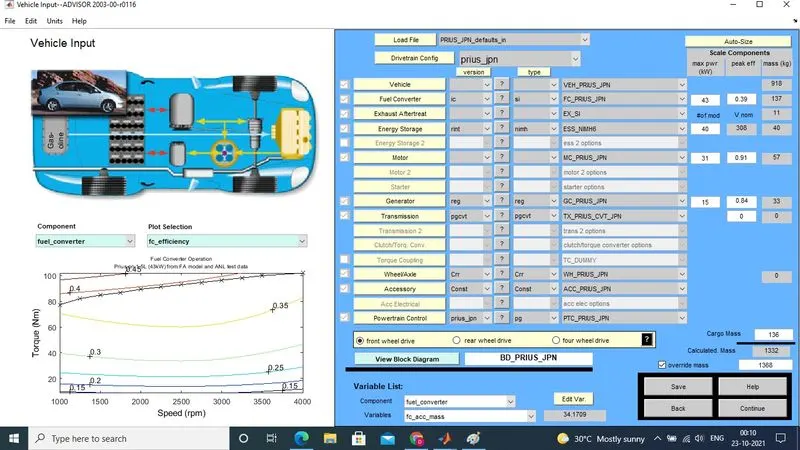
2)The above Model has the Following specification ,
Battery Storage : Nickel etal Hybrid(nmh) Battery , with 40 Module , and Nominal Voltage of 308V
Fuel Converter : Ic Engine model with Look up table , with power rating of 43Kw & 0.39 efficiency
Generator : With 15 kw and 0.84 Efficiency
Transmission : Planetary Gear CVT (pgcvt)
Front Wheel Drive , with Cargo Mass of 136kg
2) To carry out the Gradibility Test , we need to select the Grade option
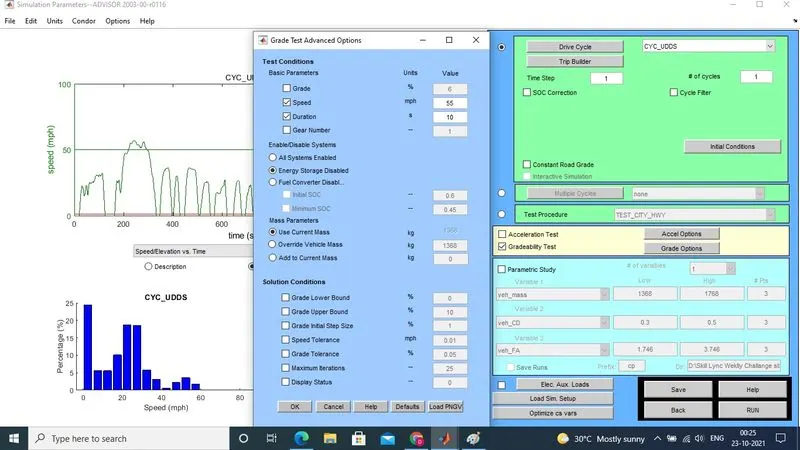
3) To carry out the gradibility test we need to keep the Duration constant (10 sec) and the Gradiility test is carried out with Different speed from 55mph to 90mph , and again from 20 mph to 50 mph
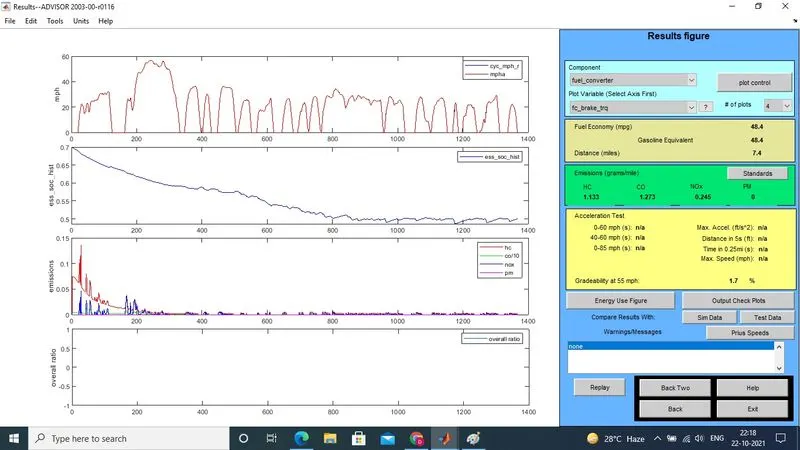
4) Following fig shows the Gradibility test result at the 55 mph, so as shown below the Gradibility st 55 mph is Equals to 1.7%
5) Simillarly we can carry out the Gradibility test , at the Different speed and tabulate the result as below
| Sr No | Speed (mph) | Gradibility (%) |
| 1 | 20 | 0 |
| 2 | 25 | 0 |
| 3 | 30 | 2.5 |
| 4 | 35 | 2.4 |
| 5 | 40 | 2.5 |
| 6 | 45 | 2.2 |
| 7 | 50 | 2 |
| 8 | 55 | 1.7 |
| 9 | 60 | 1.5 |
| 10 | 65 | 1.2 |
| 11 | 70 | 0.9 |
| 12 | 75 | 0.7 |
| 13 | 80 | 0.3 |
| 14 | 85 | 1 |
| 15 | 90 | 0.3 |
Below is the Google Drive link from which above Result is created , the link consits of the Foloder "Gradibility " in which the gradibility is menioned for the respective speed
https://drive.google.com/drive/folders/1hHXnN3JlpPSagSzr5IaFGxigZ_5L10HQ?usp=sharing
Conclusion :
6) So from above observation , we can see the Gradibility is stable around 2.5 (Approx) from the 30mph to 40 mph , then it starts decreasing from the 45mph as speed increases till the 80 mph
7) At the Speed 30mph and the 40 mph it is maximum at 2.5 , and the minimum(0) below 30 mph
8) So Vehicle can drive the slope if it moves at the spped in the range of 30pmh to 40 mph
7) Below is the Google Drive link from which above Result is created , the link consits of the Foloder "Gradibility " in which the gradibility is menioned for the respective speed
https://drive.google.com/drive/folders/1hHXnN3JlpPSagSzr5IaFGxigZ_5L10HQ?usp=sharing