Week-4 Challenge WOT Condition Part-2
- What is the difference between mapped and dynamic model of engine, motor and generator? How can you change model type?
Ans :
Difference between mapped and Dynamic Model:
1st:Mapped-
Mapped model usses a set of steady state lookup table for simulation and it,s oparation.
Dynamic-
it's decomposes the engine behaviour into lower level blocks.Those blocks are made with dynamic model block.it's oparate dynamicaly depending on the environment.
2nd:Mapped-
Its basically a collected data table which is use in model as lookup table or any data inputs .Here the simulation result shows as real life data base.
Dynamic-
here the blocks are arrange as the system mathematical or logically.where the simulation result showse as mathematical analysis basis.
3nd:Mapped-
if we want to change the model charectaristics then we need to change the given array list inputs.
Dynamic-
if it's need the changes then the system need to change the blocks as our requrement.
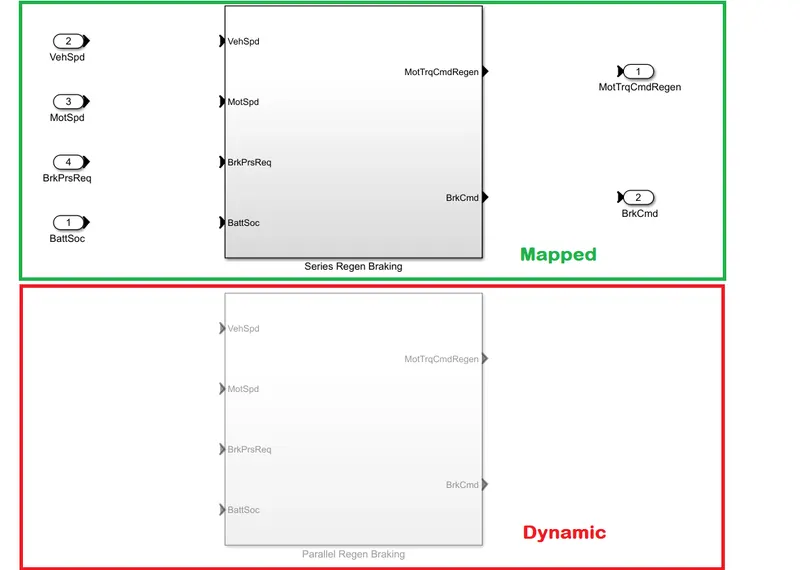
At the example 'Explore the Electric Vehicle Reference Application' we found the model wher the green indicator for Mapped block
and red block for Dynamic block.
2.How does the model calculate miles per gallon? Which factors are considered to model fuel flow?
Ans:
:From analysis the model "Explore the Electric Vehicle Reference Application" we get-
In the model the Visualization blockwe get the Performance calculation block which nothing but the MPGe calculation block.
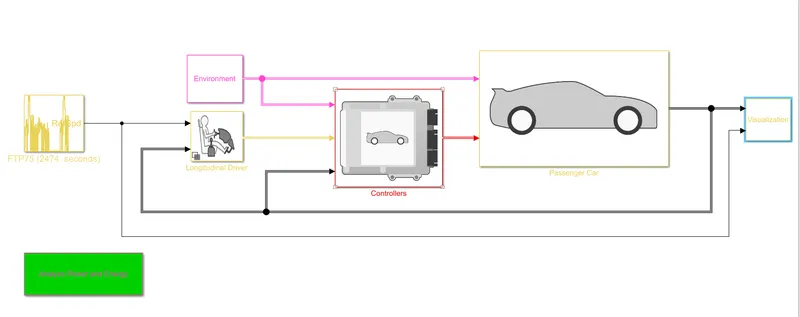
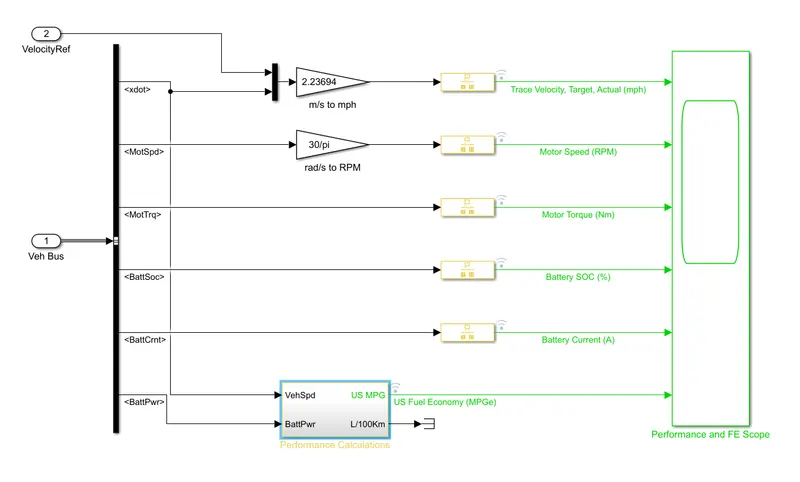
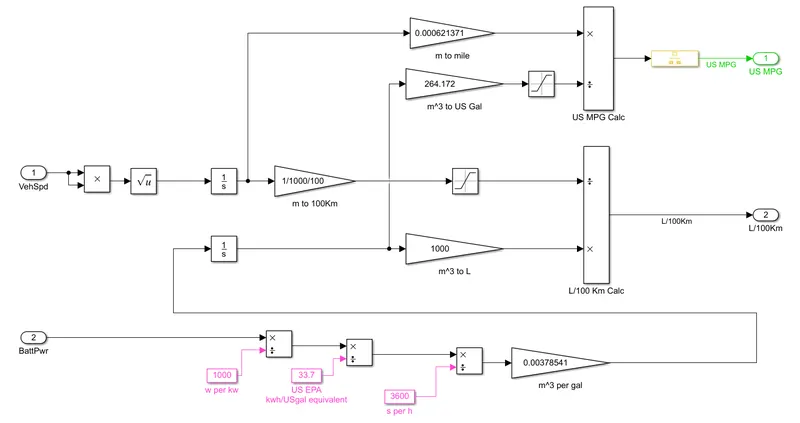
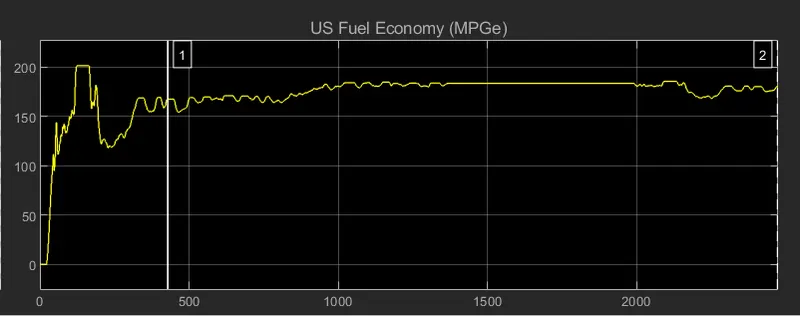
Below model represent the MPGe mathe matical calculation equation.After calculating by this model the vehical shows the MPGe perfomance data.
The performance graph for the model is-(without chenging the parameters)
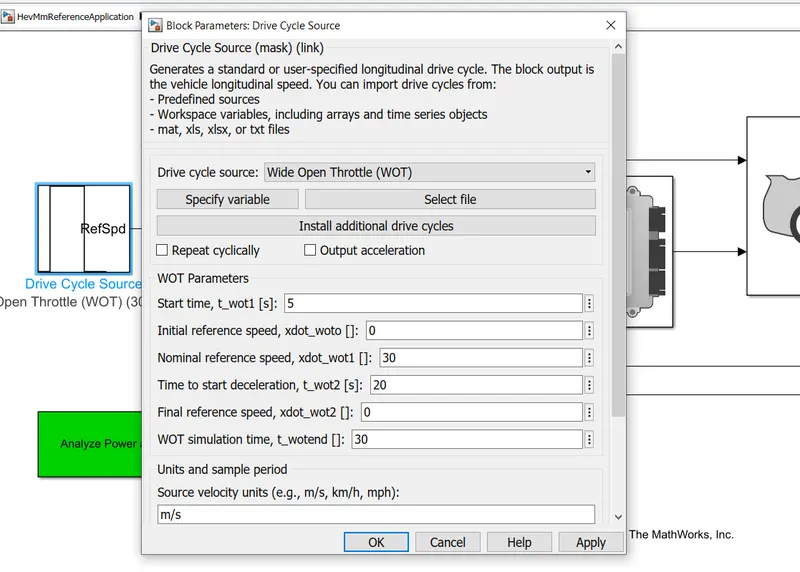
3.Run the HEV ReferenceApplication with WOT drive cycle. Change the grade and wind velocity in the environment block. Comment on the results.
ANS:
Asper refarance "Explore the Hybrid Electric Vehicle Multimode Reference Application" example we get-
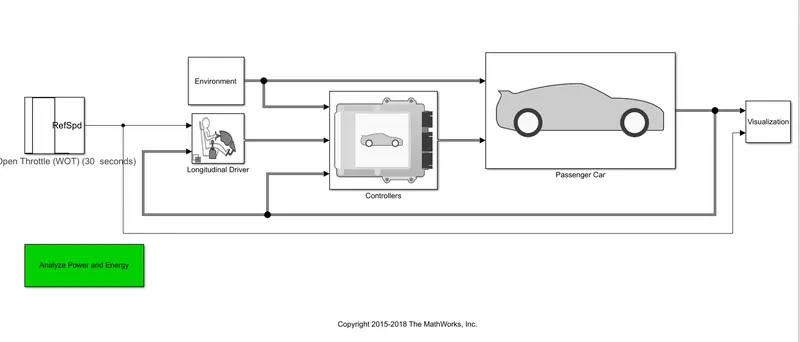
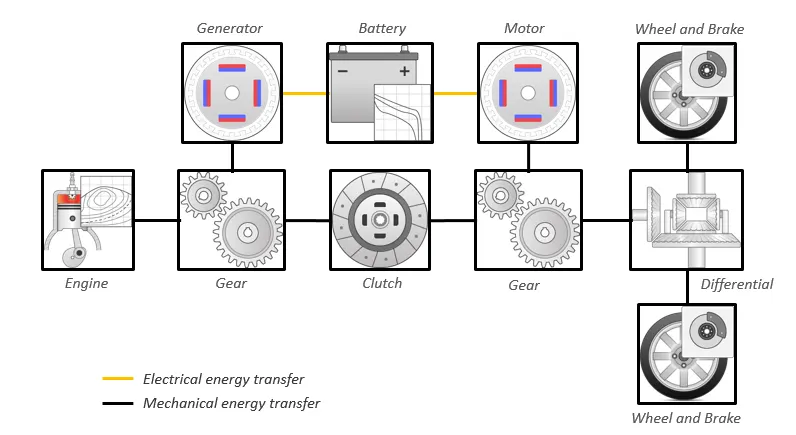
Hybrid vehical analysis result after change the driving cycle to WOT.
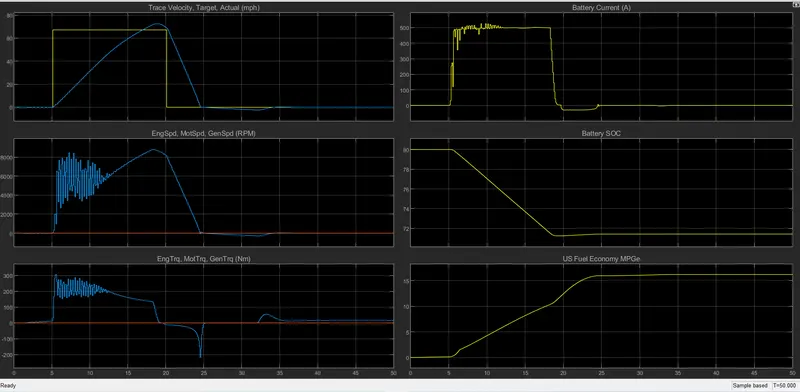
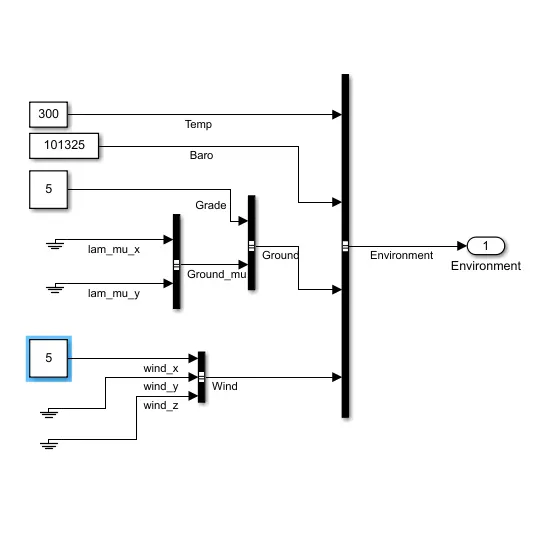
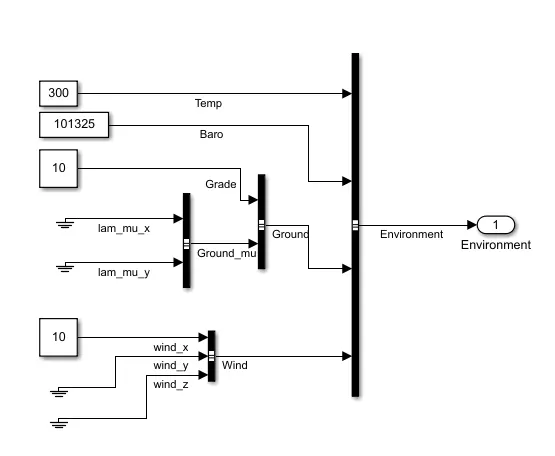
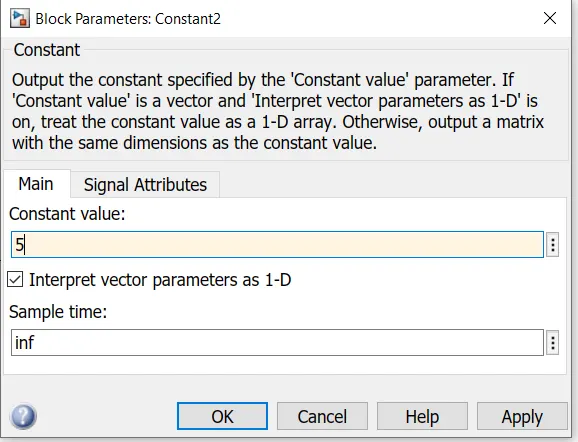
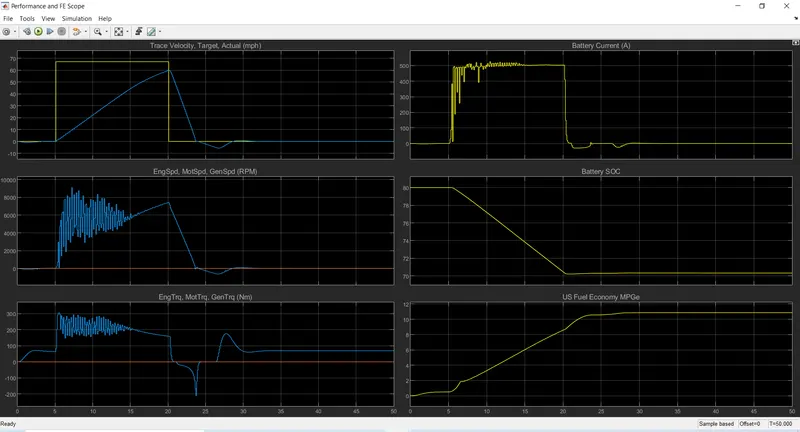
we change the grade value and the velocity of theb vihecal become 5 and 10 and the driving cycle become WOT we get-
The graph after change the value of grade and velocity -
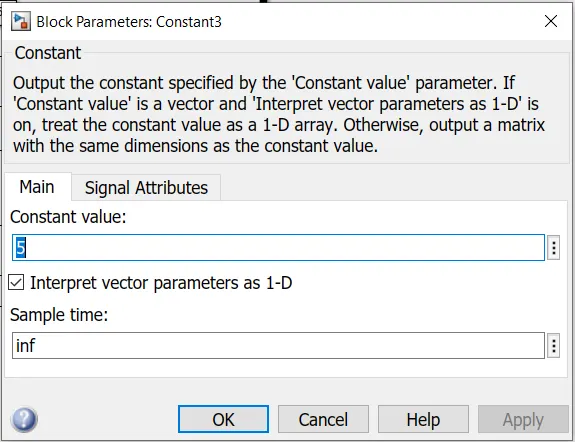
The grade value=5
The wind velocity=5
Simulation time=50 sec
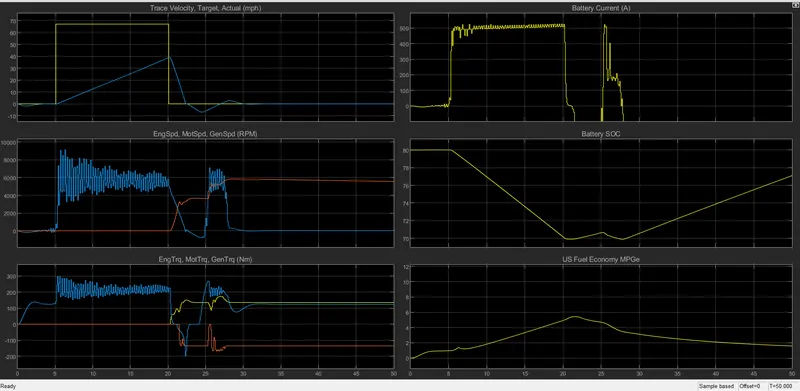
The grade value=10
Wind Velocity=10
Simulation time=50 sec
Conclusion:
From above two graph we conclude that the s value of wind velocity with grade change the Battary SOC and MPGe graph become change. The Battary SOC value become increases with change of grade value and eqally the MPGe value become reduced.
And with effect of wind velocity RPM become reduce.
4.Keeping all other parameters same, compare the simulated results of hybrid and pure electric powertrains.
ANS:
we compare the Hybrid and pure electrical vehical powertrain solution -
we just change the driving cycle fore both and the compare result is given bilow.
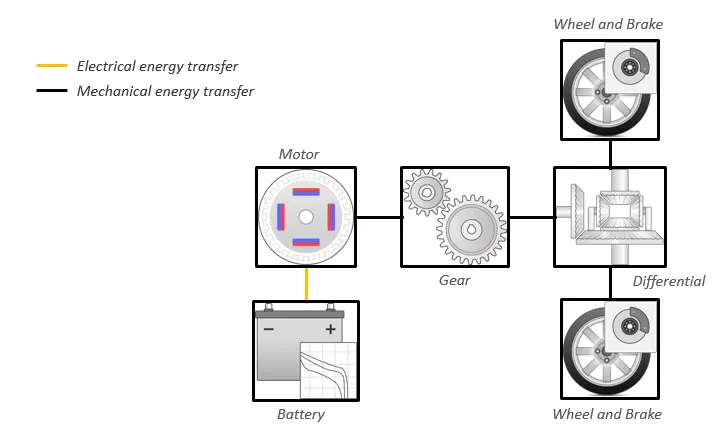
Hybrid Vehical model Pure Electrical Vehical Model
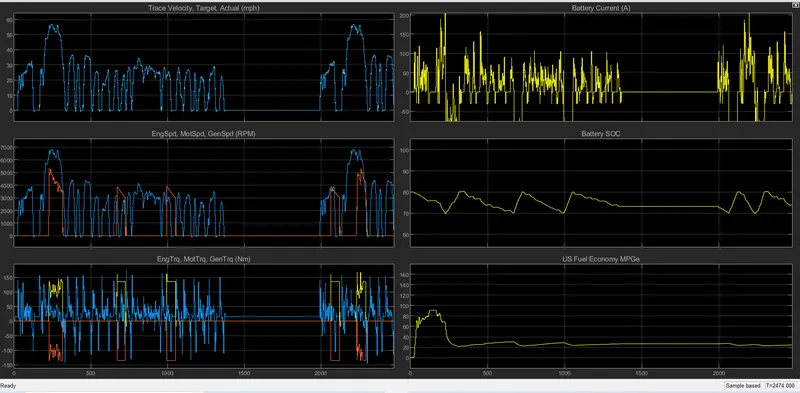
Hybrid Vehical plot
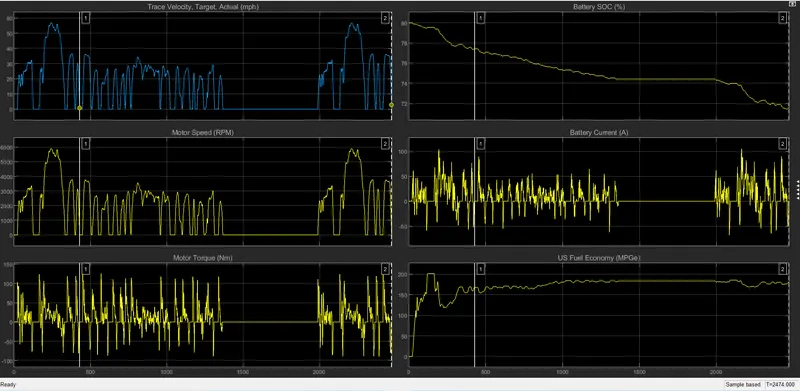
Pure electrical vehical plot