Week-4 Challenge WOT Condition Part-2
Week-4 Challenge WOT Condition Part-2
Aim:
To understand the HEV Multimode Reference Application in simulink and complete the given objectives
Objectives:
- What is the difference between mapped and dynamic model of engine, motor and generator? How can you change model type?
- How does the model calculate miles per gallon? Which factors are considered to model fuel flow?
- Run the HEV Reference Application with WOT drive cycle. Change the grade and wind velocity in the environment block. Comment on the results.
- Keeping all other parameters same, compare the simulated results of hybrid and pure electric power trains.
HEV Multimode Reference Application:
The Hybrid Electric Vehicle multimode reference application is a multimode model with IC engine, transmission, battery, generator, motor and other power train control components and associated algorithm to effectively study the power matching, components selection and to establish control algorithms. It can be used for hardware in loop testing.
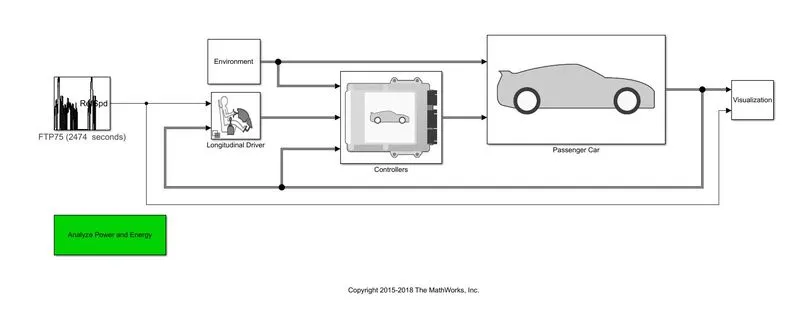
This primary reference model comprises of subsystems which works based on the set point and process variables as like in any feedback control systems. The function of individual components is briefly discussed below.
FTP75 (2474 seconds)-The reference block works to imitate the set of driving cycles based on user selection. As default FTP75 driving cycle was assigned in this reference example. With the drive cycle as set point and the Passenger car system as the plant the system compares the process variables in each control loop as per the configuration.
Longitudinal driver- This block works as a PI controller which compares the reference data to the feedback and approaches for zero error. With the command signal from the longitudinal driver block the controller functions based on the algorithm.
Environment- External factors are environmental conditions such as grade, temperature, barometric pressure, wind velocity, etc were added as disturbance to the system. These data are fed in to the controller computation.
Controllers-This power train control module consists of the engine and hybrid control modules.
The engine control module performs computation based on the available data such are engine parameters, environmental condition and vehicle feedback and control the engine of the vehicle.The hybrid control module controls the non engine components such as motor, generator and brakes based on control algorithms.
Passenger car-The passenger car is the plant of the system which consists of the power train and driveline components, this actually does produce the mechanical power output by which the system performs.This subsystem consists of the engine, electric plant and drive train components.
Objective-1
What is the difference between mapped and dynamic model of engine, motor and generator? How can you change model type?
In the HEV multimode application the pant subsystem component can be selected as variants of mapped and dynamic models as follows.
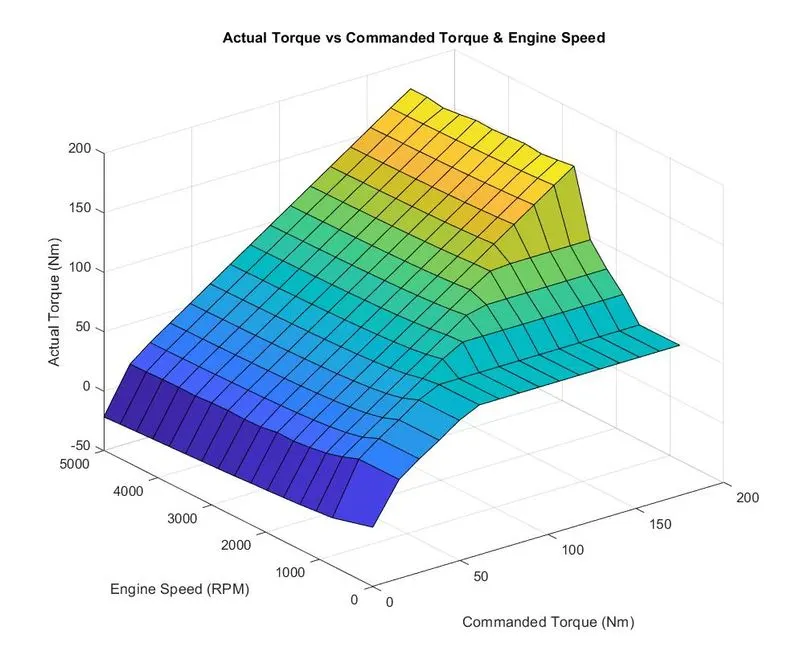
Mapped model: While modeling a complicated system the sublevel components can be mapped using a lookup table consists of necessary operating data recorded from a physical system or from model based calibration toolbox. These available data helps for the simplicity of the system model by reducing the construction and computation time. These mapped model can be used when every there is an uncertainty about the first principles or physics and in systems where detailed dynamics are not necessary.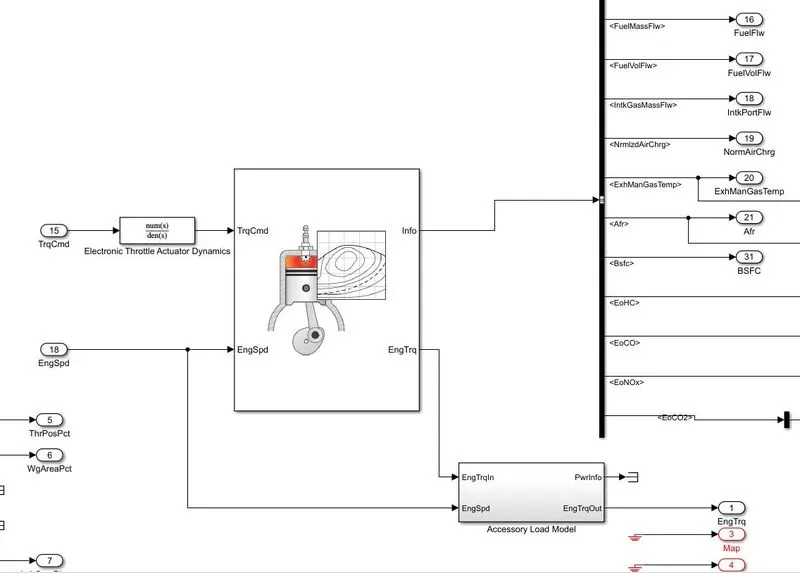
Dynamic model: The dynamic model uses the subsystems which functions based on the first principle model. It uses one or more physical equation to compute the output based on the required inputs.In simulink these are different components block set to which dynamic input can be provided which performs mathematical calculations and passes the data on to the downstream models, by which dynamic output will be computed.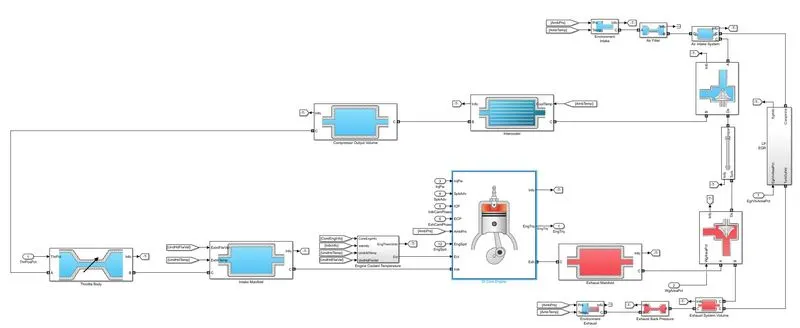
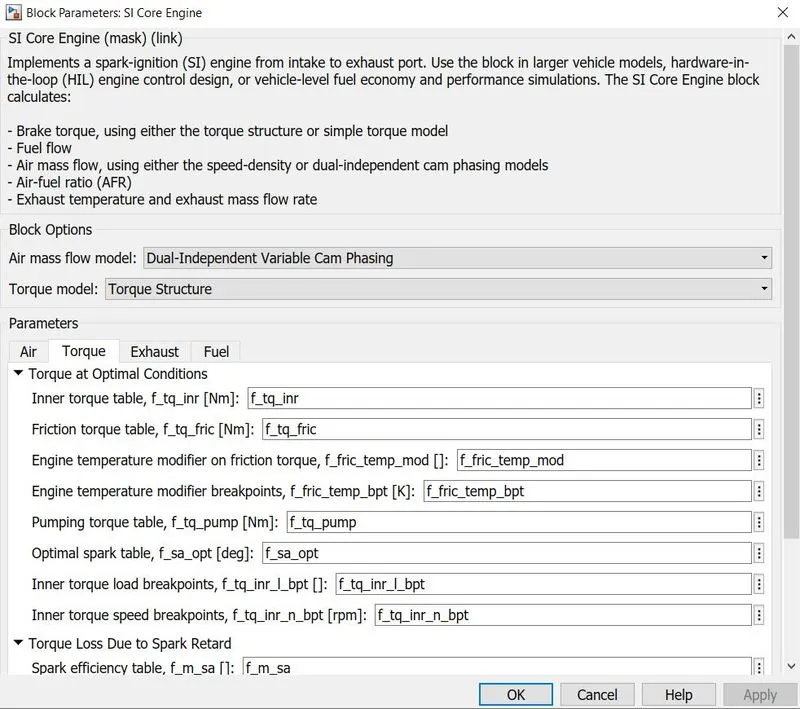
Mapped and dynamic model of engine, motor and generator:
| Component | Mapped model | Dynamic model |
| Engine |
|
|
| Motor |
|
|
| Generator |
|
|
Changing model type:
The model type between the mapped and dynamic model can be changed by using the variant selection option as below.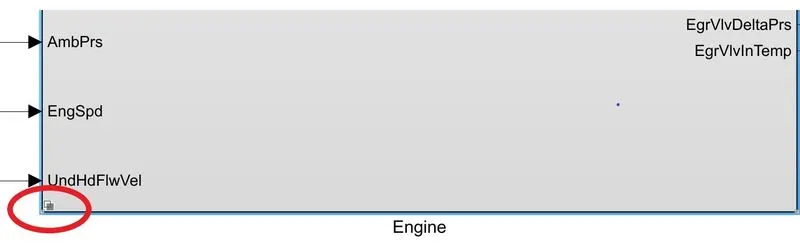
When the variant selection icon appears for any of the block then the model can be identified as variant selection optional.
For any model with the variant selection icon then the model can be changed by right clicking at the block model and navigate through Variant>Label Model Active Choice>SiMappedEngine(SiMappedEngine)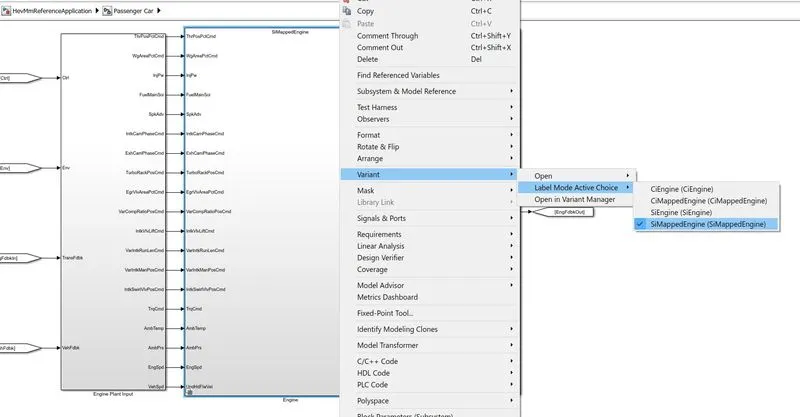
Objective-2
How does the model calculate miles per gallon? Which factors are considered to model fuel flow?
Miles per gallon calculation:
Miles per gallon (MPG) is the US standard of calculating vehicles fuel consumption. It defines the distance the vehicle could travel per gallon of fuel usage. It is same as the Indian standard of calculating fuel consumption as Kilometer per litter (KMPL)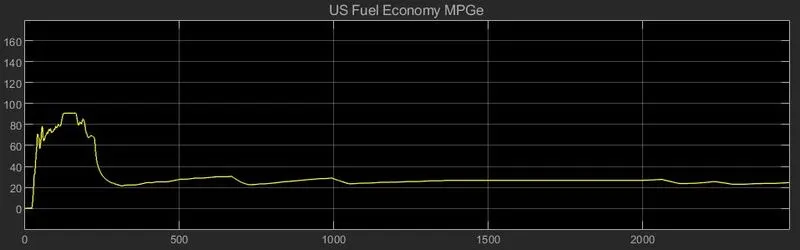
In the HEV Multimode reference application miles per gallon is calculated using the fuel flow data available from the engine along with the power utilization from the battery as kWh by converting the kWh to the equivalent gallon of gasoline using the conversion factor ‘33.7 kWh = 1 gallon of gasoline’. The cause battery power being converted to fuel consumption is that the power stored in the battery is being generated using the mechanical power output of the engine. In this case regenerative braking is excluded for fuel consumption calculation as they are minimum amount and may contribute to the other electrical components operation.
The fuel flow requires 3 input data as vehicle speed, fuel volume flow and battery power. Generally fuel consumption is being calculated as , the same has been used in the HEV miles per gallon calculation.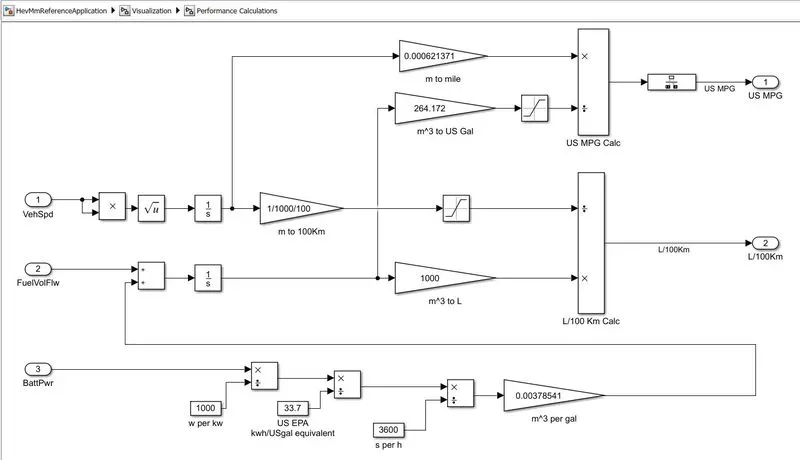
- From the input port 1 vehicle speed can be obtained, by integrating the varying vehicle speed the total distance travelled by the vehicle at the instant can be calculated. By using the meter to mile conversion factor ‘1 meter = 0.000621371mile’ as gain over the distance travelled in meter the distance travelled by the vehicle in miles can be calculated.
- From the battery power data in watt by converting it to kw and by using the conversion factor for gallon of gasoline per kw ‘1 gallon of gasoline = 33.7 kWh’ and converting the gallon to cubic meter using the conversion factor ‘1 gallon = 0.00378541 cubic meter’ the fuel consumption in cubic meter can be calculated.
- From the fuel volume flow data in cubic meter and by adding the fuel consumption equivalent to battery power the total fuel consumption can be calculated by summing them up. Up on integrating the fuel consumption on each instance the total fuel consumed can be calculated.
- From the distance travelled by the vehicle and the fuel consumption after converting the cubic meter in to gallon using the conversion factor ‘1 cubic meter = 264.172 gallon’ and by using the fuel consumption formula standard formula the miles per gallon of the HEV can be calculated.
Factors are considered to model fuel flow:
The fuel flow data in the mapped and dynamic engine models are not the same.
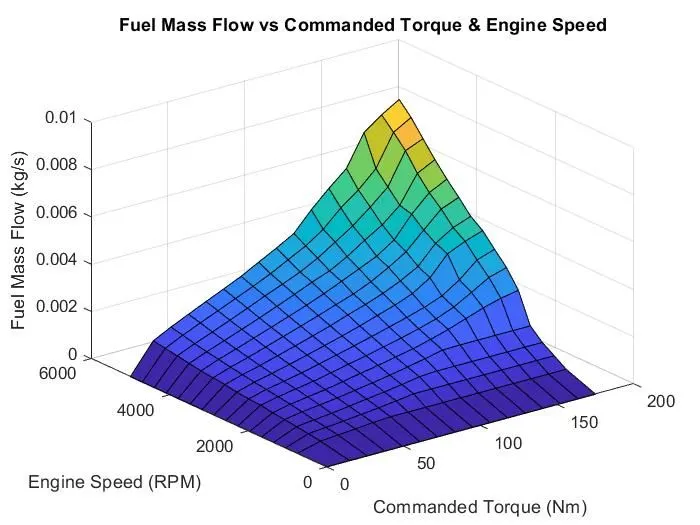
Mapped engine model- In mapped engine model the fuel flow map is already available as a look up table, as the function of commanded torque and engine speed the fuel mass flow can be obtained using the lookup table.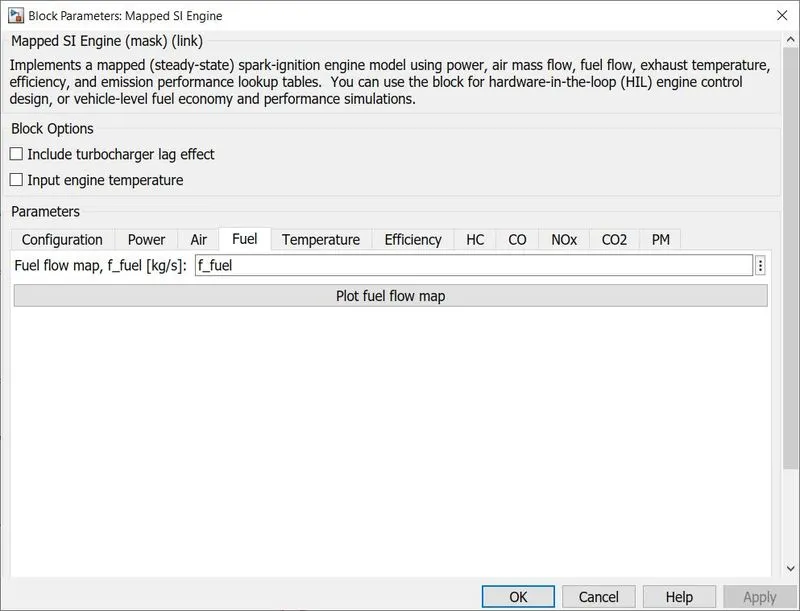
Dynamic engine model- In the dynamic engine model the fuel mass flow was calculated using the physical equation available in the engine model block. The main factor for calculating the fuel flow mass is the air-fuel stiochiometric ratio, 1:14.6 in this engine, that is 1 unit of fuel will be used to combust 14.6 units of air. From the trapped air mass and the air fuel ratio the fuel mass flow in the dynamic engine model can be calculated.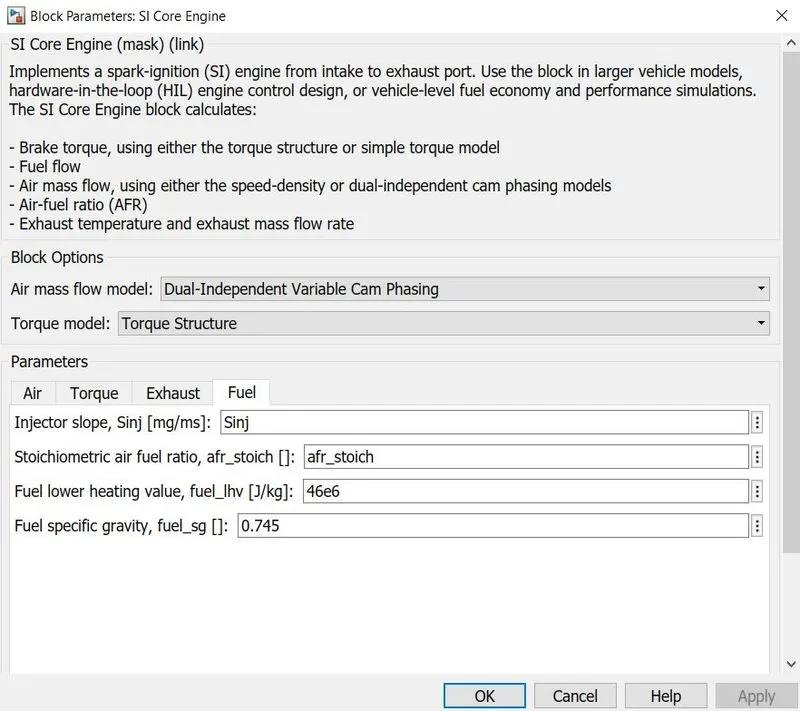
Objective-3
Run the HEV Reference Application with WOT drive cycle. Change the grade and wind velocity in the environment block. Comment on the results.
Wide open throttle condition-1
For the WOT condition-1 test the drive cycle was set to ‘Wide Open Throttle (WOT) (30 seconds)’ and the simulation time was set to 60 seconds.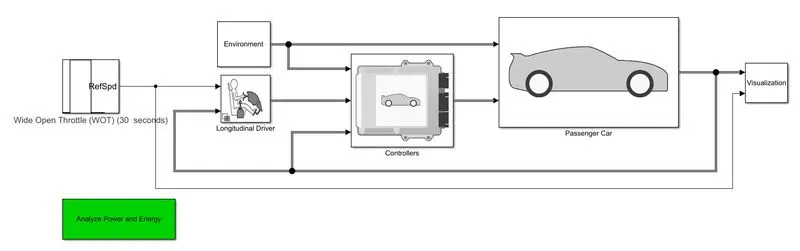
The below results were obtained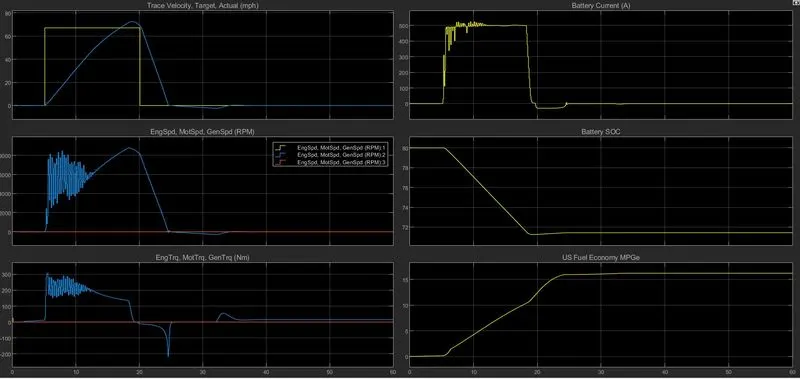
Target and actual velocity- The actual velocity started to increase at 5 sec and reaches its maximum velocity 67mph at 18sec and drops to 0 mph at 24sec following the target velocity.
Engine speed, Motor speed and Generator speed- The engine and generator were idle throughout the WOT condition while the motor speed increases instantly at 5 sec following the WOT cycle even though the speed is fluctuating it reaches a maximum of around 8200rpm and drops to zero due to braking at 24sec.
Engine torque, Motor torque and Generator torque- The engine remains idle thorough out the cycle while the motor torque instantly increases to a maximum of around 310Nm at 5sec and gradually maintained to around 200Nm and when the target velocity drops to zero and due to braking the motor slows down to zero while due to regenerative braking the generator experience a mild torque.
Battery current- The battery current was 0 until the WOT starts at 5sec, due to the motor power demand the battery starts its supply of 500A and maintained till the end of the cycle at 20 sec. from 20sec to around 24sec the battery gets its charge back due to regeneration by braking.
Battery state of charge- The battery state of charge (SOC) started to fall since the start of the cycle at 5 sec and drops to around 71% till the end of the cycle.
US fuel economy- The US fuel economy of 15mph was maintained throughout the cycle since the start. The amount of charge discharged from the battery is equivalent to the gallon of gasoline as per the conversion factor since the battery was considered to be charged by the engine.
Wide open throttle condition-2 (Change the grade and wind velocity)
For the same WOT for condition-2 the grade and wind velocity was changed in the environment block while keeping the other parameters the same.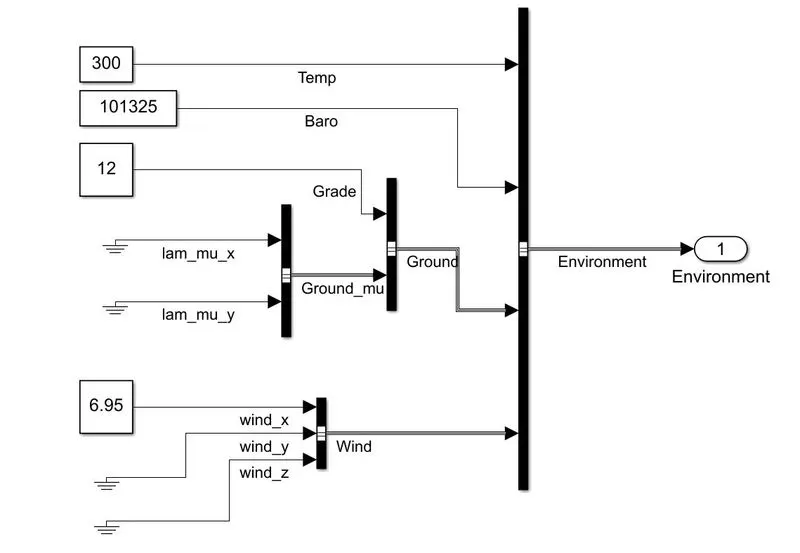
The grade was changed from 0° to 12° and the wind velocity was changed from 0m/s to 6.95m/s and the following changes were observed.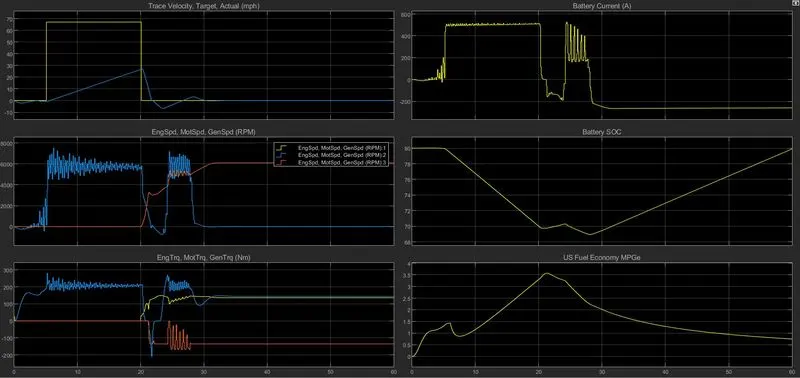
Target and actual velocity-
- At the start of the cycle when the target velocity of 0mph the vehicle experienced a roll back due to the grade of 12° with the velocity of around 2 to 3mph in the reverse direction so the longitudinal driver (PI controller kind of) starts to move the vehicle to maintain 0mph by keeping the vehicle at rest following the drive cycle.
- When the WOT cycle starts a raise to 67mph the at 5sec the vehicle started to accelerate to a maximum of app 26mph at 20sec and started to decelerate due to the target velocity hits 0.
- As soon as the vehicle comes to rest at 24sec the vehicle started to roll back due to the grade ability experiences a negative speed in reverse direction for which the longitudinal driver acts as a PI controller and started to move the vehicle in forward direction, this cycle continues for a short term until the vehicle experience no movement in any direction in sort of following the drive cycle.
- Rather than the previous case i.e. condition-1 the vehicle could able to reach the maximum of 26mph at 24sec due to the disturbance in the form of grade ability 12° and the wind velocity 6.95m/s. it was observed the top speed and acceleration of the vehicle are much affected due to the environmental factors such as grade and velocity.
Engine speed, Motor speed and Generator speed-
- The engine and generator speed remains constant until the end of the cycle while the motor started to rotate in the reverse direction due to the application of grade ability.
- Due to the action of the longitudinal driver to keep the vehicle at rest the motor experience a forward speed to keep the vehicle not to move in any direction.
- At the time of 5sec the motor started to rotate instantly and rises up to 7800 rpm and maintained a gradual speed of around 5800rpm till the target velocity drops to 0mph.
- When the target cycle drops to 0 and due to the application of brake the motor speed decreases to 0 at 26sec, after which the motor experience a reverse rotation due to grade ability.
- There by the longitudinal driver intents to keep the vehicle at rest so the forward and reverse rotation of the motor was experienced until the vehicle completely comes to rest.
- When the drive cycle drops to 0,ph and due to the state of charge of battery below the critical point the engine starts to drive the generator to charge the battery which was observed from the graph.
- Due to the effect of gravity the motor had to experience rotation to 5800rpm even after the cycle completes. This is because of the action of the longitudinal driver who intends to prevent the vehicle from rolling back due to the application of grade ability.
- The combined effect of grade ability and wind velocity put the vehicle in high demand of torque and power which the power train cannot able to fulfill result the slowing down of motor and acceleration when compared to the condition-1.
Engine torque, Motor torque and Generator torque-
- The engine remains idle thorough out the cycle when it starts until it drops to zero because the vehicle WOT condition was fulfilled by the motor due to its instantaneous torque.
- The motor experience torque since the start of the cycle due to the roll back and acceleration by the driver to keep the vehicle at rest by following the target velocity i.e. 0mph.
- The motor torque instantaneously increases due to the drive cycle which rises to 67mph at the instant of time, there by the motor tried to maintained torque of 200Nm even though it is fluctuating until the target velocity drops to 0mph, and then the vehicle decelerates to 0mph at 23sec there by the motor torque started to decrease.
- Due to the application of grade the vehicle started to roll back thus the motor again experiences torque until the vehicle is put in to rest at 0mph by the driver following the WOT drive cycle.
- When the battery drops below critical SOC the engine started running to charge up the battery using the generator so the generator and engine experience torque to regain the battery above critical SOC state. It is t be noted the generator also experience torque due to regenerative braking and the roll back of the vehicle.
- As part of the grade ability the torque characteristics of the engine, motor and generator has been altered.
Battery current-
- The battery current was 0A at the start of the cycle and started to change trend in the negative direction due to the roll back of the vehicle because of the grade of 12° the driveline effect over the generator as it slides down the hill, means the battery is charging up. At around 2 to 3sec the battery current started increase in positive direction as the driver tend to keep the vehicle at rest following the drive cycle for which the motor have to provide force on the vehicle to keep it from moving.
- At 5sec the battery current instantly increases to around 500A to fulfill the demand by the motor and maintains the range to deliver full power until the target velocity of the cycle drops to 0mph and the battery current decreases to 0A and started to rise at the negative due to regenerative braking.
- After the vehicle comes to rest it experience the rolling downhill in reverse direction due to the slope and the battery is charging up showing 195A in the negative direction.
- The driver then tries to keep the vehicle from sliding back an amount of current at the average of 220A being supplied to the motor.
- As soon as the battery state of charge drop below the critical level the engine started to run the generator pushing current in to the battery by which it experience a charge up to 220A after 28th
Battery state of charge-
- The Battery SOC is initially at high i.e. 80% at the start of the cycle the vehicle is at rest and there observed a slight decrease due to the driver’s effect to provide power to the motor to prevent the vehicle from sliding down the hill.
- When the target velocity hits to 67mph at 5 sec the motor was commanded to deliver the full power as part of the WOT condition which drains the battery drastically to 69.5% at 21 sec till the vehicle decelerate and comes to rest.
- Due to the downhill the SOC again increased to 70.5% as road wheel drives the generator to charge the battery, then the battery started to drain again due to the effect of the driver by supplying power to the motor to keep the vehicle at rest which consumes the charge of the battery and again the SOC drops to 69%.From the battery controller it was found the lower critical SOC is 70%, below 70% the controller command engine to crank up and charge the battery.
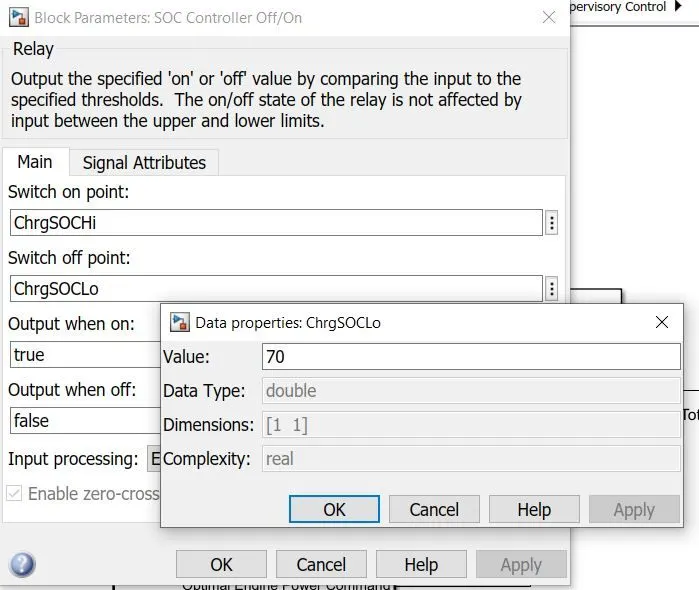
- At 28 sec when the SOC is 69% the engine powers the generator to charge the battery there by the SOC of the battery was observed to be increasing towards the battery Hi level i.e. 80% SOC until the end of the cycle.
US fuel economy-
- At the beginning of the cycle when the vehicle slides down and the driver tries to keep the vehicle from moving down the fuel economy equivalent to the battery power expenditure is at around 1.5mpg.
- When the target velocity increases to 67mph at 5sec the motor has been powered by the battery for WOT condition observed the fuel economy up to 3.6mpg until the vehicle comes to rest.
- After the target velocity drops to 0mph and the effective utilization of the power from the battery the battery SOC drops below the critical SOC point i.e. 69%.
- At 28 sec when the battery SOC is 69% the controlled cranks the engine to deliver power to the battery which consumed fuel until the battery reaches to the Hi level i.e. 80%. It was observed the fuel economy started to drop from 3.6mpg to 0.75mpg till the end of the cycle due to the combined effect of wind velocity and grade ability.
Objective-4
Keeping all other parameters same, compare the simulated results of hybrid and pure electric power trains.
The hybrid and pure electric power trains were simulated and the following performance characteristics were observed.
Pure electric vehicle:
Power train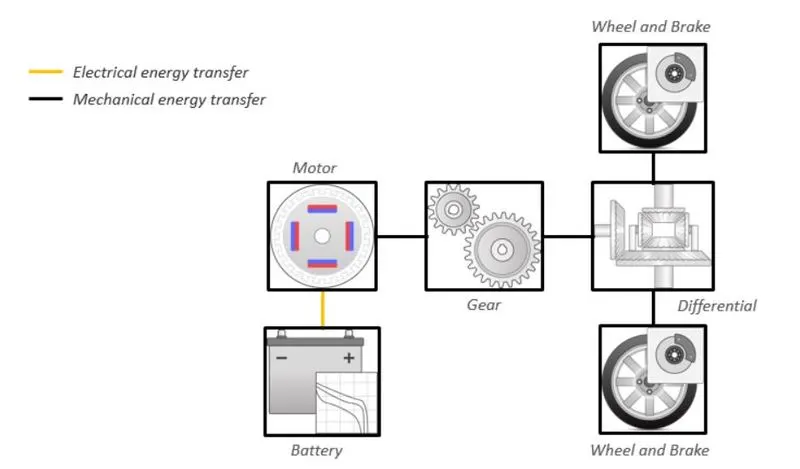
Simulation result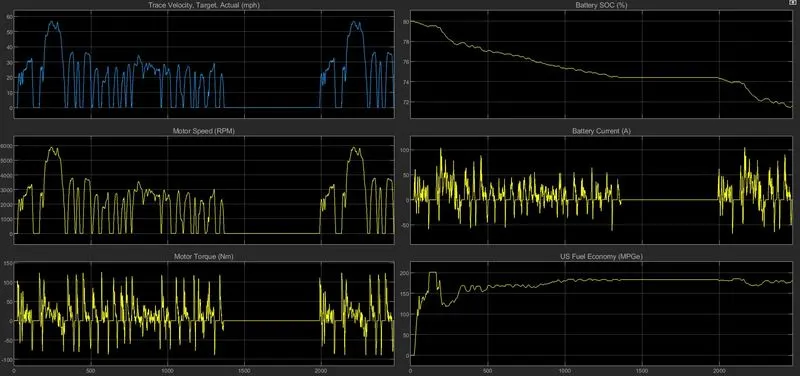
Hybrid electric vehicle:
Power train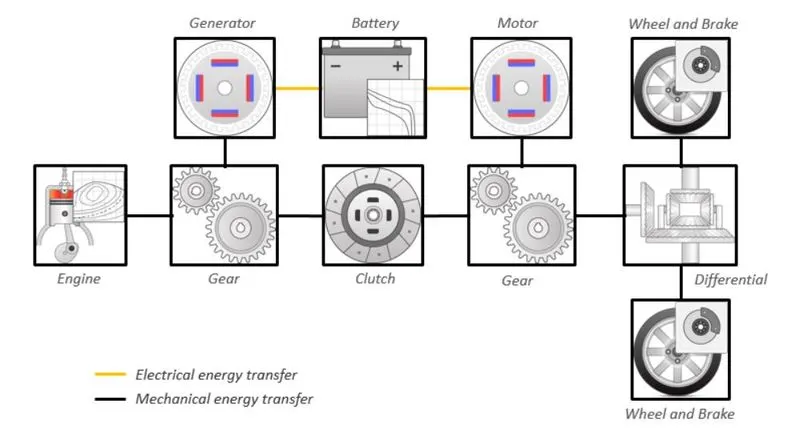
Simulation result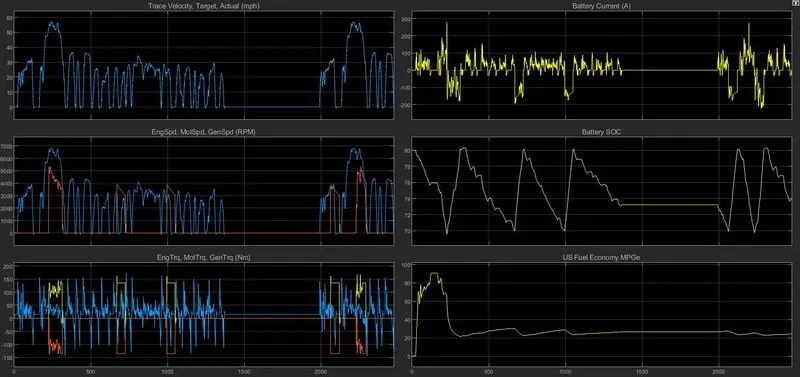
Power train Layout:
- The power train layout of pure electric vehicle is simple which consist of Battery, motor, reduction gear, differential, wheels and brakes.
- Whereas the hybrid vehicle power train layout is little complicated than the pure electric vehicle.
The hybrid vehicle adds an IC engine, generator, clutch and transmission which add more complexity and weight of the vehicle.
Target and actual velocity:
- The target velocity chosen here is FTP75 drive cycle which is the default drive cycle in both the electric and hybrid vehicle.
- As default the simulation runs for 2474 seconds.
Motor speed:
- Electric power train-
- In electric vehicle power train the motor speed raises to the maximum of around 5990 rpm, this is because the pure electric vehicle has greater initial torque and does not need a transmission unit for fulfilling initial torque and later speed requirement.
- Usually induction motors have better torque-speed characteristics thus the electric vehicle is capable to produce required torque to provide driving force at lower speed rather than an IC engine operated vehicle
- Hybrid power train-
- In hybrid vehicle power train the motor speed rises to the maximum of around 6990 rpm which is a 1000rpm more than that of the pure electric drive train. This is because of the addition of transmission system in to the power train. By considering the torque and speed requirement a transmission has been introduced in to the system as like the conventional vehicle drive train.
- In order to provide more torque and speed the motor have to consider the necessary transmission reduction to provide better leverage between the prime mover and the road wheels which results in the motor to operate at higher speed than that in the pure electric power train.
Motor Torque:
- Electric power train-
- In electric power train the motor torque reaches to the maximum of 125Nm, this is the minimum requirement of torque needed by the motor to follow the drive cycle velocity.
- Hybrid power train-
- In hybrid power the motor torque reaches up to 175Nm, which is 50N-m more than that of the pure electric vehicle. This is because the hybrid power train has multiple other components like IC engine, generator, generator gears, clutch and transmission.
- Due to the addition of these drive line components the motor requires more torque to overcome the inertial effects of the rotational components, along with that the addition of these power train components also leads to the increase in weight of the vehicle results in more torque demand to put the necessary drive force to meet the drive cycle velocity.
Battery current:
- Electric power train-
- The electric vehicle uses less battery current of a maximum of 105A because of the lesser operating load on the motor due to the factors we discussed already regarding the motor torque.
- Hybrid power train-
- In the hybrid power train uses more battery current as per the torque requirement by the motor, the battery current spiked up to 285A to meet the motor demand in hybrid power train due to the additional factors contributing to the increase of load in the motor as discussed in the previous point.
Battery State of charge:
- Electric power train-
- The battery SOC in electric power train maintains a gradual decrease from the Battery Hi towards the Low state, at the end of the drive cycle the battery SOC observed was 71.5% which has not even hit the lower critical SOC point.
- Since electric motor is more efficient than other power systems also due to the lesser weight of the vehicle the motor takes up lesser load than that of the hybrid vehicle and maintains a slow discharge of the battery.
- Hybrid power train-
- In hybrid power train the battery SOC drops from 80 to 69.5% which is below lower SOC point in 250seconds due to the load requirement and current consumption of the motor. As per the control algorithm the Engine have to power up the generator to charge up the battery when the battery SOC drops below the critical point i.e. 70% in HEV case.
- When the battery drops below lower critical SOC the engine cranks up and charges the battery and increases its SOC towards the Hi level of 80% and it again drops below lower critical point after few pulls from the motor.
- This charging and discharging trend lasts until the end of the cycle.
US fuel economy:
- Electric power train-
- The pure hybrid vehicle power train maintains a good fuel economy around the average of 180mpg, which is far better than a hybrid power train. This is because of the fact that induction motors are much efficient to run than other means of power system and lesser load to the motor due to the absence of other power train system and lesser weight of the vehicle.
- Hybrid power train-
- In hybrid power train produces a better economy of fuel consumption at the beginning stages of the cycle due to the motor operation that drains the battery until the lower critical point i.e. below 70% SOC at 350sec, after that in order to increase the SOC level to higher range and to drive the road wheels in the absence of motor power the IC engine have to power up the drive train while also drives the generator to charge up the battery.
- Due to the combined effect of engine to drive the vehicle and to charge up the battery the fuel economy drastically drops down to the average of 22mpg.
From the above simulation of pure electric and hybrid electric power train it can be concluded that pure electric power train have more efficiency and low operating cost than the hybrid electric power train.
Conclusion:
Thus the HEV Multimode Reference application was studied and understood and the given objectives were completed.