WOT Drive Cycle Application on Simulink Model for different Conditions.
OBJECTIVE:
- To answer the question: What is the difference between mapped and dynamic model of engine, motor and generator? How can you change model type?
- To answer the question: How does the model calculate miles per gallon? Which factors are considered to model fuel flow?
- To Run the ‘HEV ReferenceApplication’ in MATLAB with WOT drive cycle and change the grade and wind velocity in the environment block and to comment on the results.
- To compare the simulated results of hybrid and pure electric powertrains by keeping all other parameters same.
SOLUTIONS:
Solution to Objective 1:
Question: What is the difference between mapped and dynamic model of engine, motor and generator? How can you change model type?
Solution: The Differences between a Mapped Model and a Dynamic Model are noted below:
|
Mapped Model |
Dynamic Model |
|
The simulation of the model is done on the basis of pre-defined output values for the given input values generally fed into the model in the form of Look-up Tables. |
The simulation of the model is done on the basis of real-time performance analysis of the model components. |
|
The Simulation time is less compared to the Dynamic Model as the mathematical computations are simple and the parameter output values of the components are based on the data in the Look-up Table. |
The Simulation time is more compared to the Mapped Model as the simulation involves many complex mathematical computations due to real-time analysis of the components of the model. |
|
Mapped Models tend to be less accurate as the pre-defined output values fed to the model only attain to particular conditions and assumptions. A slight deviation from these given conditions/assumptions in the model leads to less accurate results. |
Dynamic Models tend to highly accurate as the simulation results are based on the real time performance analysis of the model components. |
|
Mapped Models tend to be less complex compared to Dynamic models as the results are based on the data assigned to the model in the form of Look-up Tables. |
Dynamic Models tend to be more complex and detailed compared to Mapped Models as extracting the required parameter output values from the components may need inclusion of further sub-systems or sub-components within the component. |
Mapped Engine: There are some Mapped Engine Blocks in the Powertrain Blockset of Simulink. The CI Engine Blocks take Fuel Mass(mass of Fuel injected) and Engine Torque as inputs and return the output parameter values on the basis of the pre-defined data in the Look-up Table which can be fitted into the Block. Similarly the SI Engine Blocks take Engine Speed and Engine Torque as the input and return the output parameter values in the same way as that of the CI Mapped Engine Block.
Dynamic Engine: There are some Dynamic Engine Models in the Powertrain Blockset of Simulink. These simulation of models using these blocks represents a real time working of Engines wherein the Model decomposes the engine behavior into engine characteristics that are separated into lower-level components. By combining components in this way, the models capture the dynamic effects.
Mapped Motor: There is a Mapped Motor Block in the Powertrain Blockset of Simulink Library which implements a mapped motor and drive electronics operating in torque-control mode. These block takes input of the desired Motor Torque, Battery Voltage and returns the desired output parameter values based on the functional/relational values of a range of input values.
Dynamic Motor: The Dynamic Motor Blocks in Simulink Library implements a 3-phase motor which uses 3-phase input voltages to regulate individual phase currents, thus allowing control of motor torque or speed. The functioning and the output generation of these block is similar to Dynamic models as described in the above comparison between Mapped and Dynamic Models.
Mapped Generator: The working of a Generator is opposite to that of a Motor i.e. it converts energy/power/Force (in the form of Mechanical input) to Electrical output. A Mapped Generator returns Electrical Physical quantity output w.r.t. to a given Mechanical Physical quantity input wherein on the basis of pre-loaded functional/relational data fed to the model/system/block.
Dynamic Generator: It differs from the Mapped Generator in the aspect of how the output is generated. The parameters required for the mathematical computation of output is user-defined and the output is real-time generated using mathematical computations involving input parameter values and user-defined parmeters.
Let’s take the case of a MATLAB model where output of some components/systems/sub-models can be generated both via Dynamic Simulation and Mapped Simulation. For my case the Hybrid Electric Vehicle P2 Reference Application has been chosen. This MATLAB Model is available in the MATLAB Documentation Page.
Link for the Model Project: https://in.mathworks.com/help/autoblks/ug/explore-the-hybrid-electric-vehicle-p2-reference-application.html
- After opening the model in Simulink, double click on the ‘Passenger Car’ Subsystem.
- After opening the ‘Passenger Car’ Subsystem, open the ‘Electric Plant’ Subsystem by double-clicking on it.
- After opening the ‘Electric Plant’ Subsystem, double-click on the ‘Motor’ Subsystem.
- After opening the ‘Motor’ Subsystem, it’s seen that the Subsystem 2 subsystems of the Motor. One indicates Mapped model of Motor named ‘MotMapped’ and another indicates the Dynamic model of Motor named ‘MotDynamic’.
- By default, the dynamic version of the Motor named ‘MotDynamic’ is a bit blurred which indicates that by default that the Mapped version of the motor named ‘Motmapped’ will run/simulated when the main model is run/simulated.
- In order to change the model type from the Mapped version to Dynamic version, the following needs to be done:
- Right-click on the blank part of the Simulink screen corresponding to the ‘Motor’ Subsystem.
- Select the ‘Variant’ Button.
- Select the ‘Label Mode Active Choice’ Button.
- Select the required Model for Default Simulation. In my case it’ll be ‘MotDynamic (MotDynamic)’ as the default was set to ‘MotMapped (MotMapped)’.
- Similarly the same is applicable for all the other subsystems having a Mapped Version and a Dynamic Version of a particular component.
Solution to Objective 2:
Question: How does the model calculate miles per gallon? Which factors are considered to model fuel flow?
Solution: Miles per gallon (mpg) is the Distance (measured in miles) travelled by a vehicle on consumption of 1 gallon of fuel. Miles per gallon of a vehicle is an important indicator of fuel efficiency. More ‘miles per gallon’, more is the fuel efficiency of the vehicle.
The model referred to in the question can be found in the given link:
Link for the Model Project: https://in.mathworks.com/help/autoblks/ug/explore-the-hybrid-electric-vehicle-p2-reference-application.html
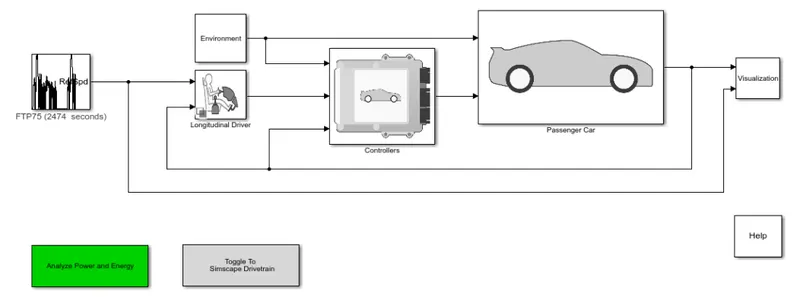
HEV P2 Reference Model
The miles per gallon calculation of the vehicle can be analysed from the Block Diagram present in the given address of the model: HevP2ReferenceApplication/Visualization/Performance Calculations
- There are 2 energy/power sources for driving the Hybrid Electric Vehicle -> The conventional Engine from which energy is derived from ignition of fuel and the Battery which provides electrical power to drive the vehicle.
- The miles per gallon calculation for this model requires the data for the net amount of Energy used for driving the vehicle and the total distance covered by the vehicle.
- The net amount of energy used for driving the vehicle comes from 2 sources -> The Battery and the Conventional Engine.
- The data for the net amount of fuel used for deriving power from the conventional engine is already present in the model.
- In order to calculate Gallons per mile of the vehicle, it is necessary to convert the net Battery Energy used into its equivalent Fuel Consumption amount.
- When testing electric vehicles for fuel economy, the United States EPA uses a standard of 115,000 BTU of energy per gallon (US) of gasoline, which converts to 33.7 kWh.
- The Block diagram emanating from the ‘BattPwr’ input port shows the steps to convert the Battery Energy used for driving the vehicle into its equivalent Fuel Consumption amount. This means that if the Battery had been replaced by a Gasoline engine, then for the same amount of energy produced, how much amount of fuel would have been used.
- In order to calculate the distance covered by the vehicle, the vehicle speed data is used (VehSpd input port) and the vehicle speed data is integrated w.r.t. the Simulation time to get the net distance covered by the vehicle.
- The net fuel consumption amount (both from the Battery energy(converted to equivalent Fuel consumption amount) and the conventional I.C. engine) is then added and converted to gallons. This data signal is then used to divide the data signal which represents the distance covered by the vehicle (in miles) to get the Miles/Gallon data.
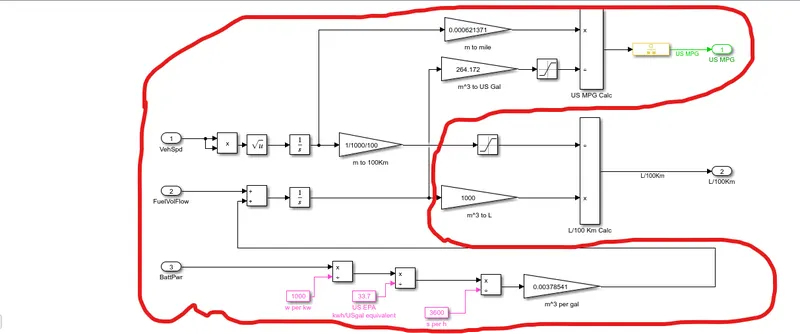
Block diagram showing the sequence of calculations for getting the miles/gallon value(s) from the Vehicle Speed, Battery Power and Vol. of Fuel Flow Data
The factors considered for modelling fuel flow are as follows:
- Fuel mass flow Rate: For the given model, the fuel mass flow rate to the SI Engine of the model depends on the throttle input by the driver.
- Air-Fuel Ratio: For optimum and efficient power delivery, it is necessary to take into account the right balance of the constituents of the air-fuel mixture which is fed to the SI engine. The parameter which takes care of this is the Air-Fuel Ratio. The air-fuel ratio (AFR) impacts three-way-catalyst (TWC) conversion efficiency, torque production, and combustion temperature. The SI engine controller is used to manage AFR by commanding injector pulse-width from a desired relative AFR. The relative AFR, λcmd , is the ratio between the commanded AFR and the stoichiometric AFR of the fuel.
A closed loop control is used to implement a period-based method to control the average AFR at a value within the catalyst window for maximum conversion efficiency. Period-based AFR control is independent of the transport delay across the engine from the fuel injection point to the sensor measurement point.
- Simulation Time: The time period for which the fuel (or the air-fuel mixture) is fed into the SI engine depends on the Simulation time set by the user for running/simulating the model. The mass flow rate of the fuel multiplied by the time for which the fuel is injected into the engine gives the mass of the fuel used for power delivery from the engine.
Solution to Objective 3:
The link for the model used for this objective: https://in.mathworks.com/help/autoblks/ug/explore-the-hybrid-electric-vehicle-multimode-reference-application.html
On opening the model in Simulink, the following changes were made to the model:
- The Drive Cycle is changed from FTP75 to Wide Open Throttle (WOT).
- The following parameters were put after changing the Drive Cycle:
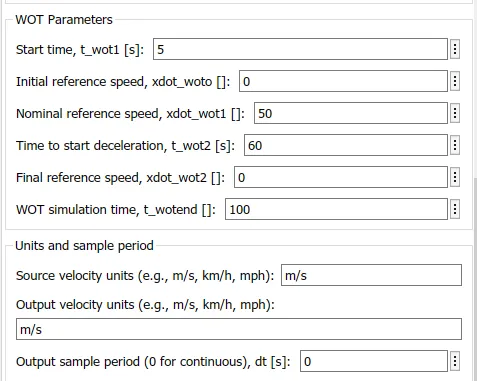
- After running/simulating the model, the plots for Drive Cycle Velocity, Actual Velocity, Engine Speed, Motor Speed, Generator Speed, Engine Torque, Motor Torque, Generator Torque, Battery Current, Battery SOC(State of Charge) and US Fuel Economy MPG w.r.t. time are analysed:
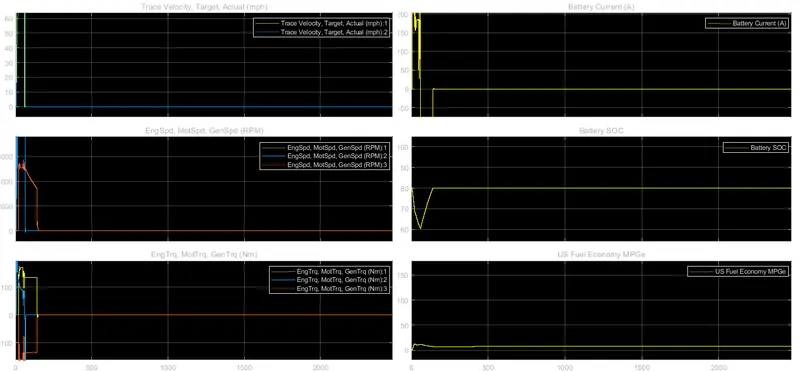
Output Paramter Plots for WOT Drive Cycle with Grade=0 & Wind Velocity=0
- As can be seen from the plot, since the Grade and Wind Velocity is set to 0, the actual velocity aligns with the Drive Cycle Velocity. Hence the actual velocity achieves the desired actual velocity.
- But on changing the Grade and wind_x(represents Wind Velocity) parameters in the Environment Block/subsystem from 0 and 0 respectively to 3 and 4 respectively, and running/simulating the model, the following plots were obtained from the ‘Performance and FE Scope’:
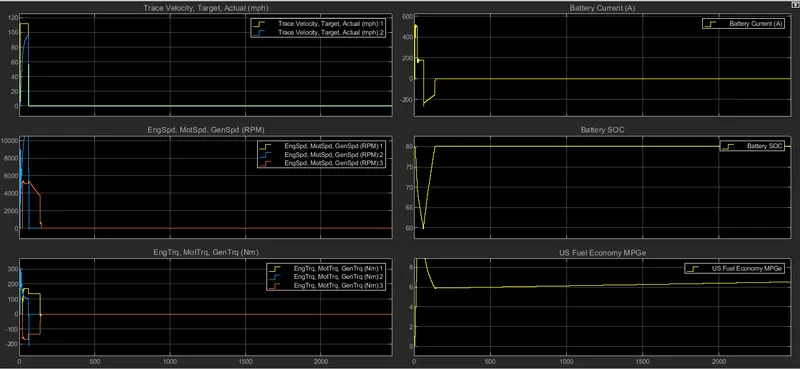
Output Paramater Plots for WOT Drive Cycle with Wind Velocity=4 and Grade=3
- On close analysis, it can be said that the actual velocity fails to keep up with the Drive Cycle Velocity initially on starting the vehicle but as time passes, the actual velocity aligns with the Drive Cycle Velocity.
- The initial jerk of the vehicle after just starting the vehicle is very high and requires a huge power to start the car from rest and accelerate. This initial huge power for the vehicle is provided by the motor as can be seen from the sudden rise in the Motor Torque in the same time frame. The Motor comes into the frame to help the vehicle achieve the required Drive Cycle Velocity.
- When the velocity of the car is constant, the current from the Battery of the vehicle also remains constant.
- When the car is accelerating, the current expenditure from the Battery is also increasing as the Battery needs to pump more power to help the car accelerate.
- During deceleration, the current expenditure from the Battery of the car becomes negative. This is due to the fact that now the Generator connecting the wheels of the vehicle and the Battery of the vehicle jumps into the frame and recharges the Battery of the vehicle using the energy generated from the Braking action of the vehicle(in form of heat/friction) which on normal cases gets lost to the environment. This negative expenditure of the current in the plot indicates recharging of the Battery due to Regenerative action of the Brakes. The generator can be an exclusive one only installed for the sole purpose of Regenerative action or the motor can act as a generator.
- The SOC (State of Charge) of the Battery keeps on decreasing until the Regenerative action of Brakes kicks in.
- The Generator jumps into action of recharging the Battery whenever the vehicle decelerates and the SOC drops below 70%.
- The motor torque is high initially due sudden acceleration part (jerk) to get the vehicle from the state of rest to motion. After that the engine jumps into the frame to provide power to the vehicle.
- As can be seen from the 2 cases of different Grade and Wind Velocity, more the Wind Velocity and Grade, more is the power demanded by the vehicle to keep up with the Drive Cycle Velocity.
Solution to Objective 4:
Reference Model used for analysing Electric Vehicle: https://in.mathworks.com/help/autoblks/ug/explore-the-electric-vehicle-reference-application.html
Reference model for analysing Hybrid Electric Vehicle: https://in.mathworks.com/help/autoblks/ug/explore-the-hybrid-electric-vehicle-multimode-reference-application.html#:~:text=Explore%20the%20Hybrid%20Electric%20Vehicle%20Multimode%20Reference%20Application,%20%20%E2%9C%93%20%203%20more%20rows%20
The above 2 models for Hybrid Electric Vehicle and Electric Vehicle have been taken as reference for this comparison.
The parameters set for the Electric Vehicle and the Hybrid Electric Vehicle are as follows:
WOT Drive Cycle Parameters set for Hybrid ELectric Vehicle(HEV)
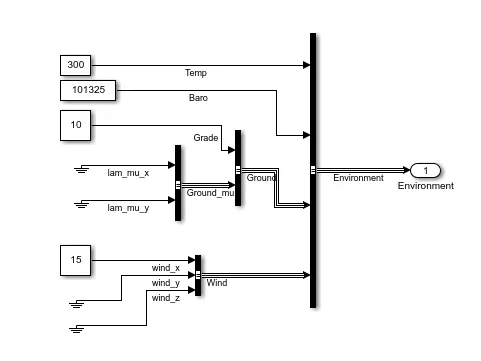
Environment Parameters set for HEV with WOT Drive Cycle
WOT Drive Cycle Parameters set for ELectric Vehicle(EV)
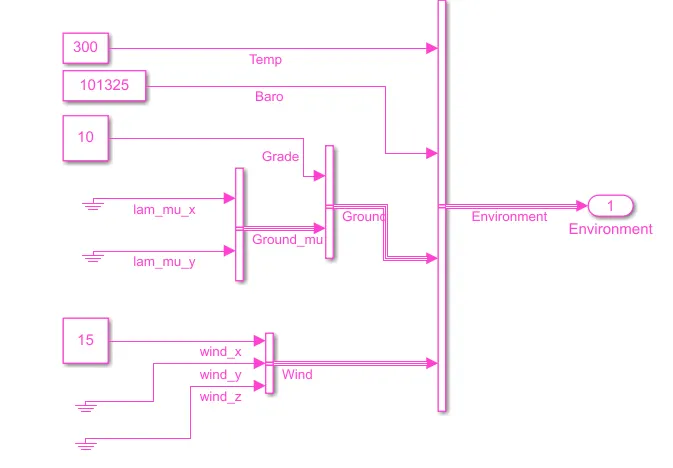
Environment Parameters set for EV with WOT Drive Cycle
On running the simulation for both the models and analysing the plots from the ‘Performance and FE Scope’ blocks of the Visualization Sub-model/Subsystem Block in the main window, the following can be concluded:
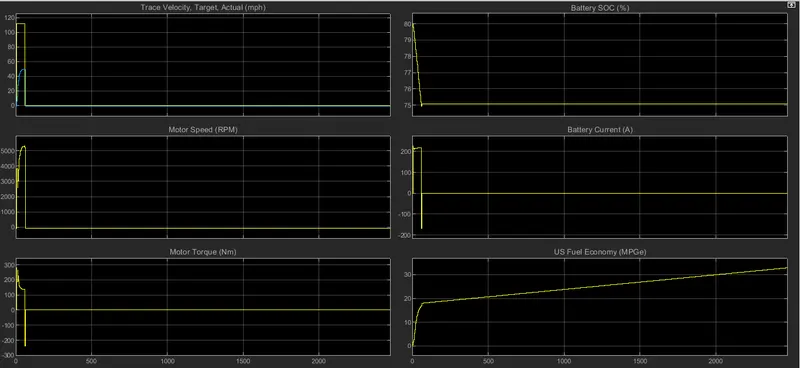
Output Parameter Plots for Electric Vehicle with WOT Drive Cycle with Grade & Wind Velocity set to 10 & 15 respectively
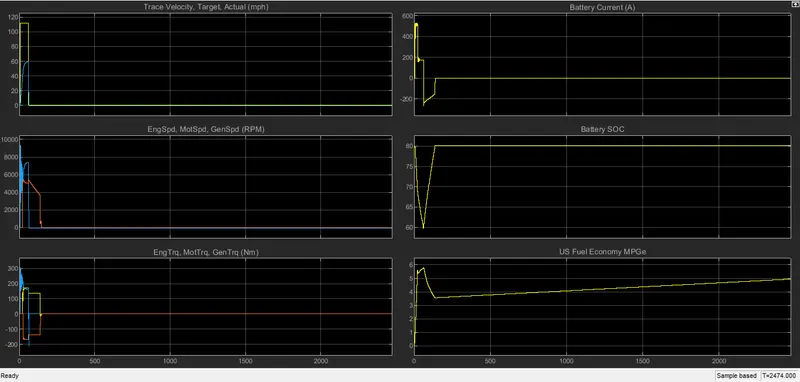
Output Parameter Plots for Hybrid Electric Vehicle with WOT Drive Cycle with Grade & Wind Velocity set to 10 & 15 respectively
- It can be seen that at the initial stages (just after the start of the vehicle), both the HEV and EV are unable to reach the desired level of Drive Cycle Velocity. This is due to the fact that at the initial stages and at the start of the vehicle, a huge amount of power is required to provide the initial jerk required by the vehicle to change it’s state from rest to motion. The Energy sources for both the vehicles are unables to provide the desired level of power to match upto the Drive Cycle Velocity.
- However, it can be seen that the HEV performs much better in trying to match upto the Desired Level of Drive Cycle compared to the pure Electric Vehicle. This is due to the fact that Battery alone has lower power capacity compared to the Engine-motor system in HEV which provides the power to the vehicle in the initial stages.
- The Battery current drops significantly more in EV compared to pure HEV. This is due to the fact that the only source of power in Electric Vehicle is the Battery and the in HEV, there are 2 sources of power-> The engine and the Battery. The Battery in HEV is only used when the power requirement by the vehicle is somewhat low. For a high power requirement, the engine-motor system jumps in to compensate for the high power requirement. This can be seen that at the initial start of the vehicle, where the vehicle needs a high jerk, the battery is unable to provide the power and hence the engine jumps in to provide the required power. Hence, the drop in Battery current in HEV is significantly low compared to that of HEV.
- Due to poorer attempt in matching upto the Drive Cycle Velocity, the power expenditure in Electric Vehicle is lower compared to that of HEV.This can be attributed to the fact that the SOC(State of Charge) for EV at max. only drops to 75% for Electric Vehicle while the SOC for HEV drops to 60% at max..
- The regenerative action in the Electric Vehicle works for a shorter period compared to the regenerative action in the HEV. The Regenerative Braking action is more profound in the HEV.
- Since the regenerative action is more profound in HEV, there is good SOC improvement in HEV while for EV, there is no improvement in SOC.
- The Fuel Economy of the EV is much better than that of HEV. This is because the Battery-motor system of EV is more efficient compared to Battery-motor-Engine System of HEV.
REFERENCES:
- https://www.mathworks.com/help/autoblks/ug/internal-combustion-mapped-and-core-engine-models.html
- https://energyeducation.ca/encyclopedia/Miles_per_gallon_gasoline_equivalentre
- https://in.mathworks.com/help/autoblks/ug/explore-the-electric-vehicle-reference-application.html
- https://in.mathworks.com/help/autoblks/ug/explore-the-hybrid-electric-vehicle-p2-reference-application.html