WOT Condition Part-2
AIM: The aim of this challenge is to understand the basics of the powertrain blockset in MATLAB.
What is a Powertrain blockset?
A powertrain is an assembly of every component that pushes your vehicle forward. Your car's powertrain creates power from the engine and delivers it to the wheels on the ground. Powertrain Blockset provides fully assembled reference application models of automotive powertrains, including gasoline, diesel, hybrid, and electric systems. It includes a component library for simulating engine subsystems, transmission assemblies, traction motors, battery packs, and controller models.
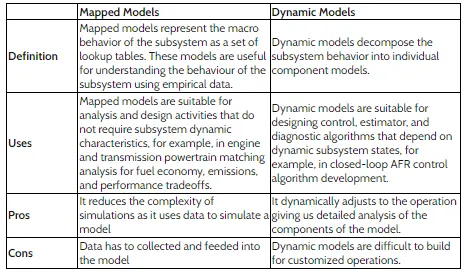
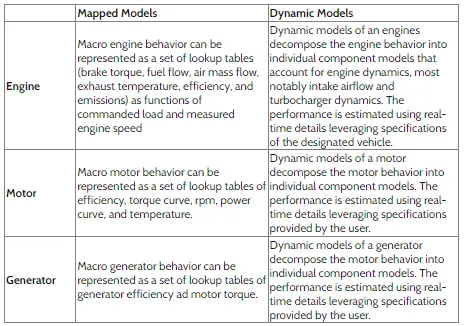
1. What is the difference between the mapped and dynamic models of engine, motor, and generator? How can you change the model type?
These are two types of models for various subsystems such as Engine, Motor, and Generator.
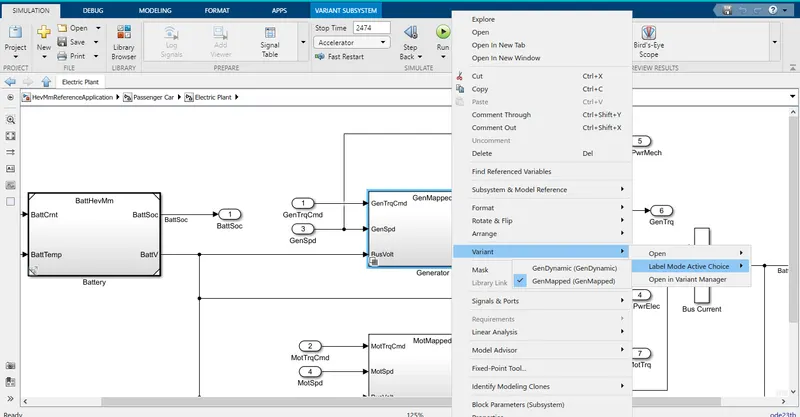
Steps to change the model type:
- Right-click on the model.
- Navigate to Variant.
- Navigate to Label mode active choice.
- Select between the mapped or dynamic model.
2. How does the model calculate miles per gallon? Which factors are considered to model fuel flow?
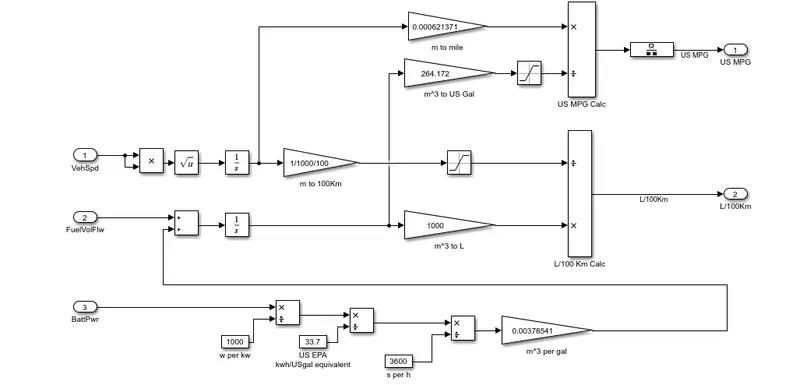
The three variables that are taken as inputs to calculate miles per gallon are:
- Vehicle Speed(from drive cycle)
- Fuel Volume Flow(from engine output)
- Battery(from the state of charge output)
The vehicle speed is used to calculate the total distance of the drive cycle, by integrating the root mean square over the total time.
If the uses fuel(eg., conventional vehicles, HEVs), the instantaneous fuel flow volume is integrated over the travel time to get the accumulated fuel volume flow. If a vehicle uses battery energy(eg., EVs, HEVs), the instantaneous battery energy is converted to the equivalent instantaneous fuel flow rate by using the standard conversion constants.
If the vehicle uses both sources of power,
`"Total instantaneous fuel volume flow" = "Fuel volume flow from engine" + "Equivalent fuel volume flow from battery"`
Thus, we can calculate MPG(mile per gallon),
`MPG="Distance covered"/("Total Instantaneous fuel volume flow")`
The diagram below depicts the performance calculation block for a standard HEV utilizing all three above variables to calculate litres per 100km.
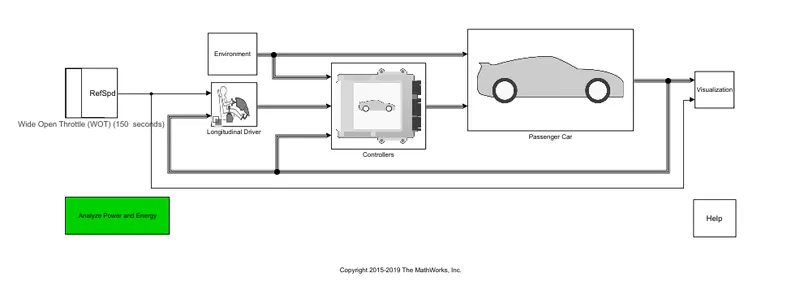
3. Run the HEV ReferenceApplication with WOT drive cycle. Change the grade and wind velocity in the environment block.
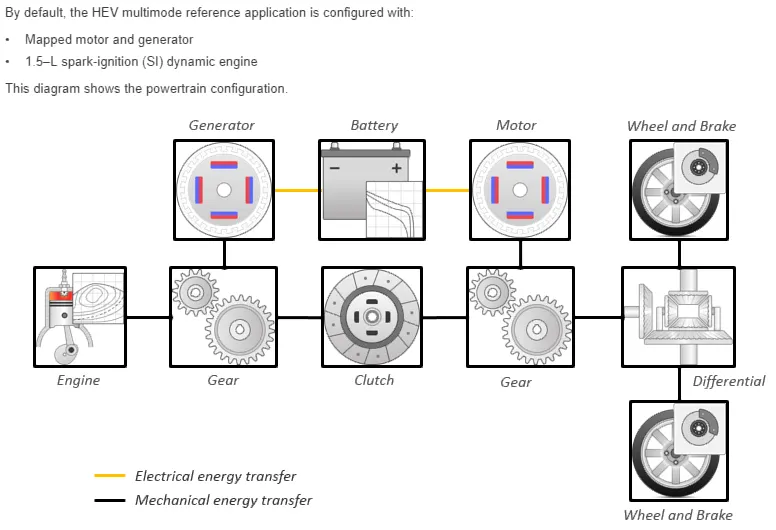
The pre-built HEV Multimode Reference application is loaded from the MATLAB help window,
SIMULINK model:
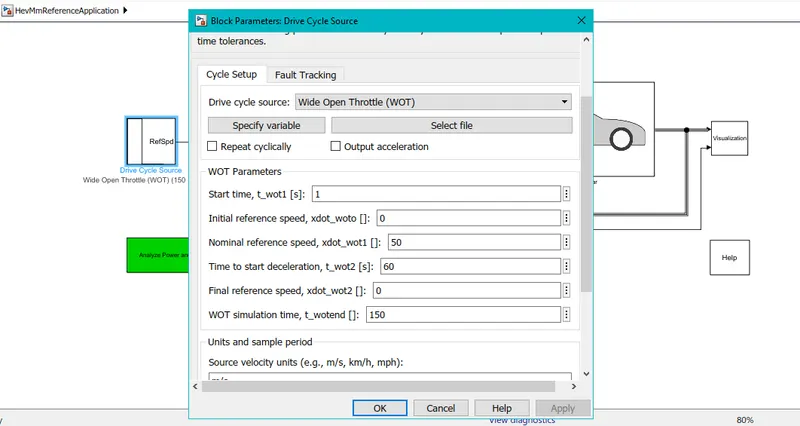
Case 1:
Case 2: The wind and grade parameters changed to 23m/s and 12 degrees respectively.
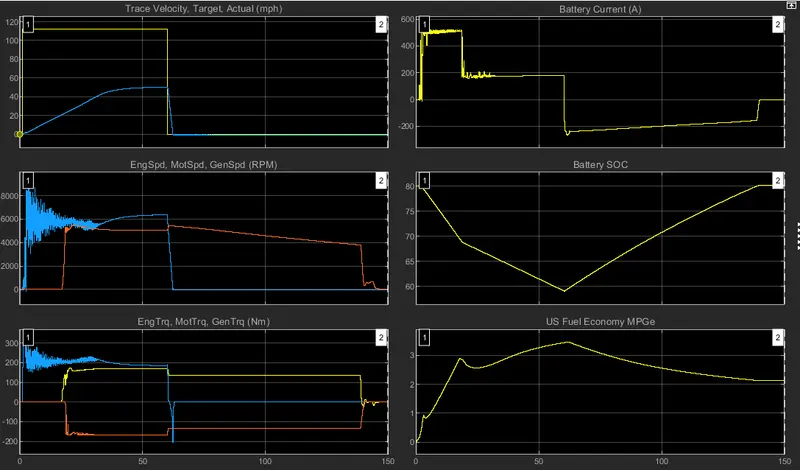
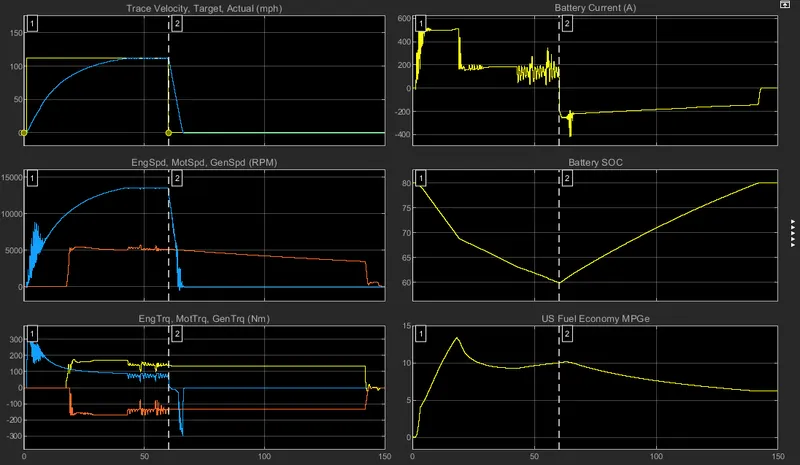
Plot 1(Trace Velocity, target, actual velocity):
This plot visualizes the velocity vs time.
Case 1: The vehicle reaches the desired velocity after few seconds of acceleration.
Case 2: The vehicle doesn't reach the desired velocity due to gradability and resistance force due to wind.
Plot 2(Engine speed, Motor speed, Generator speed):
This plot visualizes the Engine speed and motor speed over the drive cycle.
Case 1: In this case, the motor initiates the initial acceleration and is capable to produce enough power to reach the maximum desired velocity. We then see that the motor still runs at some speed along with the engine to maintain the constant velocity. It is seen that after attaining desired speed, the engine still runs at some speed, the power generated by the engine inturn uns the generator to maintain certain SOC in the battery prescribed by the control strategy.
Case 2: In this case, the motor initiates the initial acceleration but is not capable to produce enough propulsion power to reach the desired maximum velocity, thus the engine contributes to the propulsion effort. However, it is seen that, the combined effort is not enough to attain desired speed. The rest of the ideology remains the same.
Plot 3(Engine torque, motor torque, and generator torque):
This plot visualizes the engine torque, motor torque, and generator torque over the drive cycle.
Case 1: As the specification is for WOT, the engine runs at maximum torque, however, the power distribution stabilizes the power between the motor and the engine as the vehicle reaches the desired velocity. The negative value for the generator indicates the engine torque is used to charge the battery as well as during the propulsion time.
Case 2: In this case, we do not see the mutual stabilization between the motor and the engine as the desired velocity is not met. Rest of the ideology remains the same.
Plot 4(Battery current):
This plot visualizes amperage drawn for the drive cycle.
Case 1: As the specification is for WOT, the powertrain draws maximum current from the battery, and as the demand is met it stabilizes. Once the engine is switched on, the current drawn from the battery minimizes substantiating the mutual power between the engine and the motor. A negative battery current value indicates the regenerative braking and charging by the engine.
Case 2: We see a similar ideology as in case 1. In this case maximum current discharge remains long unlike case 1, because the maximum desired velocity is not fulfilled.
Plot 5(SOC):
This plot visualizes the State-Of-Charge of the battery over the drive cycle.
In both cases, we see that initially, the battery is at 80%, at some point in the drive cycle the SOC of the battery falls to 60%. These limits are preset in the control strategy. The battery is then charged to 80% by the engine or regenerative braking.
Plot 6(Fuel Economy):
This plot visualizes the fuel economy(mile per gallon) over the drive cycle.
In both cases, it is seen that according to the environmental conditions, the fuel economy changes.
4. Keeping all other parameters the same, compare the simulated results of hybrid and pure electric powertrains.
a) Hybrid Electric Powertrain(multimode):
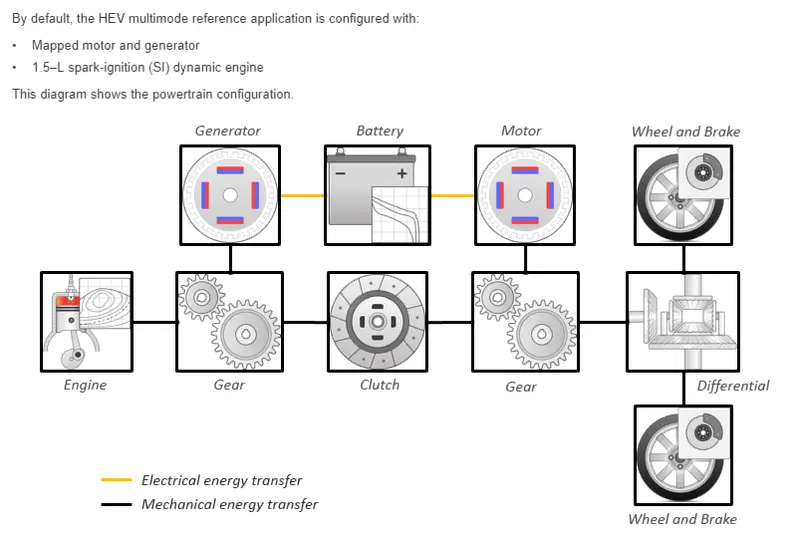
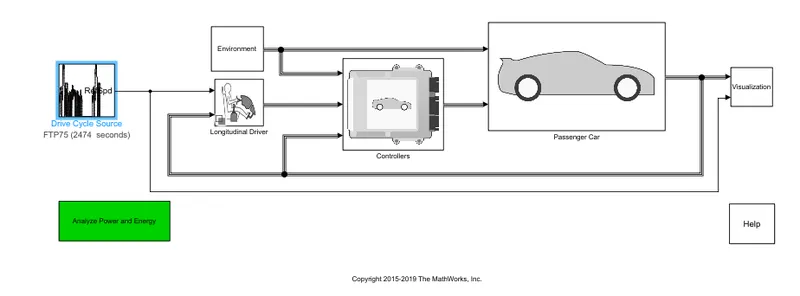
SIMULINK model:
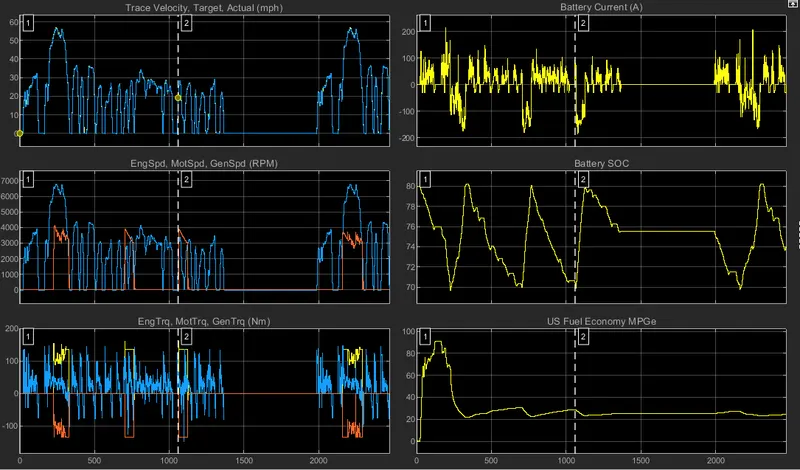
Simulation results:
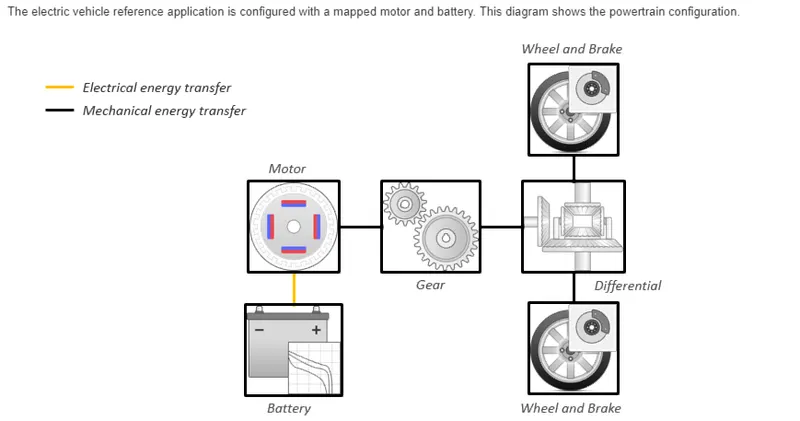
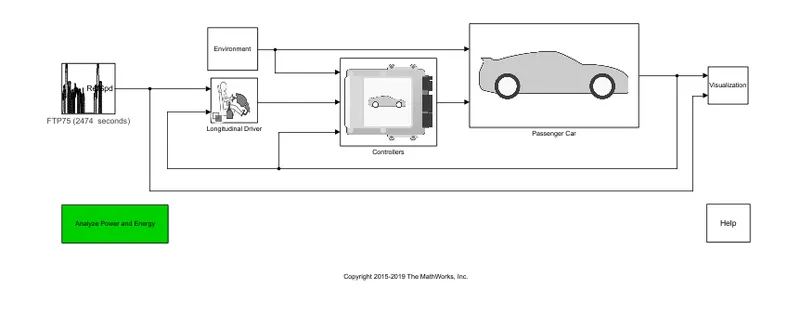
b) Full electric vehicle:
SIMULINK model:
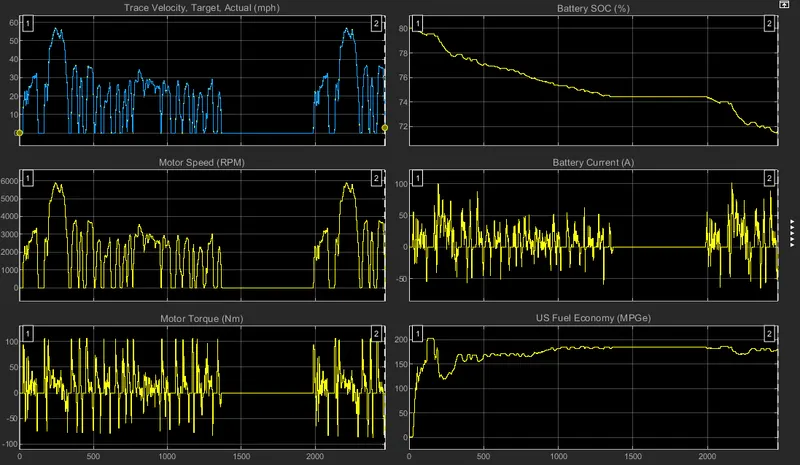
Simulation results:
Analysis:
As we are comparing the Hybrid Electric Vehicle and pure Electric Vehicle, it is important to have the same drive cycle(FTP75) and also all the parameters same.
Considering fuel economy, the pure Electric Vehicle is the clear winner. As HEV runs with a nickel-metal hydride battery and EV runs with a Lithium-ion battery which has a superior energy density and lower discharge rate. But in terms of trip range, HEV holds the medal because it has an IC engine that maintains the SOC of the battery and can run over long distances, unlike pure Electric vehicles which perish once the battery is discharged.