Week-4 Challenge WOT Condition Part-2
1 ) AIM - Finding the difference between mapped and dynamic model of engine, motor and generator.
Powertrain blockset provides access to reference applications such as gasoline , diesel, hybrid and electric vehicle systems.
For modelling a powertrain we can select a reference application based on the powertrain type.
There are two types of combustion engine models in powertrain blockset.
1 ) Mapped
2 ) Dynamic
1) Mapped Model
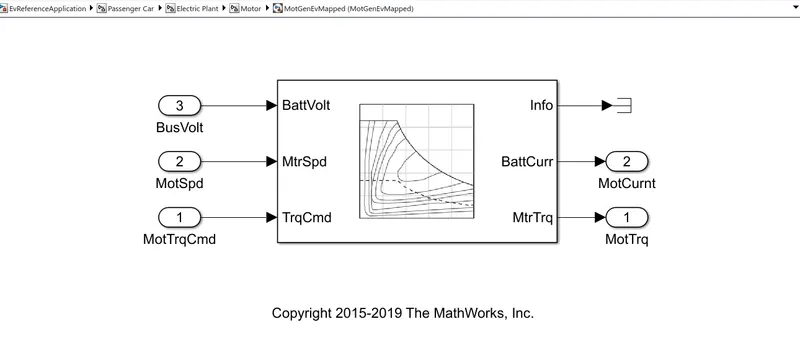
In Mapped models the data is loaded from lookup tables. In this we have to implement electrical Torque range with a torque speed Envelope or maximum motor power and torque.
In this we have to specify electrical losses.
Using mapped model simulation will done in much less time.
It does not run by real time parameters therefore the accuracy is not that high.
2) Dynamic Model
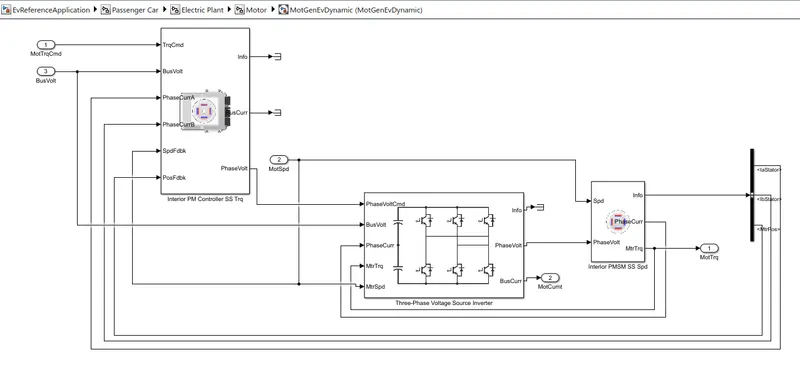
If we want to run the simulation with actual model then we select dynamic model option.
Dynamic model represents actual components.
In dynamic model we can work on individual components of model.
The performance is estimated using real-time details.
The accuracy of this model is very high as it considers the real output from all the components of model.
Therefore time required in simulation of dynamic model is much more than mapped model.
How can we change model type?
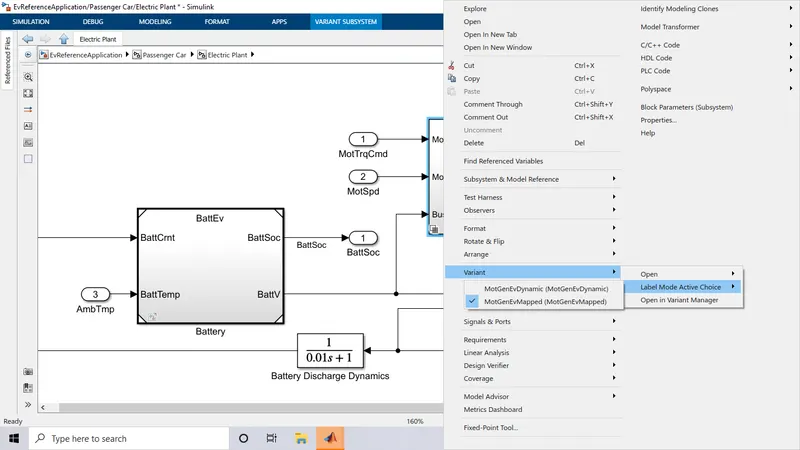
Select any reference application in powertrain blockSet.
After opening the reference application in simulink click on passenger block, then electric plant.
Then right click on motor block, select variant, then label mode active choice.
By clicking on label mode active choice, we can now select either MotGenEV Mapped or MotGenEV Dynamic.
2 ) AIM - Understanding the process of calculating miles per gallon.
Miles per gallon MPG -
Miles per gallon is a fuel economy rating determined by distance travelled by car on a gallon of petrol or diesel for engine power car.
For an electric vehicle MPG tells us that the energy which is equivalent that of engine powered car to propel, the car through a distance.
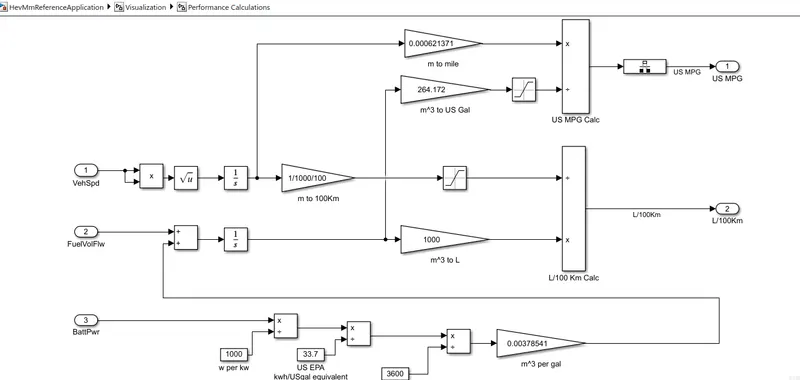
This model takes the input of the vehicle speed, fuel flow and battery power to calculate the fuel consumption with equivalent battery power consumption.
Using those data miles per gallon is calculated.
Vehicle speed is a important factor while considering the fuel consumption.
Distance is calculated by integrating speed with respect to time.
Then the fuel flow is expressed as the mass flow rate that is the amount of fuel at each moment in Kg/sec.
Then integrating this will result in the the mass of the fuel and then we convert it to the volume and multiply by 1000 to get it in Liters.
The input of battery power is in watts and it is converted to Kilowatt by dividing with 1000.
Then convert power in to energy kilowatt hour.
Then converting the energy from kilowatt hour to equivalent energy in US gallon of automative gasoline by dividing it with 33.7.
Get the energy of equivalent us gallon per seconds by dividing with 3600.
Then multiplying with 0.00378541 we convert the US gallons per Seconds to the volume of the fuel flow in meter cube per second.
And then will be multiplied by 739 which is California phase 2 gasoline density which gives the result asecondd mass flow rate kg per second.
Then to estimate my per gallon the battery energy equivalent in KG per second is given as an input for the fuel flow parameter to find the equivalent us gallons energy.
The distance obtained from vehicle field in metres if converted into miles by multiplying with 0.000621371.
By multiplying with 264.172 the input from fuel flow are converted into equivalent us gallons.
# Factors considered to model fuel flow -
1) Fuel Economy
2) Fuel Consumption
1) Fuel economy -
The fuel economy of an automobile refers to the number of miles a car can travel using a specific amount of fuel.
It is measured in miles per gallon (MPG) 0R miles per gallon gasoline equivalent (MPGe) for electric vehicles.
Factors considered in fuel economy-
1) Vehicle speed
2) Engine Speed
3) Motor Torque
2) Fuel Consumption -
Fuel consumption is the is the inverse of fuel economy.
Fuel consumption measures the amount of fuel a car consumes to a specific distance.
3 ) AIM - Running the HEV ReferenceApplication with WOT drive cycle. Changing the grade and wind velocity in the environment block. Commenting on the results.
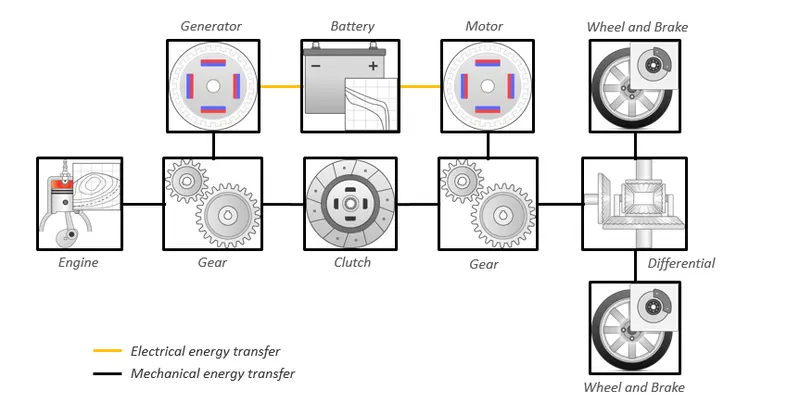
Architecture of Hybrid electric vehicle -
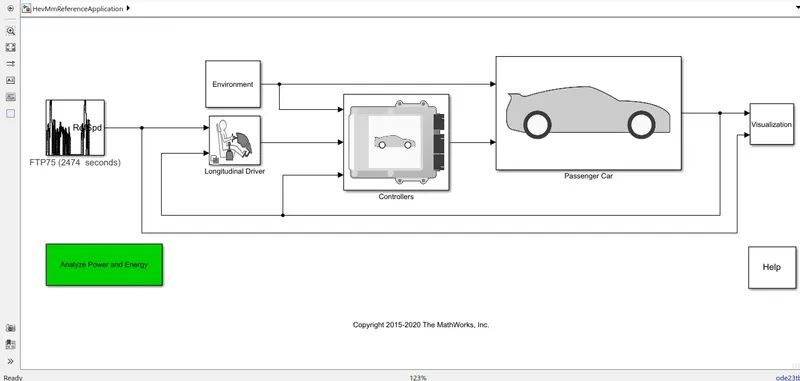
Simulink model -
In the drive cycle source option , wide open throttle drive cycle is selected.
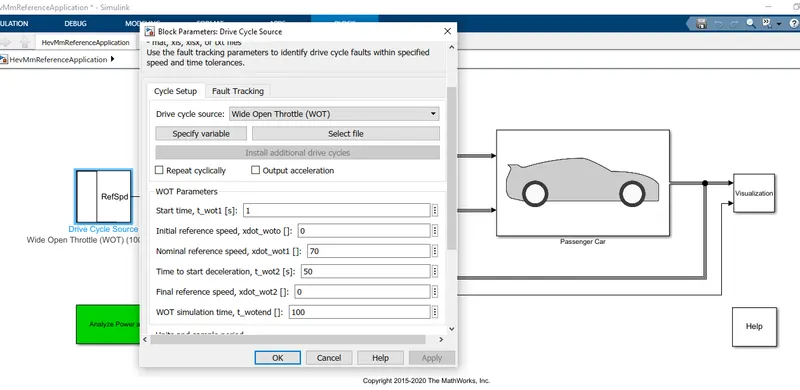
The top speed of the cycle is 70 m/s.
Time to start deceleration is 50 seconds.
The total cycle time is 100 seconds.
In the Enviornment Block Grade & wind velocity is selected,
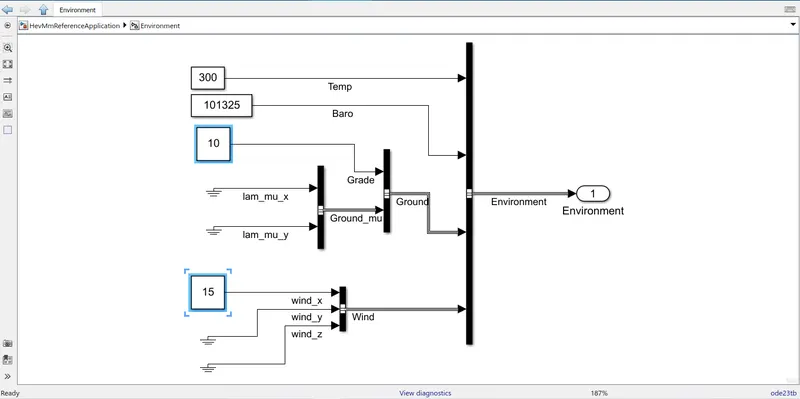
The Grade angle is 10°
The Wind velocity is 15 m/s.
After Running the Simulation for 100 seconds.
RESULT -
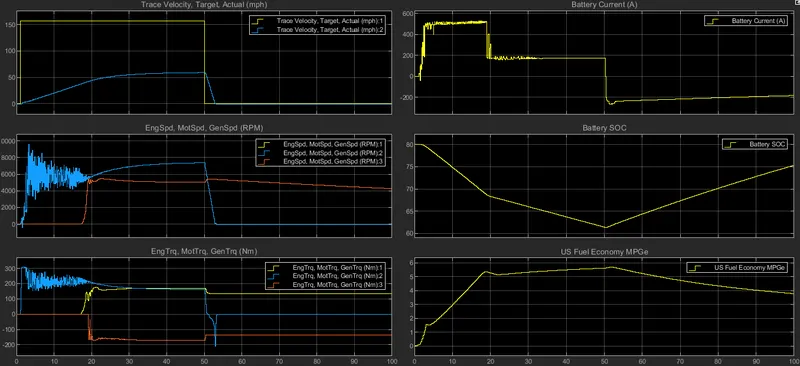
Plot 1 -
Plot 1 shows the Trace velocity and Actual velocity in m/h.
Trace velocity is 156 m/h.
Actual velocity is 59 m/h.
Due to some additional forces the top speed of 70 per hour cannot be achieved therefore vehicle can only run up to 59 m/h.
The acceleration time to reach top speed of 59 m/h is 48.3 seconds.
The deceleration time from 59 to 0 m/h is 3 seconds.
Plot 2 -
Plot 2 shows the engine speed, motor speed, generator speed.
Peak Engine Speed is 5500 RPM.
Motor speed is 5000 RPM.
Peak generator speed is 9600 RPM.
Plot 3 -
Plot 3 shows Torque characteristics.
Peak engine Torque is 169 Nm.
Peak motor Torque is 175 Nm.
Peak generator Torque is 307 Nm.
Plot 4 -
Plot 4 shows the Battery current (A) .
The peak current discharge from battery is 528 Ampere.
The peak current charging to the batteries is 265 Ampere.
Plot 5 -
Plot shows the battery state of charge (SOC).
The state of charge decreased from 80 % to 61% of charge.
Plot 6 -
Plot 6 shows US Economy as miles per gallon
The distance covered by a HEV with WOT drive cycle is 6 miles.
With increase in Grade and Wind resistance, speed decreases, to overcome these required power increases.
4 ) AIM - Keeping all other parameters same, compare the simulated results of hybrid and pure electric powertrains.
In this comparison we kept all the parameters default.
The default drive cycle is FTP 75 drive cycle for 2474 seconds for both electric vehicle and Hybrid electric vehicle simulations.
Hybrid electric vehicle -
Hybrid electric vehicle is a hybrid vehicle that is powered by an internal combustion engine in combination with electric motor that uses energy stored in batteries.
This hybrid combination is made to achieve either better economy or better performance than conventional vehicle.
Electric vehicle -
An electric vehicle is one that operates on an electric motor instead of an internal combustion engine and have a batteries instead of a fuel tank.
Compared to an IC engine battery-powered electric vehicles have fewer moving parts that need maintenance.
EV's create very little noise.
RESULTS -
The top speed achieved by electric vehicle is less compared with Hybrid electric vehicle keeping the same environmental and drive cycle conditions.
The torque produced by Hybrid electric vehicle is higher than the electric vehicle.
The discharging capacity and the rate of charging are higher in the pure electric vehicle to the Hybrid electric vehicle.
Compared to HEV the overall efficiency of EV is higher.
EV Requires low maintenance compared to HEV.
EV produces zero emissions.
EV has low running cost compared to HEV.