Week-4 Challenge WOT Condition Part-2
- Q_1:What is the difference between mapped and dynamic model of engine, generator and motor? How can you change model type?
Mapped motor block: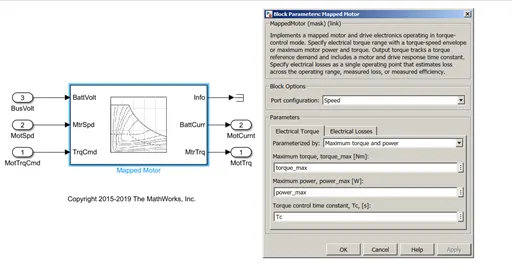
As shown in the above image of mapped motor block , the block only has lookup table values and behaviour of the block depends upon that predefined values.
Mapped blocks are the blocks which uses the lookup table to produce the output of the system for given input. Basically it consists of lookup table derived from available data. Hence Mapped blocks are faster than Dynamic model. It is less accurate as compared to dynamic model.
Dynamic model:
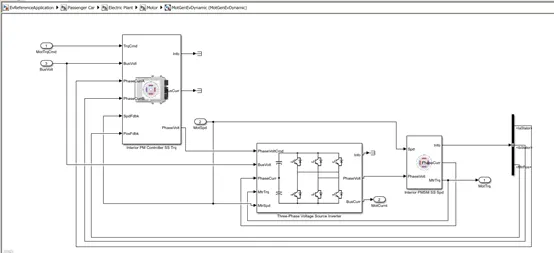
Dynamic Model blocks are the blocks which uses the real time data produced during the simulation.
It does not contain any lookup table instead of that the dynamic model block depends upon the output produced during the simulation. Since that type of block use the real time simulation values , it is slower than the mapped blocks as it involves calculation and other time consuming process.
Changing Mapped to dynamic:
To change the type of model from mapped to dynamic or reverse of it, we can take the example from the “EVReferenceApplication.slx” file.
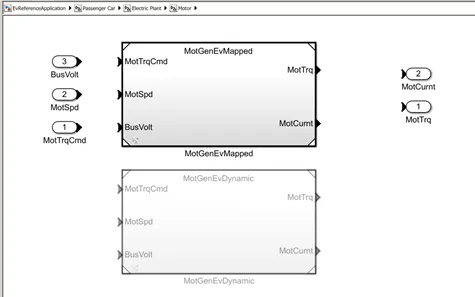
In that Passenger car ->Electric Plant -> Motor , has the Mapped model by default.
For changing the MotGenEVMapped to MotGenEVDynamic model go to
Modelling--> Design, in dropdown menu we can find Variant Manager .
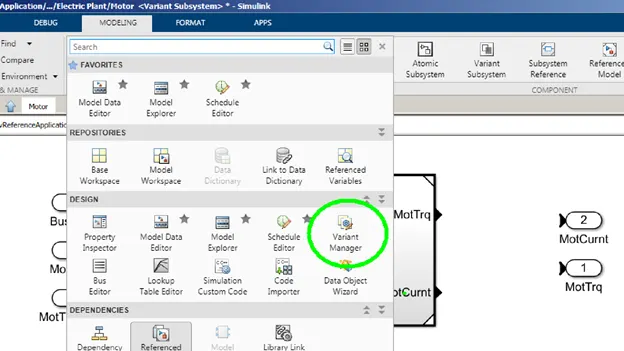
It will open the Variant manager window. Find the sub model want to change the type. In our case it is changing the MotGenEVMapped to MotGenEVDynamic.
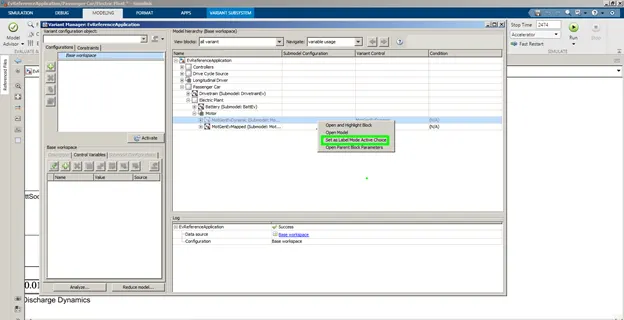
Just right click on the Model and select “Set as Label Mode active choice”. You can check by going to the subsystem, if it is changed or not.
- Q_2 How does the model calculate miles per gallon? Which factors are considered to model fuel flow?
Calculating miles/ gallon
The miles / gallon is used for checking the mileage of the vehicle.
In our case it is used for the hybrid electric vehicle consisting of the fuel consumption and the battery power consumption.
To consider the battery power consumption in mileage calculation it is need to be converted in the equivalent terms.
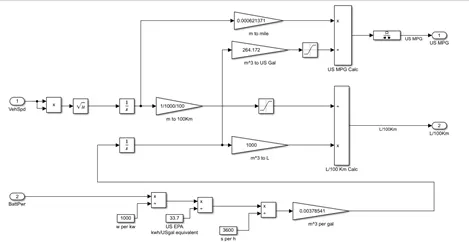
First, to Get the mileage we need the distance and the gallon that is consumed.
Battery power is converted to w to kw by dividing w by 1000.
Now that kw is converted to the US gallon/h equivalent by dividing the standard value 33.7.
That value is converted to the US gallon/ sec by dividing with 3600. Then this value is converted to the m^3 per second, which is again integrated to get the equivalent m^3.
This m^3 of fuel is converted to US gallon.
Units conversion:
33.7 kwh = 1 US gallon
1 `m^3` = 264.17 US gallon
1 m = 0.000621 miles
-------------------------------------------------------
Suppose we got x kw from the battery.
33.7 kwh = 1 US gallon
So
33.7 kw = 1 `(USgallon)/h`
x kw =?? `(US gallon)/h`
so x kw =`x/33.7` `(US gallon)/h`
now
x kw= `x/(33.7*3600)` `(US gallon)/sec`
Consider `x/(33.7*3600)` = y
so
x kw = y `(US gallon) /sec`_____(1)
Now from the relation
264.17 US gallon = 1 `m^3`
y US gallon = ? `m^3`
y US gallon =`y/ 264.17` `m^3`
from (1)
x kw = `y/264.17` `m^3/sec`
x kw = `(x/(33.7*3600) )/264.17` `m^3/sec`
This relation can be integrated to obtain `m^3`, which can be converted to the US gallon.
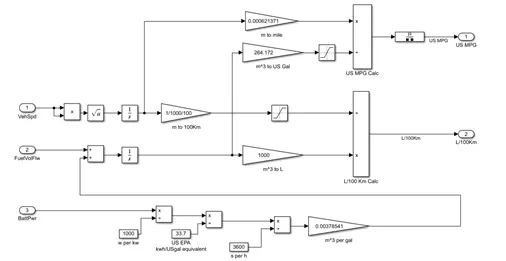
In hybrid electrical vehicle before converting to `m^3` from `m^3/sec` it is added with the fuel volume flow which is also in `m^3/sec` and then the resulting quantity is converted from `m^3/sec` to `m^3`
After that from the integration of velocity we can get the distance in the meter and further it can be converted to miles or any other unit as per requirement.
Factors considered to model fuel flow:
- Speed of vehicle
- Demanded Power demand
- Battery capacity
- Q_3:Run the HEV ReferenceApplication with WOT drive cycle. Change the grade and wind velocity in the environment block. Comment on the results.
Default case:
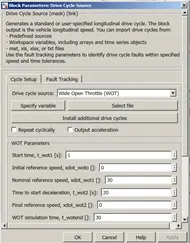
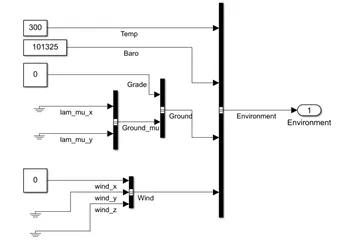
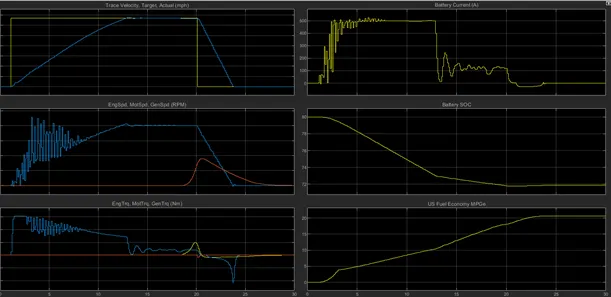
Results for default case:
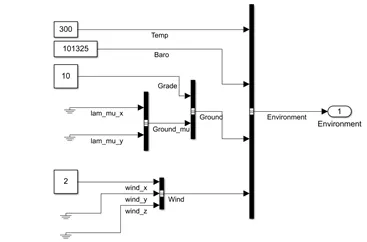
Changing grade and wind velocity to 10 degrees and 2 m/s respectively.
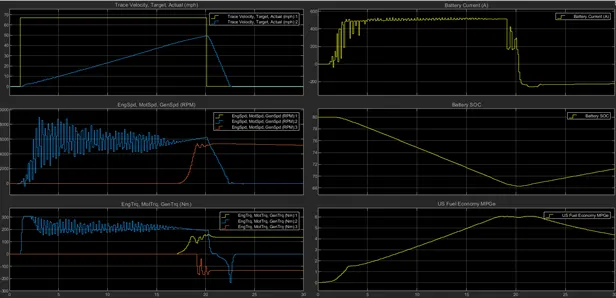
Explanation:
- On the first plot at the left the reference speed (Yellow line) and the actual speed (Blue line) are shown.
With the comparison to the previous default case the actual speed is not reaching to the reference speed till the deceleration. This is because of the limitation of battery current. The battery has provided it’s rated current and for that the motor can produce the speed according to the current provided. But in case of the default case at least it slowly reaches to the commanded speed as there is no grade and wind speed that demands more power for the vehicle
- Second plot is for the engine, motor and the generator speed.
For second case, as seen in the plot at the first only motor will contribute till the SOC of 70%.
As soon as the battery crosses the 70% of SOC the engine generator starts for providing the enough power. In that case the engine can used for the drive generator and generator will charge the battery, and also engine will support the motor. Here the engine-generator combination runs at the same speed hence the plot is the overlapped to each other.
- Third plot is nothing but toque plot for engine, motor and generator
At first only the battery is contributing for the operation till 70% of SOC. Hence there is no other graph ,other than torque from the motor in that region.
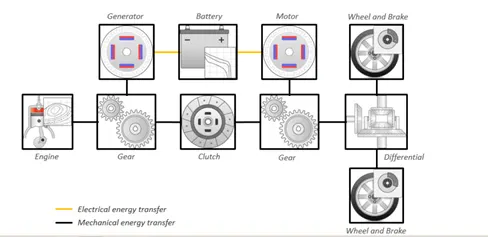
Once the battery reaches to the 70% of SOC, engine starts and generator connected to it starts charging the battery, generator is nothing but a Interior Permanent Motor (Shown in the figure) operating in the generating region. Hence the torque shown is negative in the nature.
- First plot on right is the battery current.
It helps the operation of charging and discharging. At first the motor provides maximum current as the WOT condition requires maximum speed and torque in small duration. During thr deceleration time the battery charges and hence the battery current shown is the negative in the nature, it is called regenerative breaking.
- 2nd and 3rd right plot is battery SOC indication and US fuel economy plot.
- Q_4: keeping same parameter comparing the results in Electrical vehicle and hybrid electrical vehicle.
Conditions:
The conditions are same as from the previous question so results can be comparable from the previous question.
Results for the pure electrical vehicle:
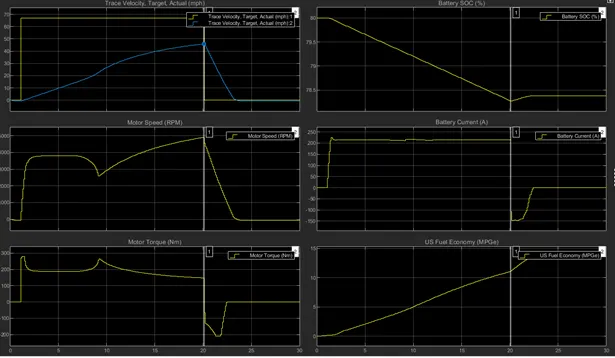
Comparison:
- Battery drains fast in HEV as compared to EV, in HEV SOC is around 68% and in EV it is around 78%.
- The achieved speed is more in the case of HEV (50 RPM) compared to EV (45 RPM) till the deceleration point.
- Speed and torque oscillation is less in the case of EV compared to HEV. EV gives smooth plots of speed and torque.