Week-4 Challenge WOT Condition Part-2
AIM 1: What is the difference between mapped and dynamic model of engine, motor and generator? How can you change model type?
| Mapped vs Dynamic Engine Model | ||
| Mapped | Dynamic | |
| Features | Data is taken from a Look-up table. This data is then configured with the parameters of the Engine | Here the results are obtained from combination of several sub-system outputs. It runs by real-time simulation. Drive cycle requirements like 'Bus Voltage', 'Current' is givenalong with the vehicle feedback so that itruns the actual simulation at that particular moment. |
| Advantage | The more deep and accurate the data from LUT, easier it is to obtain results during simulation. This model is also known as Global Based Model | The accuracy of this model is very high as it considers the real outputs from all the subsystems to generate the output. |
| Disadvantage | To get accurate simulation results, we need vast and accurate data, which can be sometimes cumbersome. | The simulation time is very high as it has so many simulations running simultaneously of various subsystems of the MGU. |
Steps to change the model type
Go To : HevMmReferenceApplication/Passenger Car/ Electric Plant/ Generator (Blocks). You can see the below,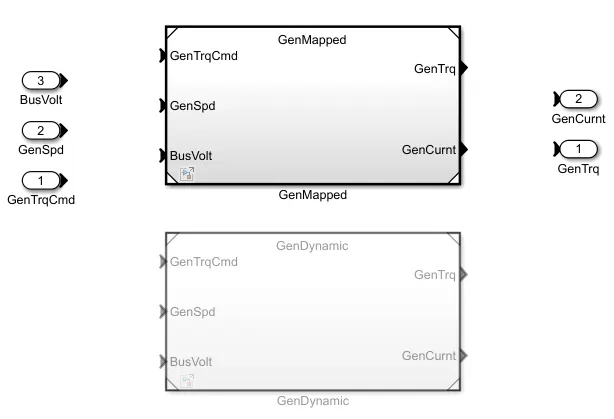
As you can see, it is currently set in Mapped mode. If we need to change, follow the steps,
Under 'MODELLING' tab above, under 'Design' option, you can find 'Variant Manager'
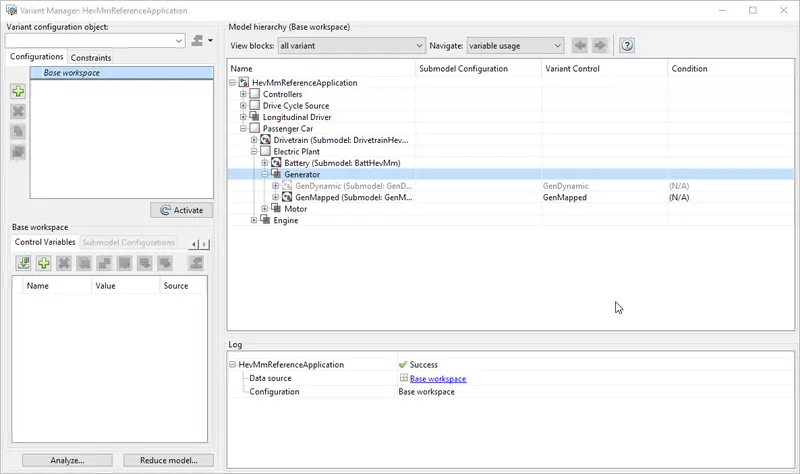
Select the Generator option and right click on the variant and choose 'Set as Label Active Choice'.
Thats all!
AIM 2: How does the model calculate miles per gallon? Which factors are considered to model fuel flow?
MPG or Miles per Gallon is a US common rating technique just like our km/L. It let's us know, how much miles does a vehicle travel on a gallon of fuel. In this case, we are trying to find the energy which is equivalent that of a engine powered car to travel through a distance. Basically comparing Electrical Energy energy required by a vehicle and finding it's equivalent Miles per Gallon.
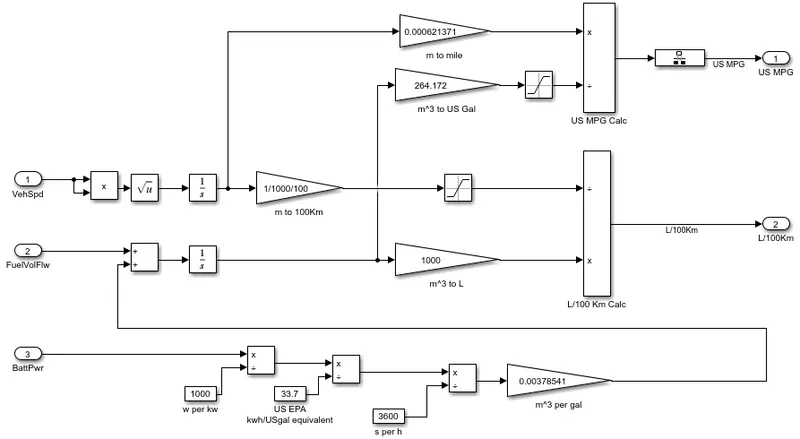
BLOCK DIAGRAM:
THEORY and CALCULATIONS:
Input 1 - Vehicle Speed: The input reference from vehicle here is its speed. This is now converted into Distance by simple integration w.r.t time. It is then converted to 100KMs for calculation purposes here.
Input 2 - Fuel Flow: This is expressed as the mass flow rate - Kg/s. Integrating this w.r.t. the time, we get the resultant fuel mass. This is then converted to the equivalent volume by multiplying by 1000 to get the result in Liters.
These both are then combined to get the result of Liters consumed per 100kms.
Input 3 - Battery Power: The input reference of Battery power in kw is first converted to watts by dividing the value by 1000. The equivalent energy value of the same can be obtained by multiplying w.r.t time. Now since our main objective here is to obtain miles per gallon, we have to convert these energy values into the one required here to fill the objective.
- First we convert this KWh into US Gallon by dividing it by 33.7.
- Then, we convert this into equivalent LIS Gallons per second, by dividing with 3600.
- Now, we multiply the value with 0.00378541 to convert US Gallons/sec into Volume of the fuel flow in (m^3/s). Thus is again multiplied by the fule density of 739 kg/m^3. This will now give us the result as mass flow rate in kg/s.
- This is now fed as input to calculate MPG.
Calculating Miles per Gallon.
- First, converting meters into miles by multiplying the value with 0.000621.
- Then input of fuel flow converted to US Gallons by multiplying with 264.172.
- Finally we get Milles per Gallon.
AIM 3: Run the HEV ReferenceApplication with WOT drive cycle. Change the grade and wind velocity in the environment block. Comment on the results
BLOCK DIAGRAM: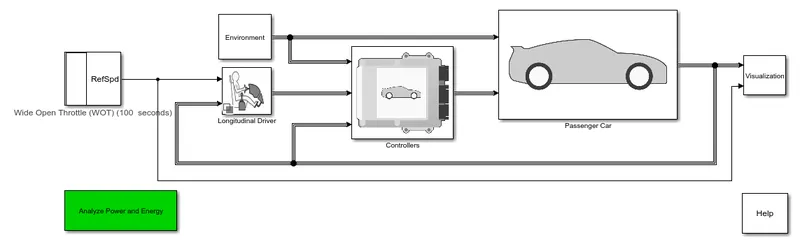
WOT Parameters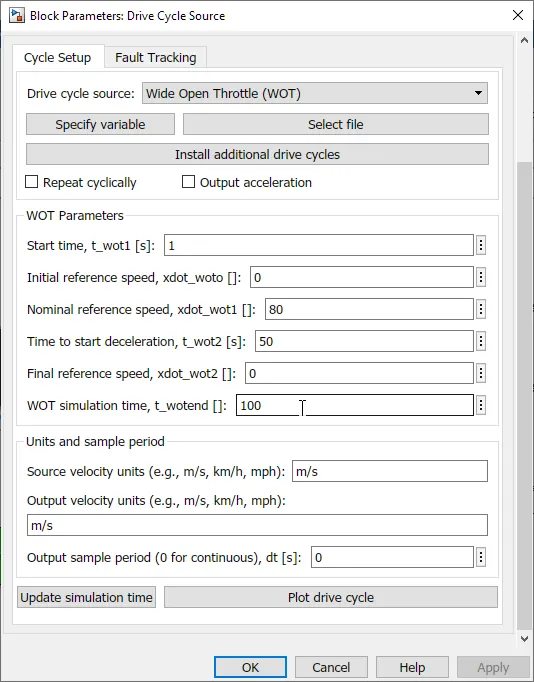
ANALYSIS OF THE SIMULATION RESULTS:
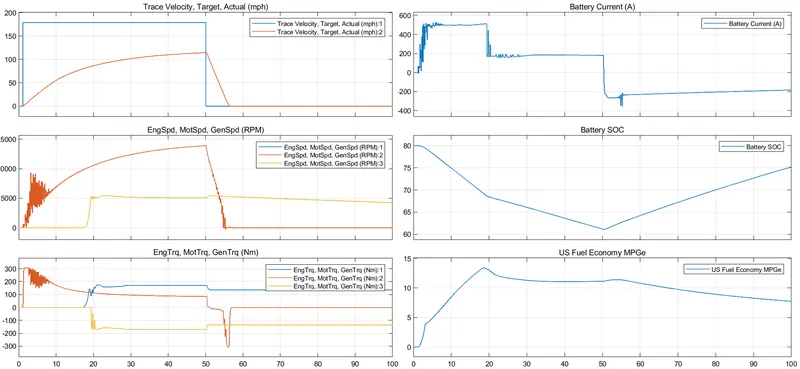
- Trace Velocity - Target vs Actual
This plot shows the velocity of the vehicle w.r.t the Drive Cycle Data. We can see, the peak velocity is around 110 mph and occurs around 50 secs. The deceleration starts at this time as set in WOT settings and the car goes back to the minimum speed in about 5-7 secs. - Engine, Motor and Generator RPM
This plot shows the speed changes in the Engine, Motor and well as generator. - Engine, Motor and Generator Torque
This plot show the torque characteristics of the componenets. As you can see during braking/ deceleration 'Regenerative Braking' is happening. - Battery Current
Very easily understandable, during acceleration, the battery discharges to feed as supply and during braking/deceleration it gets recharged back. - Battery SOC
Goes down from higher to lower value and then again goes up while it is getting recharged. - Fuel Economy as Miles per Gallons
Shows the maxium miles that the car can run per gallon of the fuel equivalent at a specified driving conditions.
OBSERVATION For changed Environmental Values.
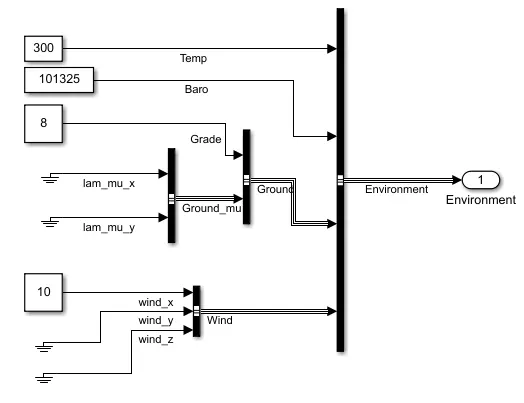
CHANGES:
Grade angle - 8 Degrees
Wind velocity - 10 m/s
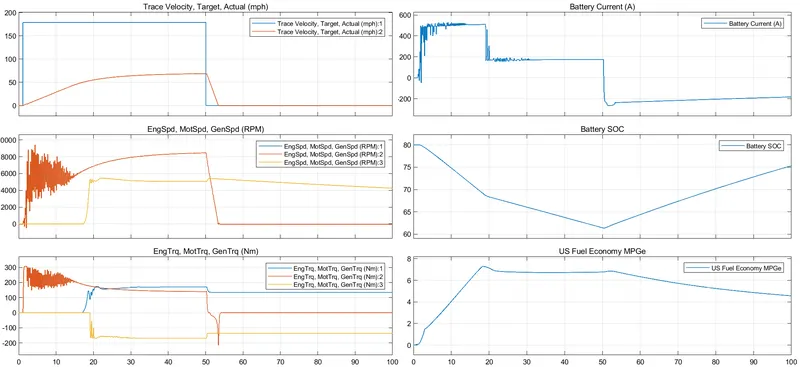
- Plot 1 : As you can see, due to more drag the acheieved velocity for same target is lower.
- Plot 2 : Here again, we can observe a slight dip compared to previous values.
- Plot 3 : Torque values are slightly higher for the whole cycle.
- Plot 6 : The milles per Gallon has been reduced due to apparent increased resisitive forces.
AIM 4: Keeping all other parameters same, compare the simulated results of hybrid and pure electric powertrains.
BLOCK DIAGRAM:
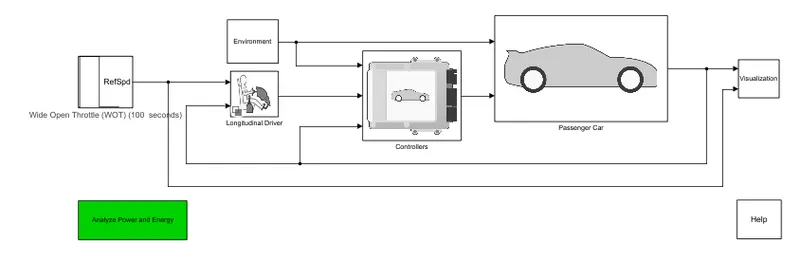
For making it simple, let us compare this EV Reference application with the same drive cycle conditions as the previous HEV question.
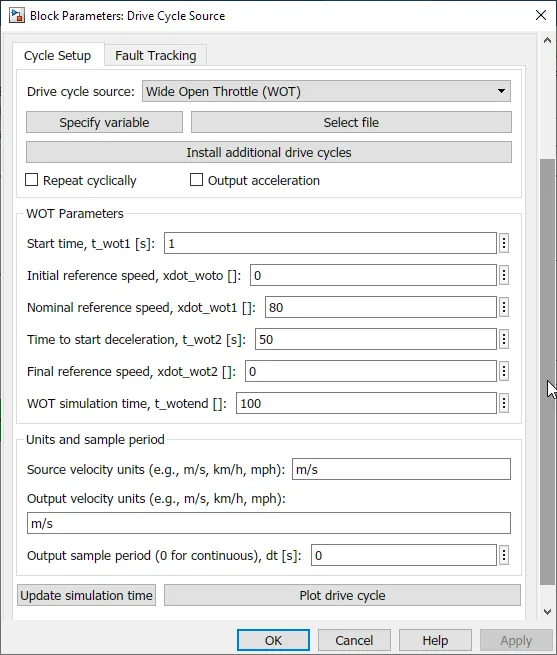
We are not adding any environmental variables and are considering case 1 like situation in the previous question.
OBSERVATION OF RESULTS: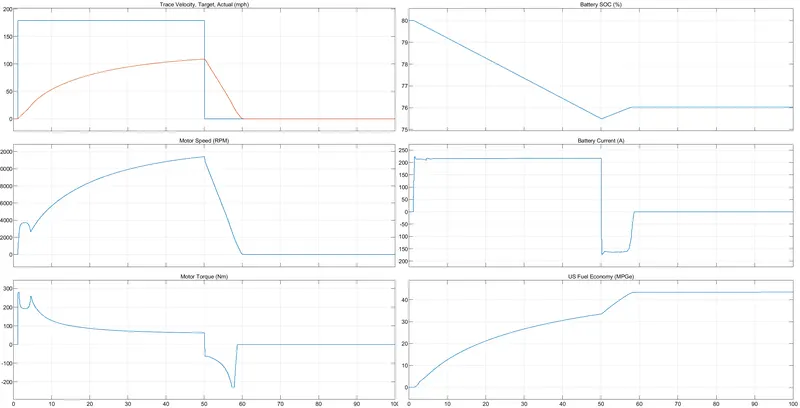
- Trace Velocity - Target vs Actual
This plot shows the velocity of the vehicle w.r.t the Drive Cycle Data. We can see, there is no much difference between HEV and EV in case of acceleration time. In both cases the initial speed is contributed by the Batteries. There is however a small difference in deceleration time, EV is slightly slower to decelerate. - Motor RPM
Here again the motor RPM will take a similar shape compared to the velocity plot. - Motor Torque
As we can see, the motor torque is highest at start and gradually it reaches a lower saturated figure, as we know from torque characterisitcs. - Battery Current
Here we can see a clear difference for a vehicle completely driven by Batteries (EV) and that of a HEV. In case of EV batteries provides required constant output during acceleration and recharges via MGU during deceleration. - Battery SOC
Goes down from higher to lower value and then again goes up while it is getting recharged. - Fuel Economy as Miles per Gallons
Shows the maxium miles that the car can run per gallon of the fuel equivalent at a specified driving conditions for a EV.
Other conclusions, In same conditions
- The EV produces more torque and motor speed compared to HEV. However, with the additional help of Engine + Generator, the HEV has a higher overall value.
- The battery charging and discharging capability is higher for EV and thus EVs can achieve higher accelartion speeds. The SOC is also better for EVs compared TO hev.
- Efficiency of EVs is higher compared to HEV. This is evident from Milles per Gallon plot.
- EVs are more environmental friendly due to lesser emmisions.