Week - 4
Simulink for Mechanical and Electrical Engineers - Challenge : Week 4
OBJECTIVE 1:
- Implement control logic of a “washing machine” using Stateflow as per given sequence:
- If the power supply is available, the system gets activated
- If the Water supply is not available, stop the process & indicate through LED
- Soaking time should be 200s followed by Washing time of 100s.
- Then rinsing happens for next 20s & dryer runs for 50s
After all the processes have completed turn on the finished LED.
CHART:
PROCEDURE:
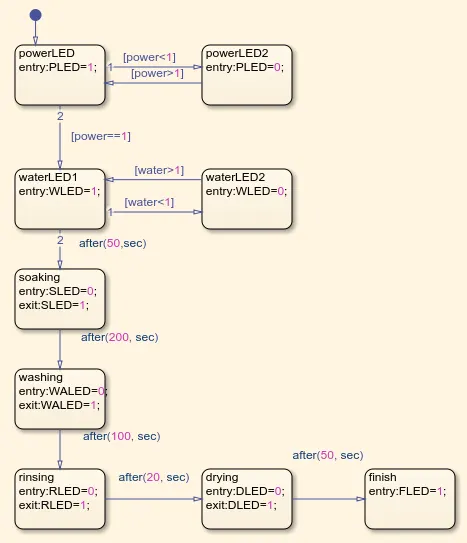
- Create a chart in the Simulink window. First block we need to create is to check the power supply. Here "power" is a input signal to the chart. Based on the value of "power", the states change between 0&1 for "PLED". "PLED" here is an output signal, to which we will connect a lamp. The lamp will turn green when supply is 'ON' ("PLED=1) and OFF vice versa.
- Similarly create a block for checking water, by using same logic as above.
- Now. once Power and Water supply is sorted, we have to create logic for washing process. We give a 50 sec delay for the water to get filled and then it moves to the "soaking" state.
- "SLED" is the lamp which indicates whether it is active or not. Upon entry, it will have state "0" and upon exit "1". It will be then made an output signal to this chart and then connected to the lamp, which will turn green once the state is executed and exited.
- Implement similar blocks for the remaining states as given in the question with respective time delays. Finish with a finish LED "FLED", which will be last of our output signal.
SIMULINK MODEL: https://drive.google.com/file/d/1NBV_efBcuff0hqd3TMlqwoDA3KOh_ny_/view?usp=sharing
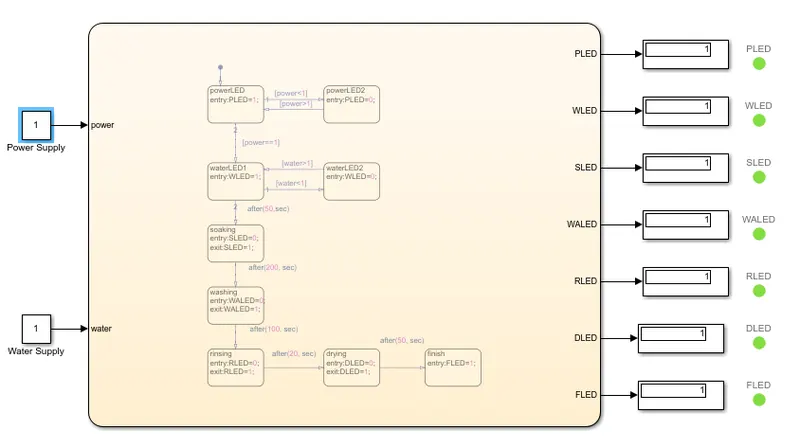
RESULT: The logic was implemented using chart and simulink and the results were observed.
------------------------------------------------------------------------------------------------------------------------------------------------------------------------------------------------------------------------------------------------------
OBJECTIVE 2:
2. Make a Simulink chart for the “Gear shift” logic as per below conditions:
Speed Range(kmph) Gear
0 to 15 1
16 to 25 2
26 to 40 3
41 to 60 4
Above 61 5
Give speed input while the simulation is running & display the gear number.
CHART:
SIMULINK MODEL: https://drive.google.com/file/d/1yHgffH-E1wCxzifLn-PaqD9ijEpqfVtj/view?usp=sharing
VALUES:
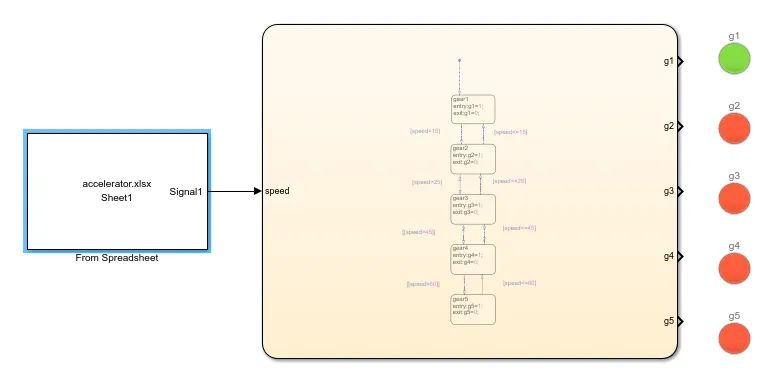
The accelerator input values was made using a "from spreadsheet" option. the below values were given,
| 1 | 0 |
| 2 | 5 |
| 3 | 10 |
| 4 | 15 |
| 5 | 20 |
| 6 | 25 |
| 7 | 30 |
| 8 | 35 |
| 9 | 40 |
| 10 | 45 |
| 11 | 50 |
| 12 | 55 |
| 13 | 60 |
| 14 | 65 |
| 15 | 70 |
| 16 | 75 |
| 17 | 80 |
| 18 | 85 |
| 19 | 90 |
| 20 | 95 |
| 21 | 100 |
| 22 | 105 |
| 23 | 110 |
| 24 | 100 |
| 25 | 80 |
| 26 | 60 |
| 27 | 40 |
| 28 | 20 |
| 29 | 0 |
First column, is time in seconds and second the "speed". I'm imagining a situation of constant acceleration upto 110kmph and 23sec and then decelleration for next 6 secs, by the time speed goes back to zero.
PROCEDURE:
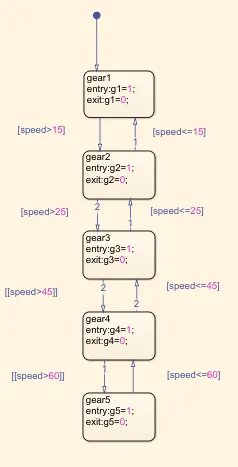
- Create a chart. We have to draw 5 blocks which represents different gears and design transition logic for it as well.
- Here as given in the question we create all the 5 blocks and use "speed" as a transition variable to jump from one block to another, thus creating a real world anologous of a vehicle shifting gear upon speed change.
- Each gear will also have a state variable, namely - g1, g2, g3 etc. This can be used and connected to a lamp to tell us which gear is activated.
RESULT:
The logic was implemented using chart and simulink and the results were observed.