Week-4 Challenge WOT Condition Part-2
1.Difference between mapped and dynamic model of engine, motor and generator
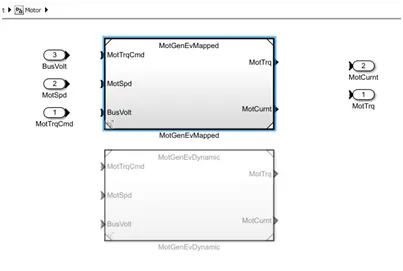
MAPPING MODEL:
The Mapping model is a 2-Dimensional Lookup Table where all the data like motor parameters values (motor rpm, starting torque and efficiency), generator parameter values (current, voltage) engine values are enter from the typical performance of the vehicle.
Mapped motor/Generator and drive electronics operating in torque-control mode.
Specify electrical torque range with a torque-speed to maximum motor power and torque. Specify electrical losses as a single operating point that estimate losses across the operating range and efficiency.
The output torque tracks the torque reference demand and includes a motor/Generator-response and drive-response time constant.
The Mapping to a motor/Generator gives fast simulations results and Assume that the speed fluctuations due to mechanical load do not affect the motor torque tracking.
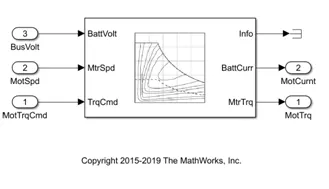
The above shows that Mapped motor has the inputs from the battery voltage values, motor speed values and motor torque command.
DYNAMIC MODEL:
A Dynamic model is represents the Actual components of the Motor/Generator and engine and understands the behavior of the Components and behaves accordingly.
Dynamic model is used to describe and predict the interactions over time between multiple components of a phenomenon that is viewed as a system. It focuses on the mechanism of how the components and the system change across time.
This model gives the detailed analysis given to the parameters of the motor/generator values and it simulates accordingly to the real time results.
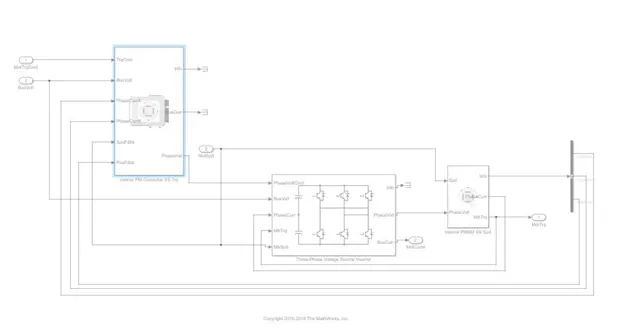
The above figure represents the Dynamic model of Motor/generator the interior permanent magnet controller have the input from the battery, and the 3-phase voltage source inverter that converts its voltage from DC form to AC form.
STEPS TO CHANGE MODEL TYPE
- Open the Ev Reference Application model in the MATLAB
- Go to passenger car sub-system ----- Electric Plant ----- then electric plant sub-system will appear.
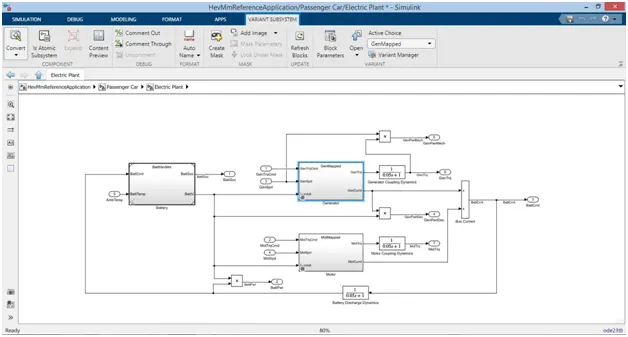
3.Go to VARIANT SUBSYSTEM option which in the taskbar and click on Variant Manager Option is present in the variant subsystem folder and then a new window will open
4.Go for variant blocks --- select Generator sub-folders
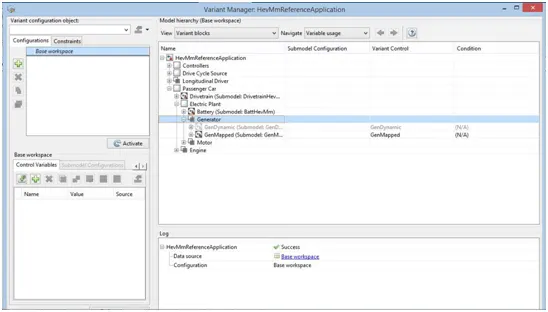
5.Right click on GenDynamic model and select set as Label mode Active choice
The above steps help to change the model type.
2.The model calculates miles per gallon & factors are considered to model fuel flow
Miles per Gallons
Miles per Gallon is used to show how far your car is able to travel for every gallon of fuel it uses.
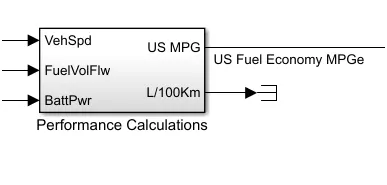
Factors are considered to model fuel flow are vehicle speed, Fuel flow, Battery power
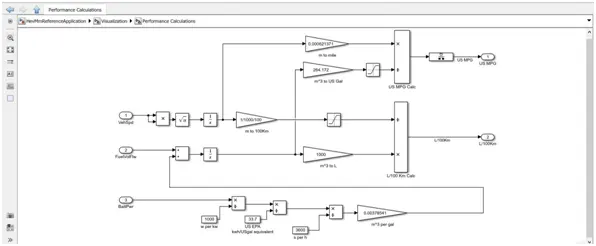
From the above 3 factors we can calculate the fuel consumption per gallons at how much battery energy required for the vehicle speed and fuel efficiency of the vehicle.
We know that 1000 Liters = 264.172 US liquid Gallons
3.The HEV Reference Application with WOT drive cycle & Change the grade and wind velocity in the environment block.
Hybrid Electric Vehicle reference application with the wide open Throttle as driving cycle
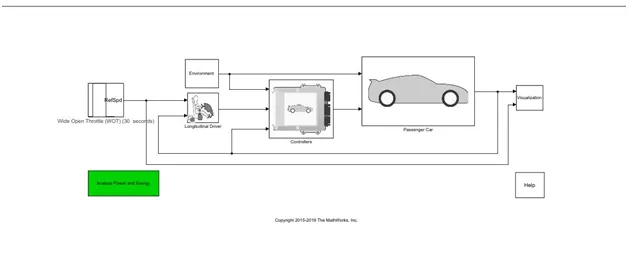
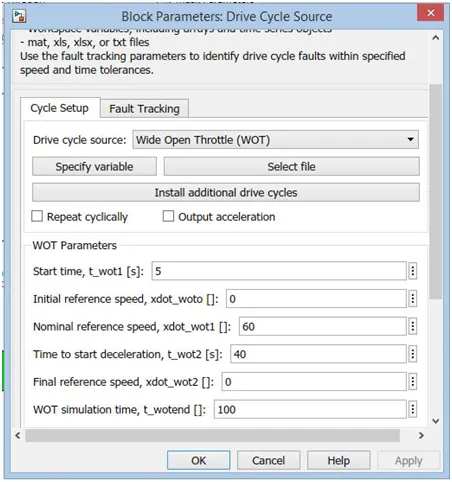
Wide open throttle parameters like start time, nominal speed reference and time to start deceleration values are changed as shown in the below figure.
Results
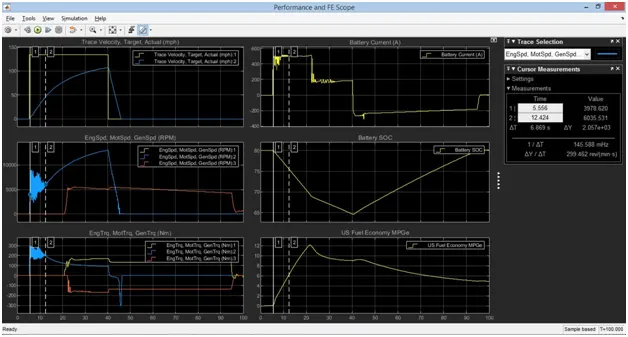
Plot 1 refers to Trace, Target & Actual velocity. The velocity v is applied a step command of the full velocity within 5sec of time is called wot condition and remains approximately 60mph followed by the vehicle is slowing down time depends upon the actual kinetic energy of the vehicle has acquired.
Plot2 refers to the engine, motor and generator speed at 5sec of start time the acceleration is constant, battery state of charge (soc) is at maximum position of 80% & battery current (A), torque, fuel economy are constant values. After the acceleration increases the battery current and torque starts fluctuating battery state of charge start discharge from maximum and fuel economy increases.
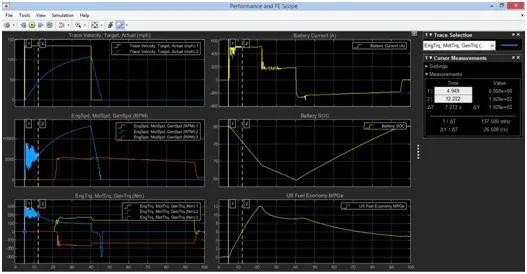
The above figure Plot3 refers to the engine, motor & generator torque after the start time the torque gets fluctuating with respective the battery current, battery state of charge start decreases from the maximum and fuel economy increases. The speed of the vehicle is going increases the torque gradually decreasing to run at constant value and battery current is constant for a certain time, the battery soc reduces to 64%.
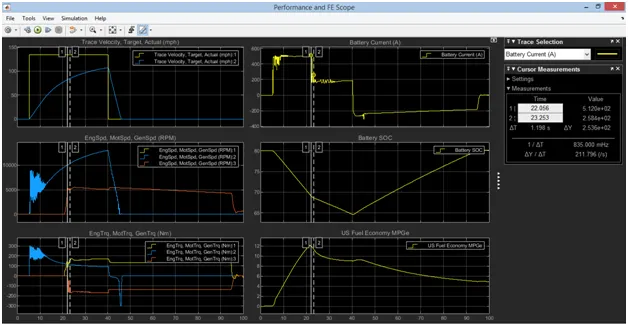
The above figure refers to plot4 battery current (A). At the starting time of 5sec the battery current remains constant whenever velocity of the vehicle increase the battery current is raise up-to approx 480A. State of charge of battery decrease the battery current also falls down after the torque of the hybrid vehicle decreases the fuel economy starts decreasing.
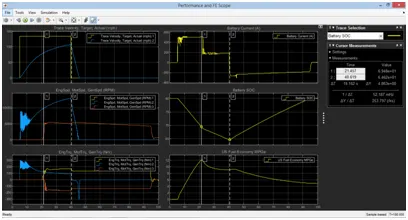
The figure refers to the plots 5 & 6 battery state of charge and fuel economy. At the point of battery state of charge reduces from approximately 69% to 64% decreases then fuel economy also decreases, the motor rpm increase further extent.
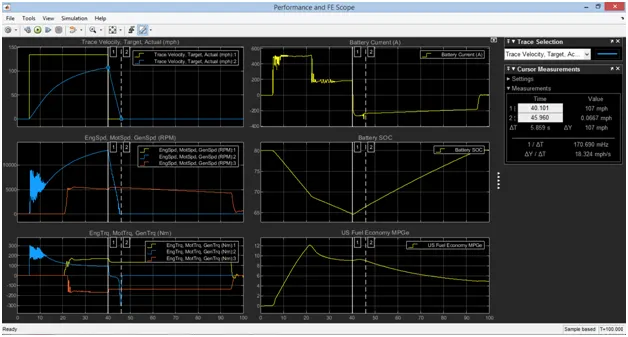
When the velocity of the vehicle start decreasing from approximately 110mph to 0mph the engine speed, motor speed and generator speed also decreases from 13000rpm to 0. The torque and battery current (A) of the vehicle goes to the negative value this indicates the vehicle is in regenerative mode the battery soc starts charging and fuel economy slightly increases and again falls down.
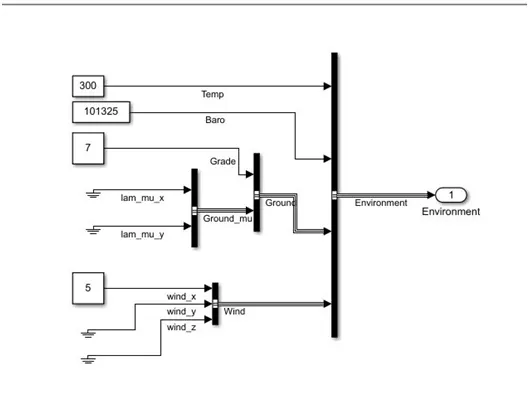
Grade values were updated from 0 to 7 and Wind velocity values were updated from 0 to 5 m/sec .The actual speed of the vehicle is 60mph at 7 grade condition here we have lower speed because there is no higher battery current then limited by the battery management system vehicle controller is going take care of what is happening when the more power is demanded because of limit in current.
RESULTS
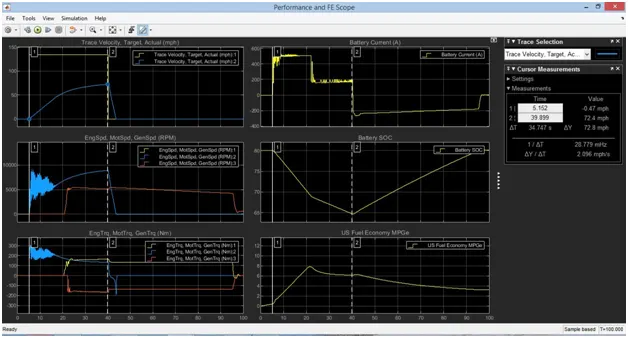
The above figure refers to the HEV reference applications in which the changes are made in grade and wind velocity results were plotted.
Plot 1 refers to the velocity of the vehicle is constant for 5sec of time and step command for the full velocity appromately 130mph upto 40sec followed by the decleration time. The motor generator, and engine speed (rpm) and torque is 0 upto 21sec and starts increasing.battery current is increase, battery soc also decreases from 80% to 64%.
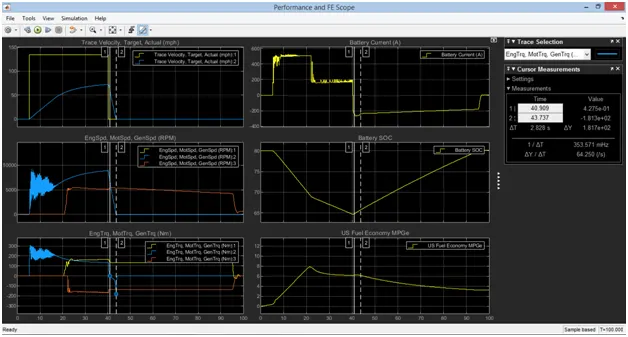
From the above figure it shows that the time velocity of the vehicle starts decreasing the motor rpm falls down from 8000rpm to 0rpm and the torque, battery current of the vehicle goes negative value this indicates the vehicle runs at regenerative braking mode it means the battery starts charging. The fuel economy slightly increase and no time reduces again.
4.Keeping all other parameters same, compare the simulated results of hybrid and pure electric power trains
Electric Vehicle block diagram with Wide open throttle driving cycle
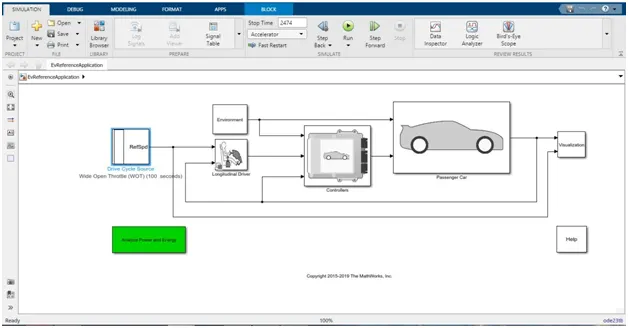
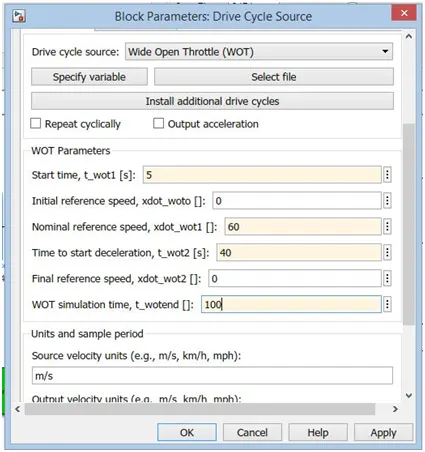
The above represents the wide open throttle parameters are updated and results are given below
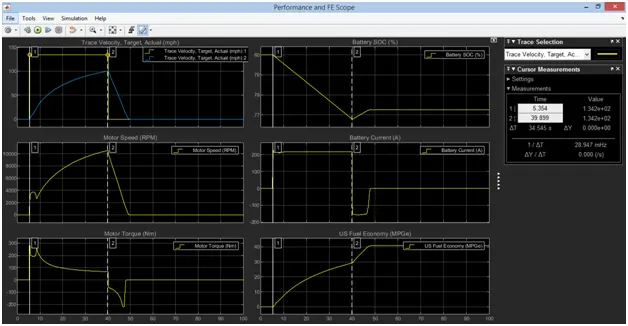
The above figure shows the velocity applied to a step command to the full velocity with 5ec of time is called wot conditions and remains at 100mph followed by the deceleration time depends upon the kinetic energy of the vehicle has acquired. we have the less acceleration time because the maximum motor power is limited by the certain values and limiting factor is current. The fuel economy has increases. The battery state of charge degraded from the 80% to 76%.
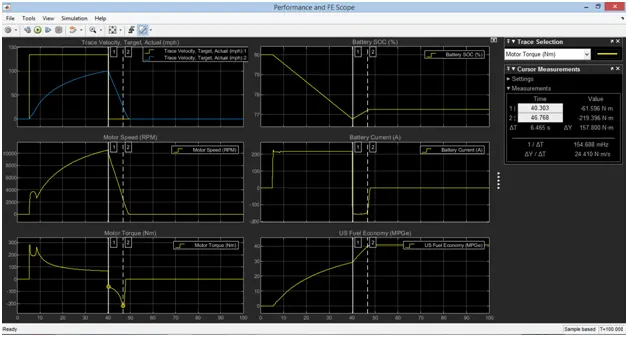
From the above figure the motor torque value is being negative it means the motor acts as generator, the vehicle speed is slowing down, and vehicle is in regenerative mode. When the vehicle is in regenerative mode the battery starts charging and battery state of charge increases rapidly and the fuel economy mile per gallons further increases.
Grade values were updated from 0 to 7 and Wind velocity values were updated from 0 to 5 m/sec in EV reference application.
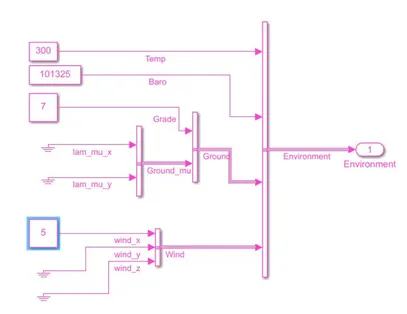
RESULTS
The actual speed of the vehicle is 60mph at 7 grade condition here we have lower speed because there is no higher battery current then limited by the battery management system vehicle controller is going take care of what is happening when the more power is demanded because of limit in current.
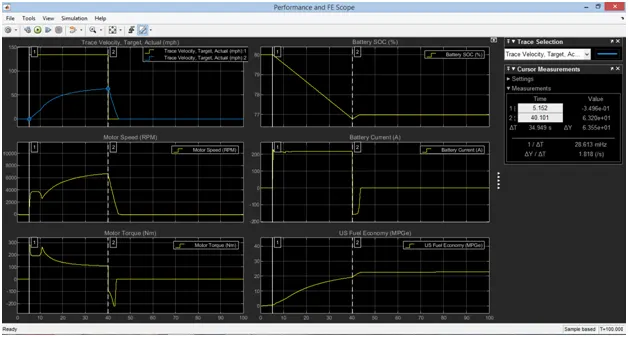
From the above results the velocity applied to a step command to the full velocity with 5ec of time is called wot conditions and remains at 60mph followed by the deceleration time depends upon the kinetic energy of the vehicle has acquired. We have the less acceleration time because the maximum motor power is limited by the certain values and limiting factor is current. The fuel economy has increases. The battery state of charge degraded from the 80% to 76%.
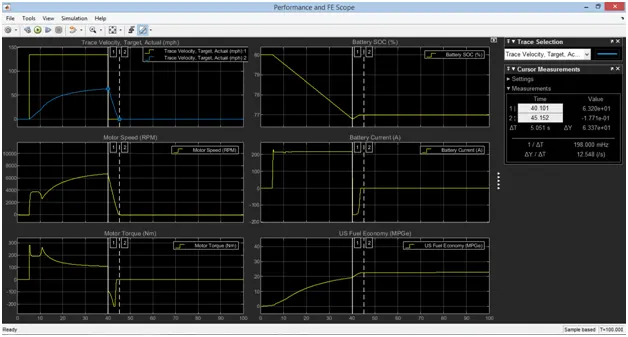
The velocity of the vehicle is start deceleration from the 60 to 0mph the motor speed and battery state of charge also reduces and the motor torque Nm and battery current going negative value the vehicle is decelerating regenerative torque is negative in nature the speed is positive it implies the battery starts charging.
CONCLUSION
The difference between mapped and dynamic model of engine, motor and generator were noted and steps to the change model type is given & factors are considered to model fuel flow The HEV Reference Application with WOT drive cycle updated the grade and wind velocity in the environment block results are engaged. All other parameters same, compare the simulated results of hybrid and pure electric power train are noted.