Week-4 Challenge WOT Condition Part-2
1. What is the difference between the mapped and dynamic model of engine, motor, and generator? How can you change the model type?
Mapped Model
The Mapped model for any element (Engine, motor, generator, or any other) is made up of Lookup Tables.
The specified data can be entered if the parameters of the system if only available.
The action is based on the predefined inputs.
Dynamic Model
The behavior of the system is analyzed and the element(Engine, motor, generator, or any other) acts accordingly to the situation.
The simulation is real-time and dynamic in nature.
It benefits the designer to design a more realistic model.
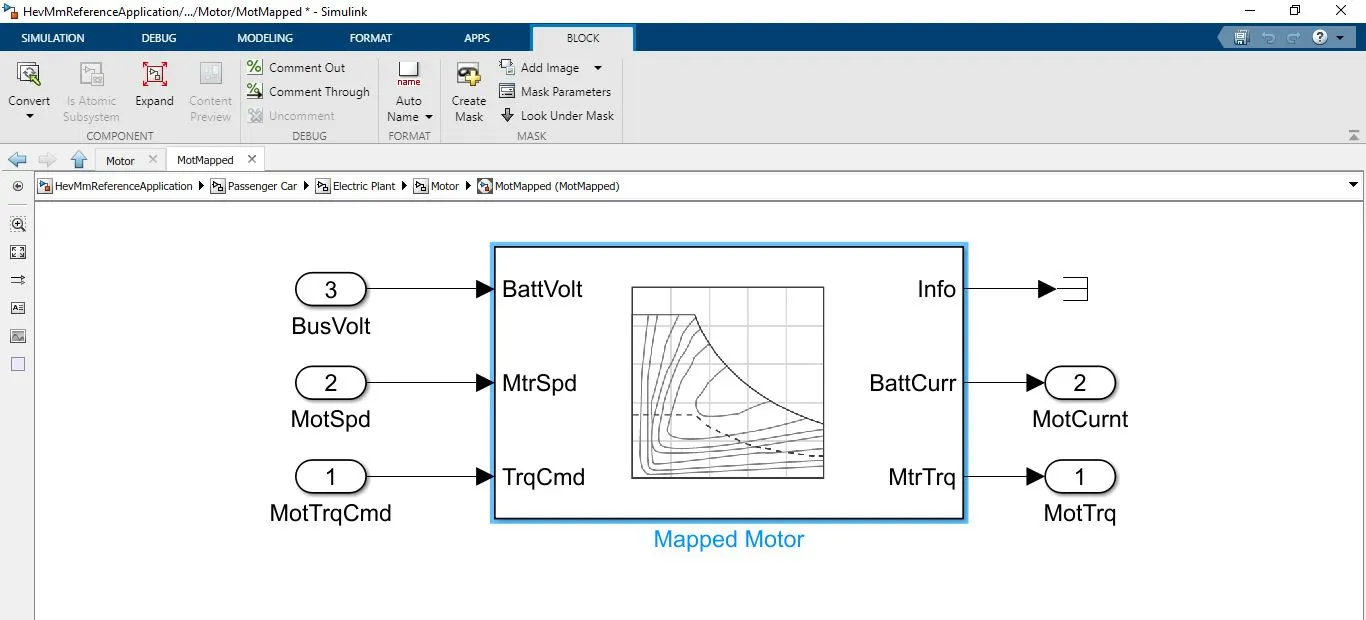
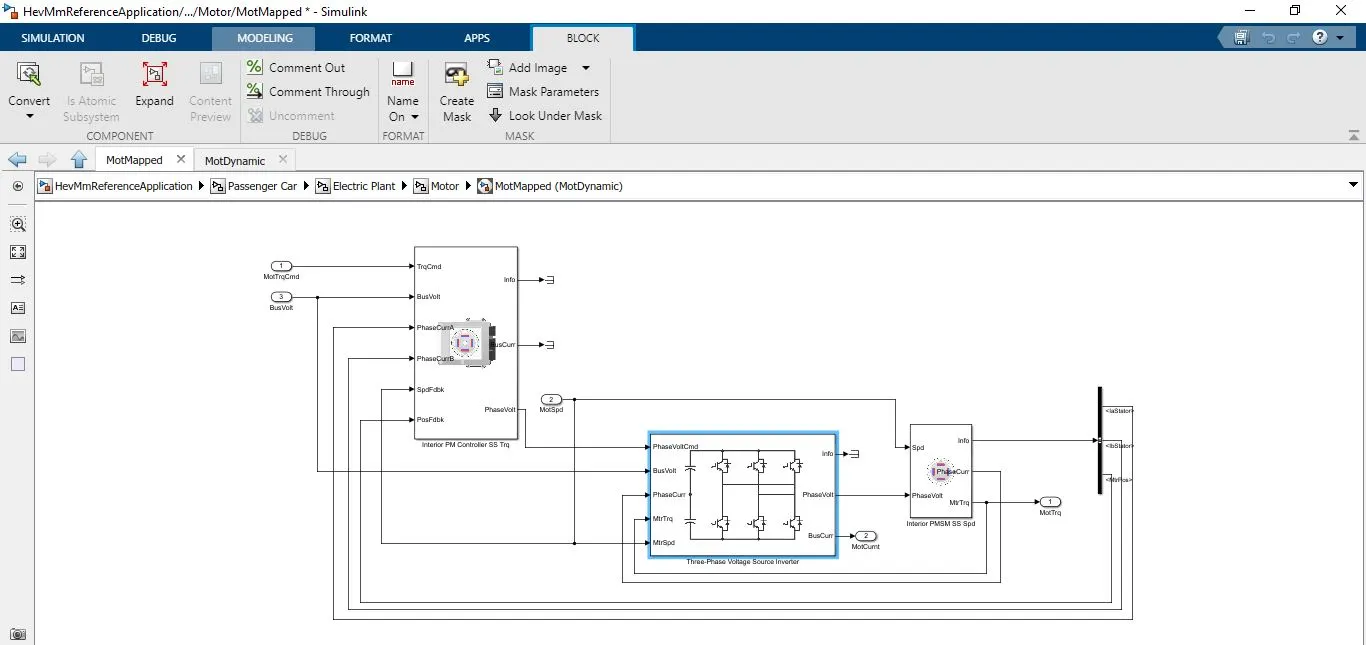
Let us consider the example of Motor in the "Hev Reference Application".
Mapped Model
Dynamic Model
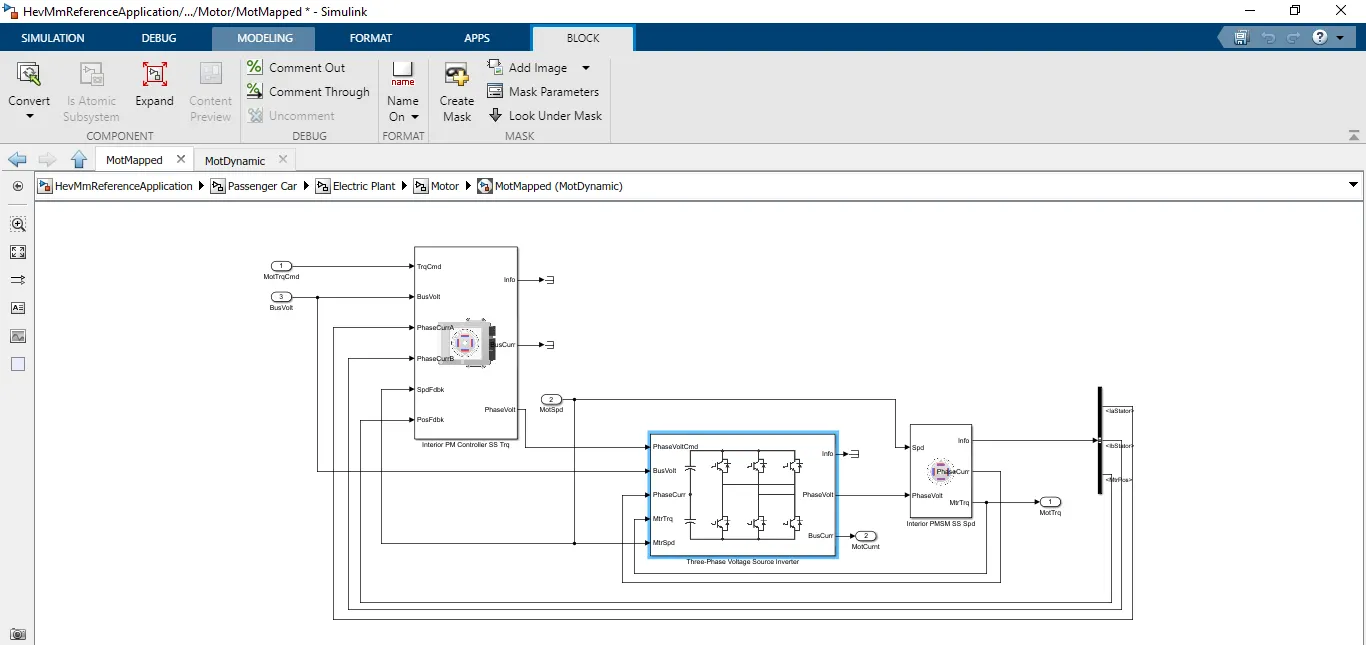
How can we change the model type?
Here we can see two models: MotMapped and MotDynamic
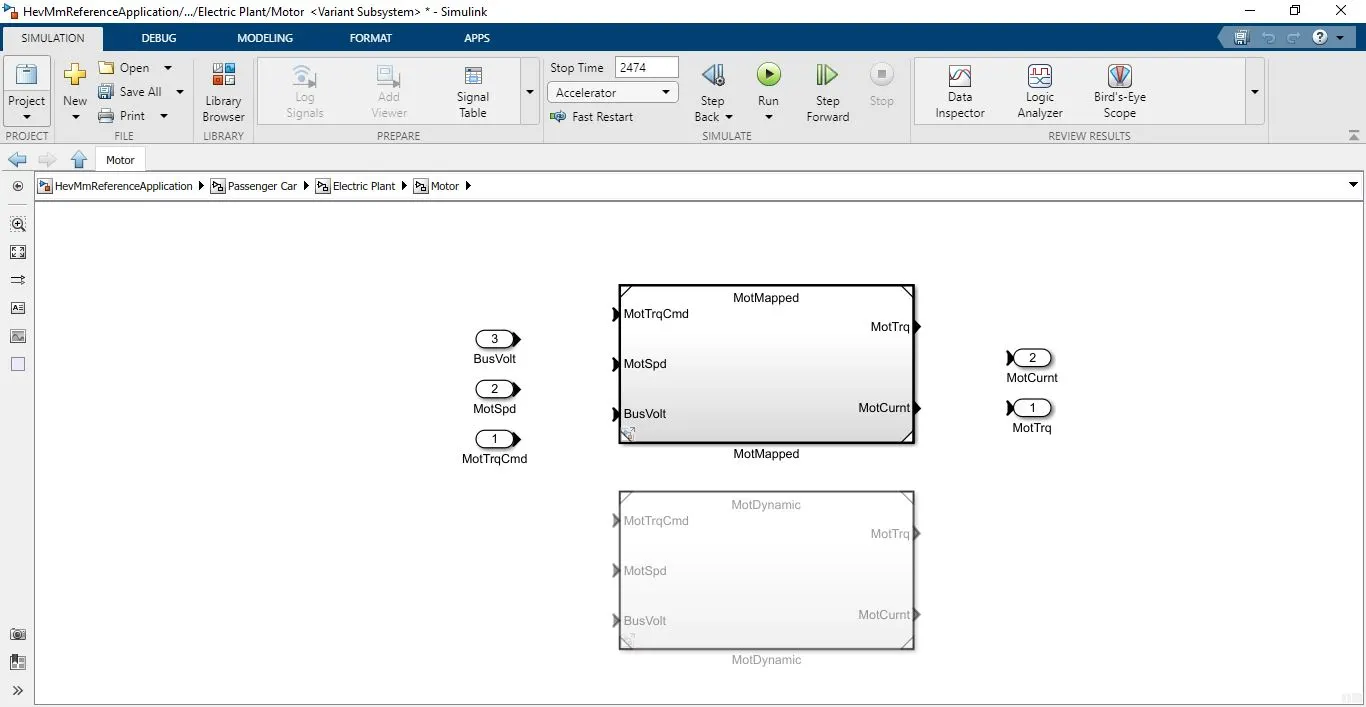
When we click on the MotMapped block
We can see a tab Model Block
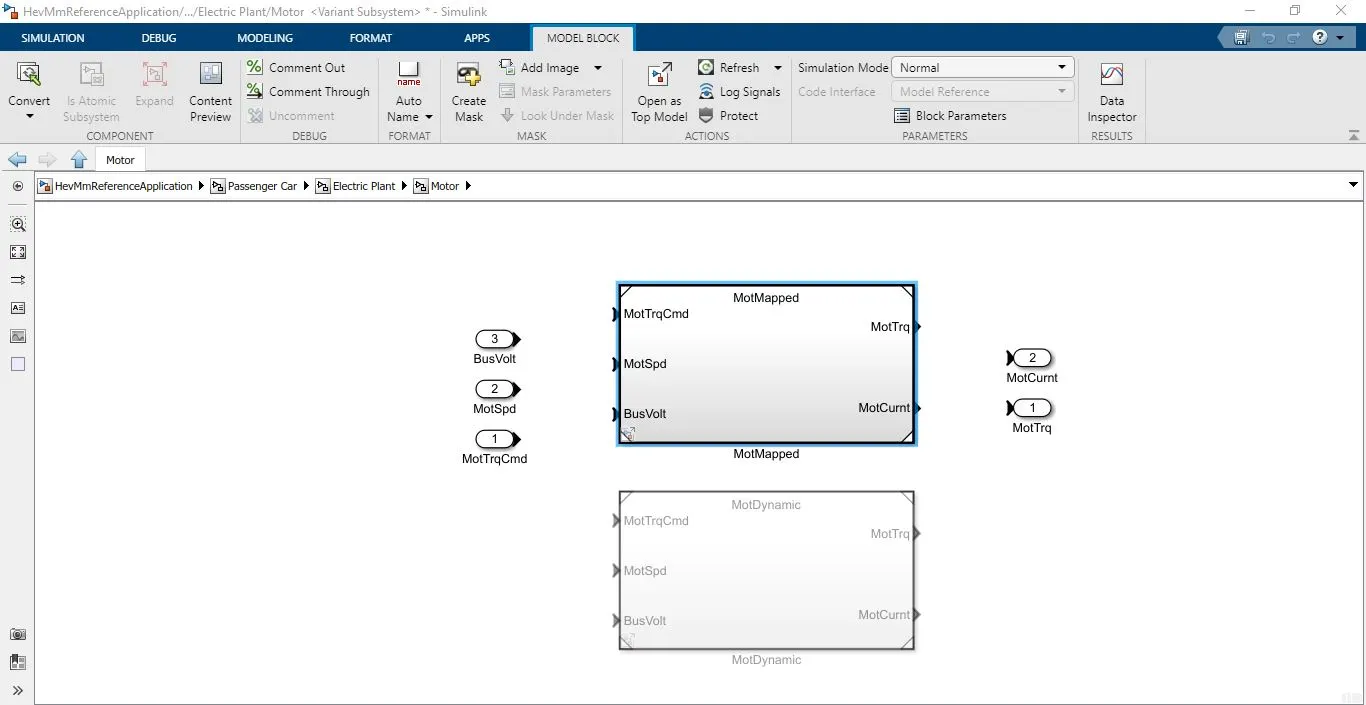
Click on Block Parameters and then Click on the Browse option and upload the MotDynamic.slx file.
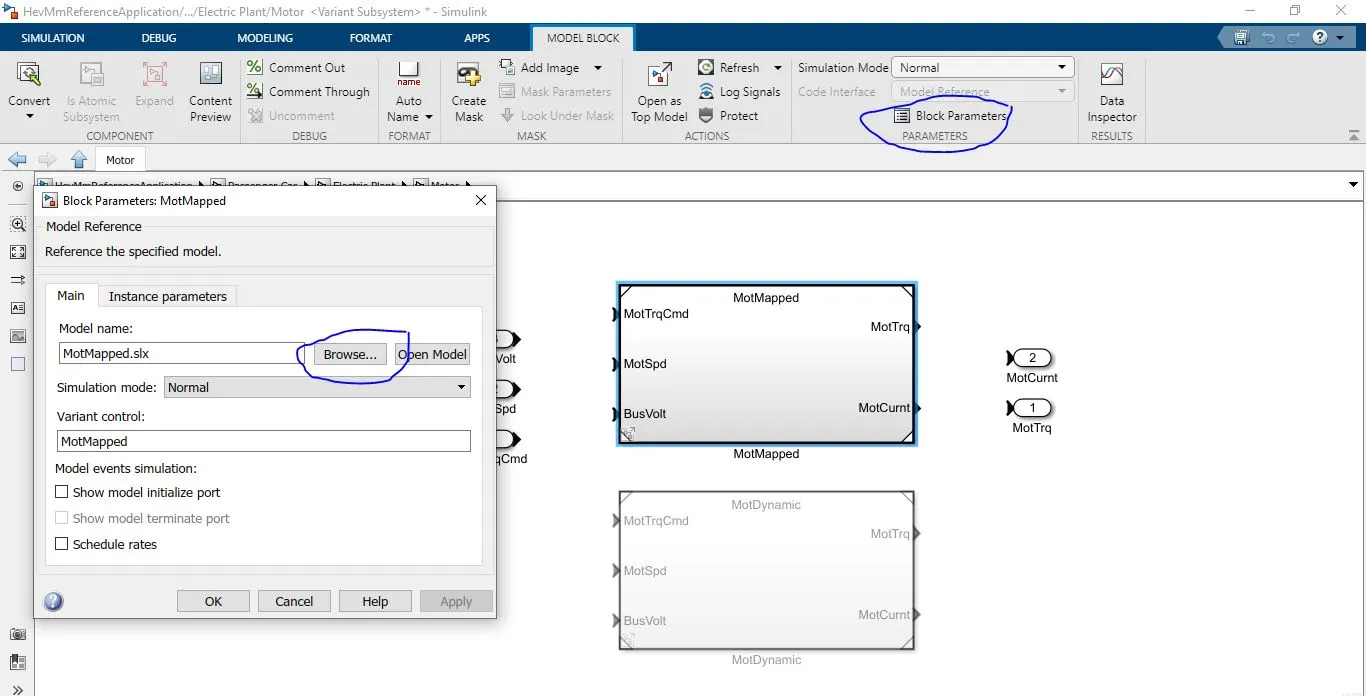
It can be observed in fig below.
Click Apply--> OK.
We will get the Dynamic model of Motor for simulation.
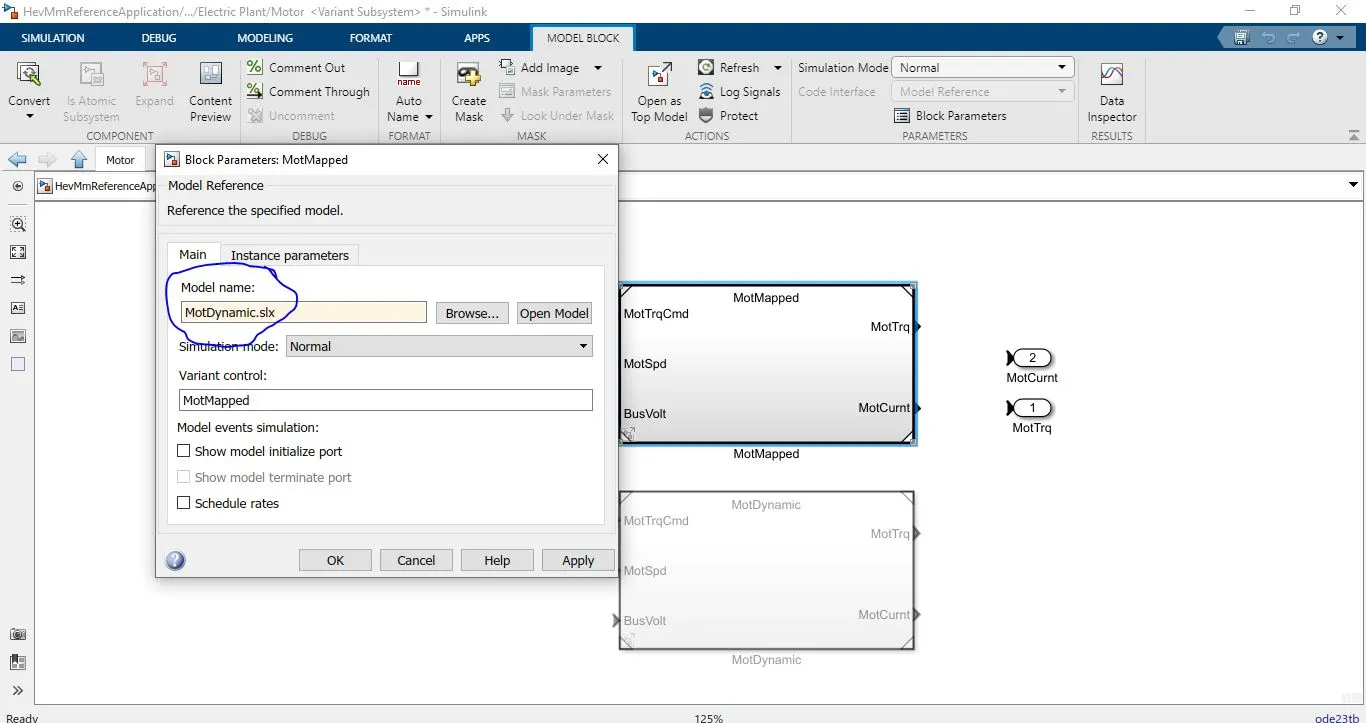
Following the above process for Generator and Engine can help to change the Mapped model to Dynamic model.
2. How does the model calculate miles per gallon? Which factors are considered to model Fuel Flow?
Miles per gallon is a fuel economy rating (Mileage) given in the US standard.
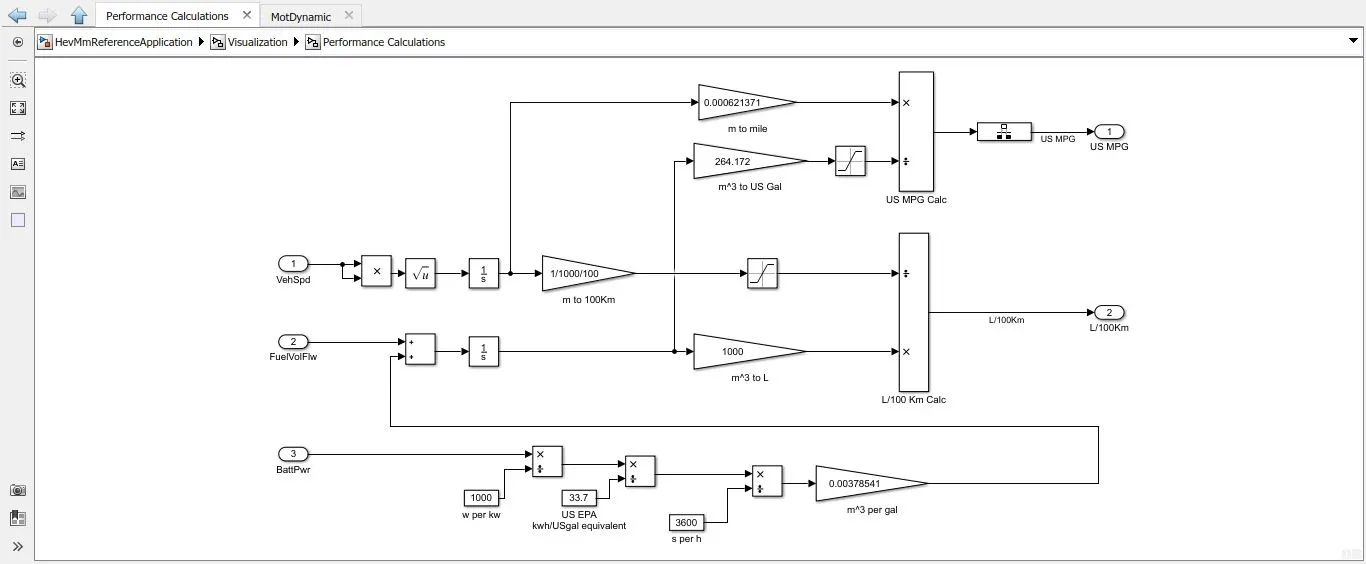
Here in the "HEV Reference Application" example, We can analyze the calculation of Miles per gallon, in the system, we can observe a "Performance Calculation" subsystem, inside "Visualization" subsystem.
The Vehicle Speed, Fuel Flow Volume, and Battery Power is given as input to the subsystem.
The particular calculation is observed from the below diagram.
Both the power sources of electric and fuel are considered with the vehicle velocity for calculation.
Battery power is first converted into KiloWatt then it is divided by 33.7. The fuel equivalent of the battery is added to the fuel flow. Using vehicle speed and time the distance of travel is calculated. Then distance is converted into miles. Then as we have the volume, fuel flow in meter cube is converted to Gallon. This distance/volume gives the output ie Fuel Economy in miles per gallon.
3. Run the HEV ReferenceApplication with the WOT drive cycle. Change the grade and wind velocity in the environment block. Comment on the results.
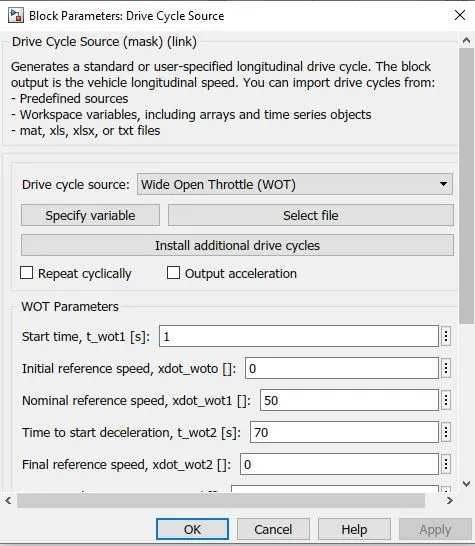
The drive cycle is changed to Wide Open Throttle(WOT) and given the parameters as shown in the fig below.
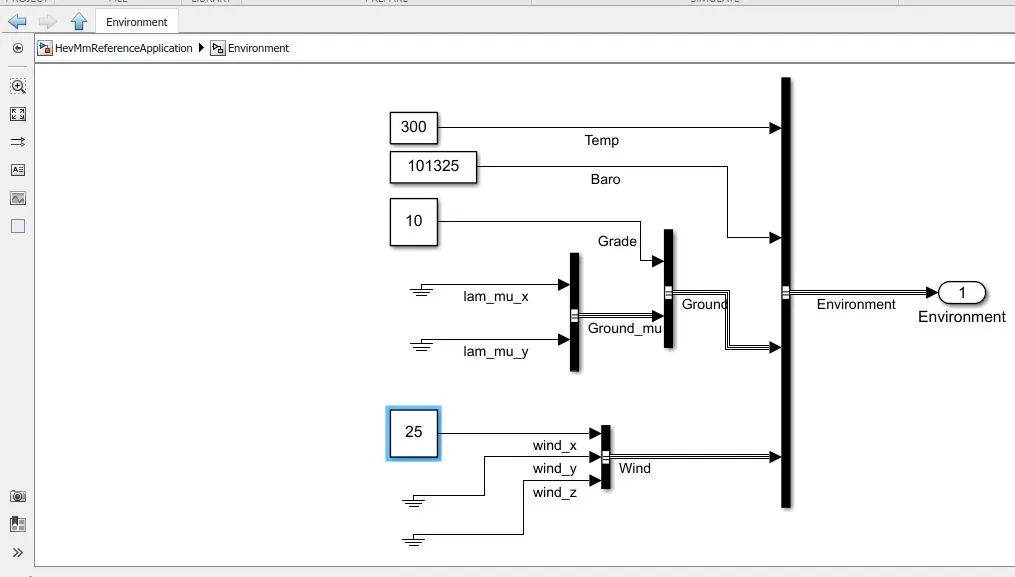
The grade and wind velocity values are changed in the Environment subsystem.
The grade is given as 10 and wind velocity as 25. All other values are kept default.
It is shown in the fig.below.
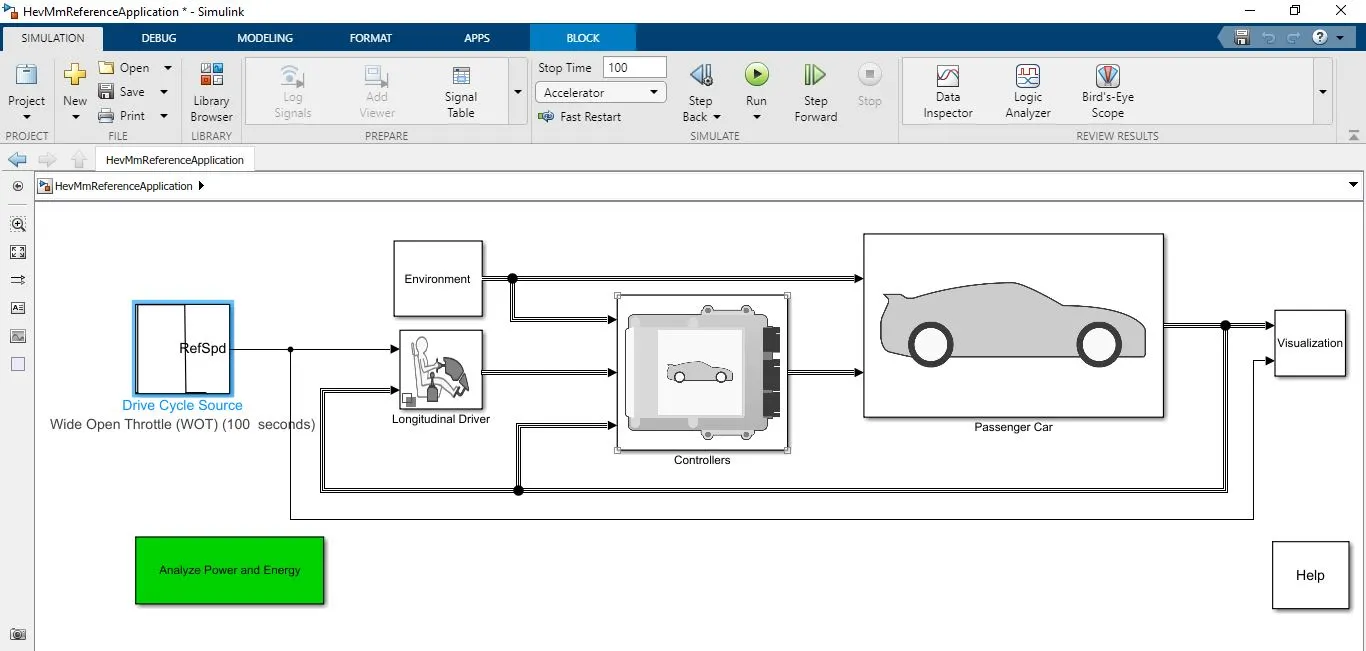
The diagram given below shows the ready to RUN model after the required changes. Click on the RUN button to execute the simulation and observe the results.
Result
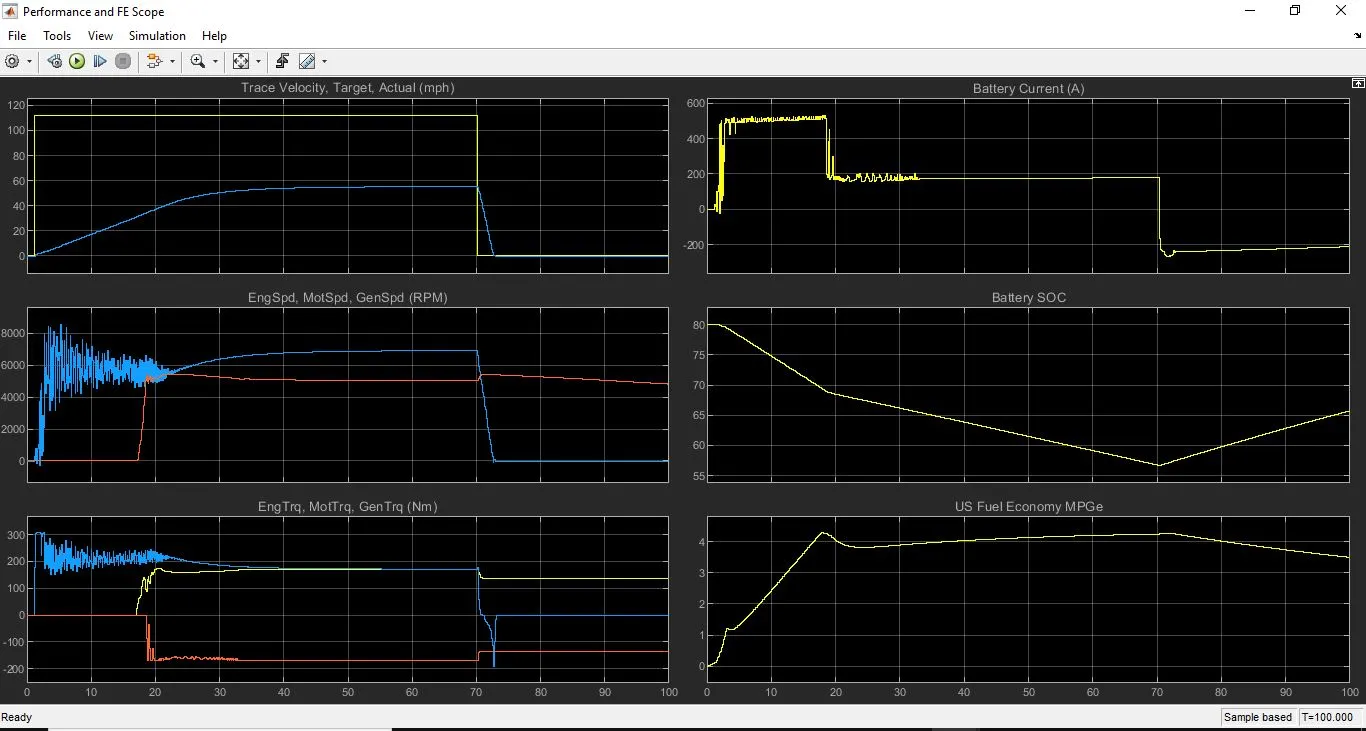
The above Fig is the output we get after running the model.
The First plot gives the Velocity, Target velocity which is as per the drive cycle, and the actual velocity of the vehicle. In the actual plot speed gradually increases to a value near to 60mph and decreases to Zero in a quick time.
The plot below that gives the comparison between speeds of Engine, Motor, and Generator.
The third plot gives a comparison between the Torque of Engine, Motor, and Generator.
The first plot on the right represents Battery Current requirement. Initial Acceleration takes a High Current which then lowers to a constant value and again reduces when the vehicle decelerates. The current shows a negative value while the regeneration process happens.
The plot below that gives the battery State of Charge. The battery SOC is initially 80% then there is a faster change at the start of acceleration. Then it gradually reduces to nearly 55% when the acceleration continues. When the declaration occurs as we know there is regeneration, hence there is an increase in the state of charge for the rest of the time.
4. Keeping all other parameters the same, compare the simulated results of hybrid and pure electric powertrains.
1.Pure-Electric Vehicle Model
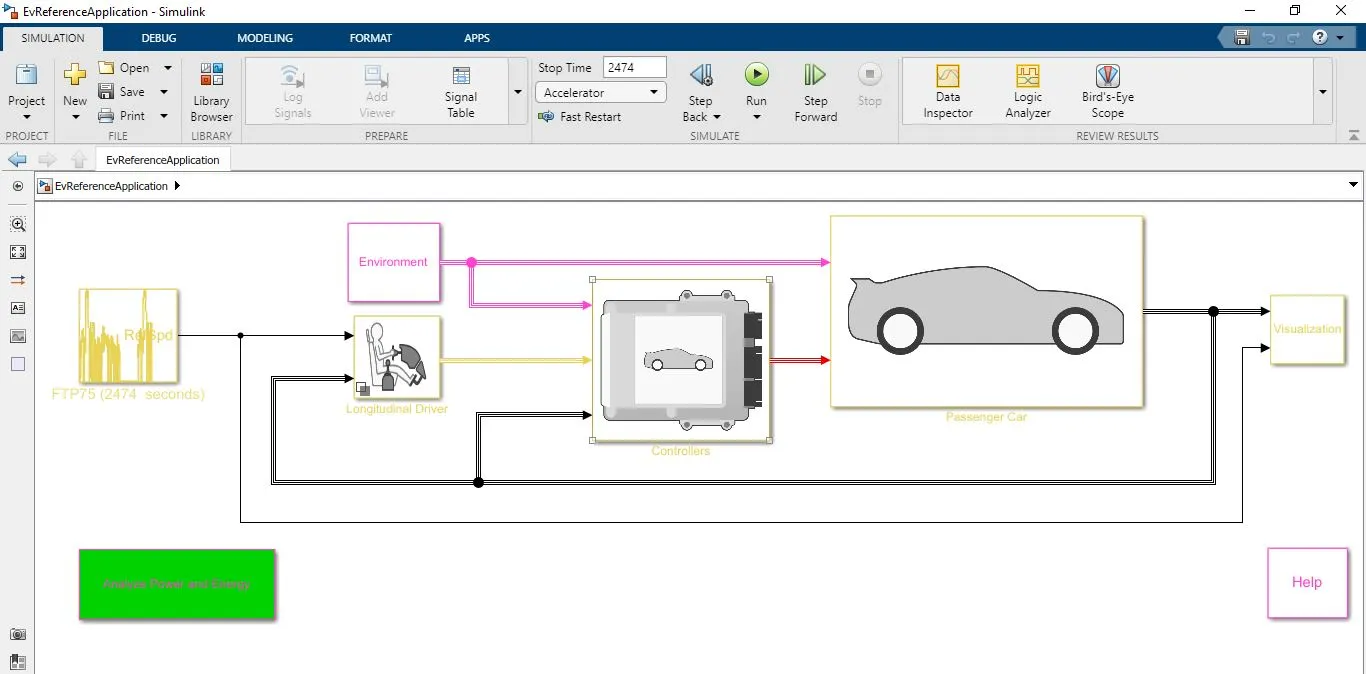
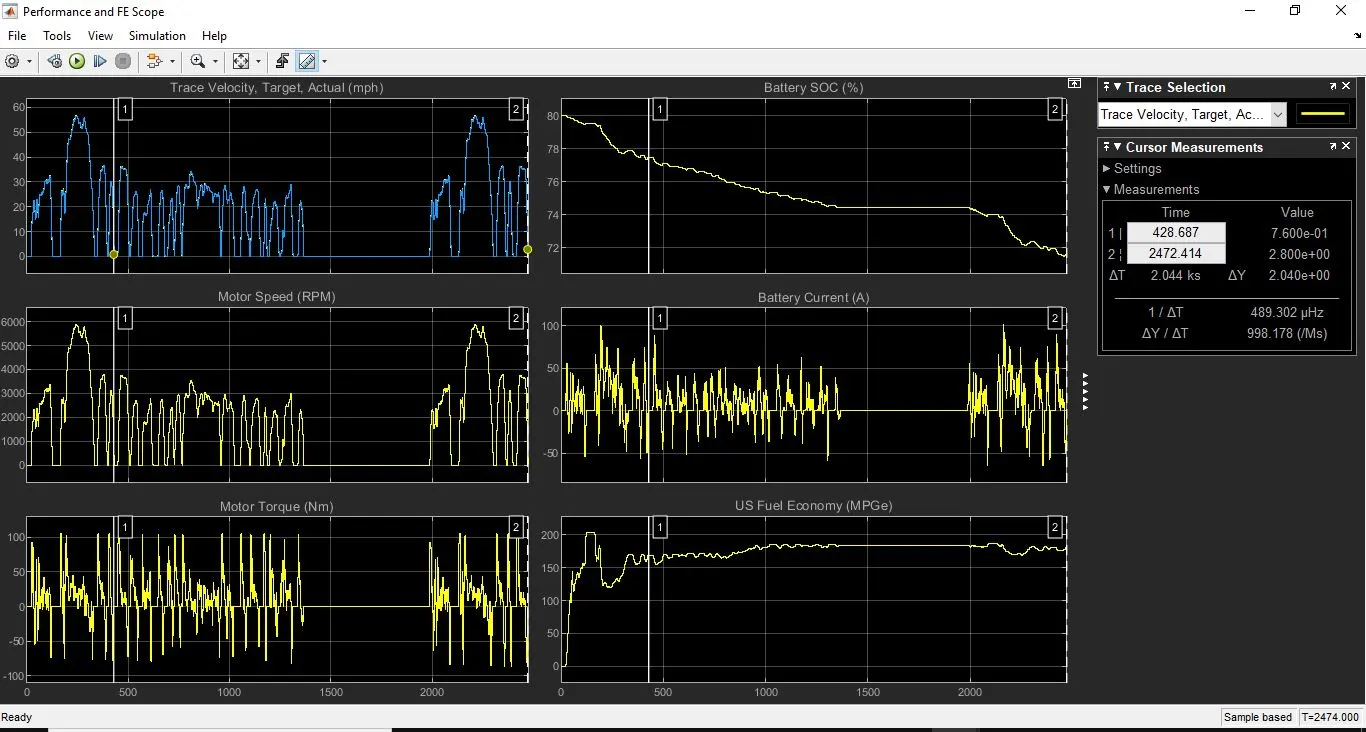
Result 1.
2.Hybrid Electric Vehicle
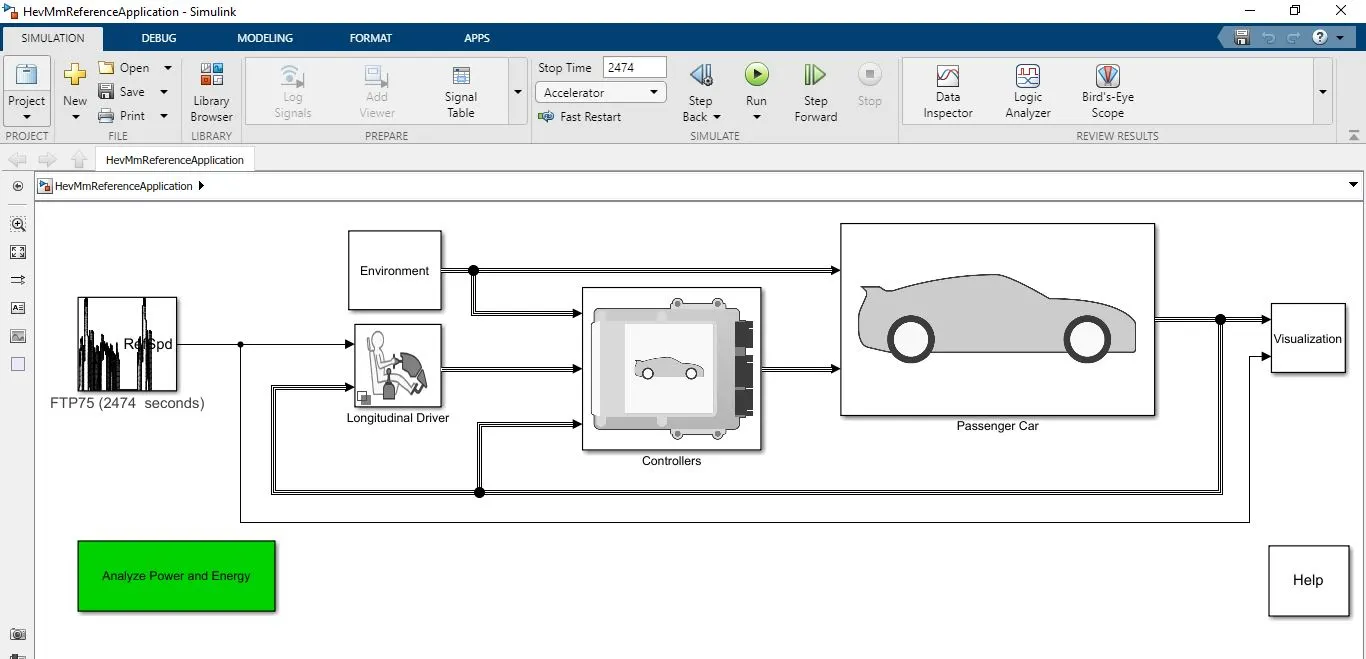
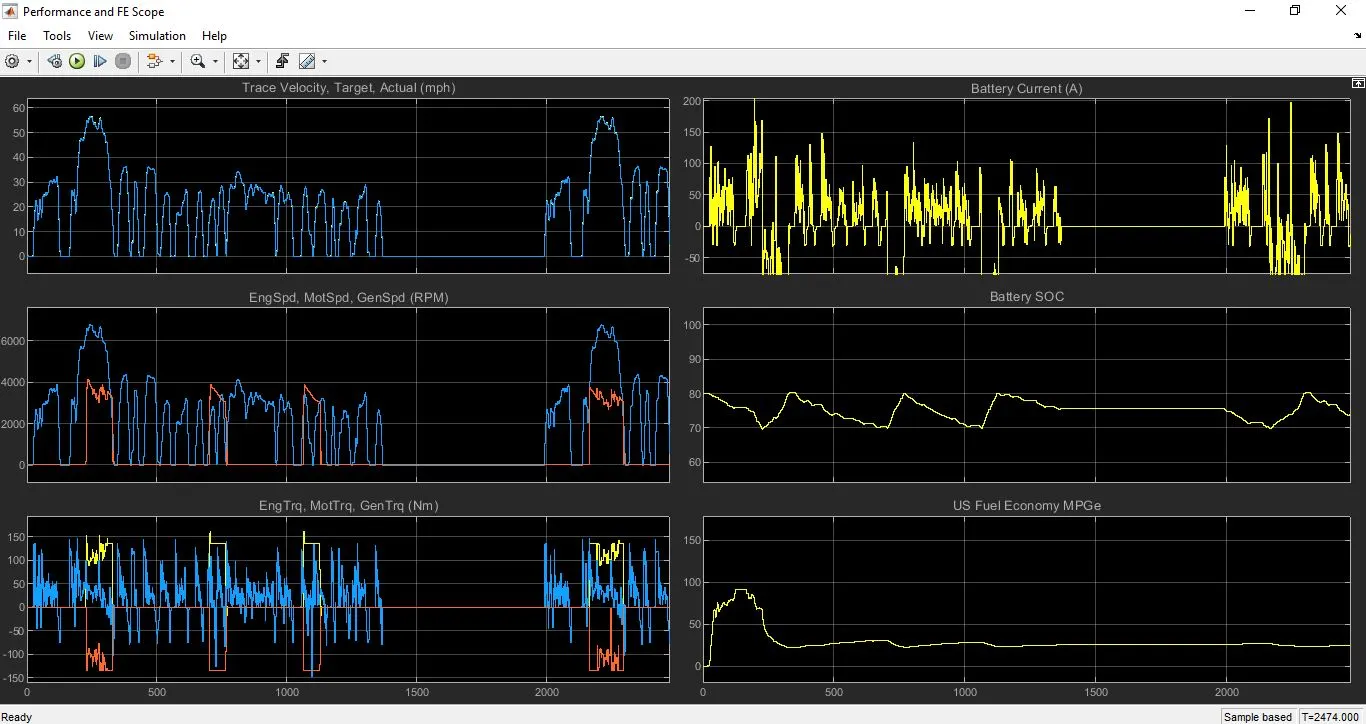
Result 2
Comparing Result 1 and Result 2
Plot: Trace Velocity
The first plot on the left shows the speed of the vehicle, here in both EV and HEV the actual speed and targeted speed(drive cycle speed) are similar.
Plot: Motor/Engine/Generator Speeds
The second plot on the left represents the Motor speed(RPM) in the case of EV and, in the case of HEV, the Motor, Generator, and Engine Speeds(RPM) are shown in a single plot.
Plot: Motor/Engine/Generator Torques
The third plot on the left represents the Motor torque(Nm) in the case of EV.
In the case of HEV, the Motor, Generator, and Engine torque(Nm) are shown.
Plot: Battery State of Charge(SOC).
In the first case: EV, the SOC decreases from a higher value(80%) to a lower value as the vehicle moves. Even though there is a slight improvement in some regions due to regeneration, it is very small compared to that of HEV.
In the second case: HEV, the SOC decreases and increases as the vehicle accelerates and decelerates respectively.
Plot: Battery Current.
In the first case: EV, Battery current increases when there is an acceleration and lowers when the vehicle decelerates. Battery current goes below zero, in case of regeneration.
In the second case: HEV, Battery current increases when there is an acceleration and lowers when the vehicle decelerates. Higher values of negative current are observed in this case because of frequent regeneration.
CONCLUSION
-> The difference between the mapped and dynamic model of engine, motor, and generator is described. Steps to change model type is explained.
-> Calculation of miles per gallon and the factors considered to model fuel flow is discussed.
-> The HEV ReferenceApplication with executed with WOT drive cycle after changing the grade and wind velocity in the environment block. The result is analyzed.
-> The simulated results of hybrid and pure electric powertrains, keeping all other parameters same is observed and compared