Week-11 Challenge: Braking
1.For a defined driving cycle, calculate the energy required for braking.
A driving cycle is a series of data points representing the speed of a vehicle versus time. Driving cycles are produced by different countries and organizations to assess the performance of vehicles in various ways, as for instance fuel consumption, electric vehicle autonomy, and polluting emissions.
Here we consider a drive cycle data and use that to find the energy required for breaking.
We know Energy `E=1/2mv^2`
m is the total mass
Here V is the vehicle initial velocity subtracted by the present velocity.
The drive cycle graph is given below
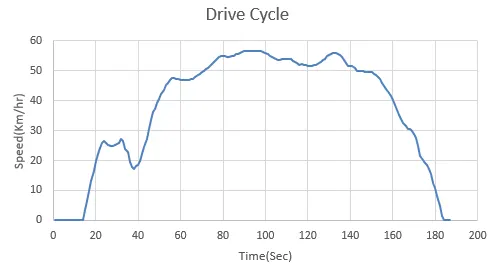
The total mass of the vehicle is considered to be 1000kg
Applying the equation of energy to the drive cycle we use an Excel sheet.
This excel sheet is attached.
The Output plot is given below.
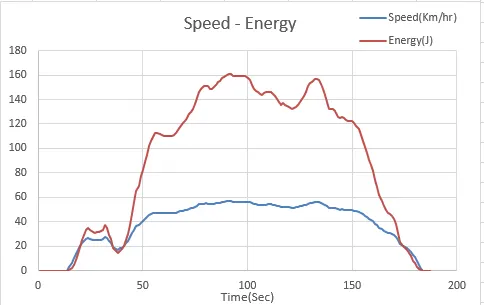
Here the energy required is maximum up to 160J and it is instantaneous in nature.
2.Why electric motor can’t develop braking torque at high speed similar to starting?
An electric motor when it is at a moderate speed, higher torque is required to maintain the speed in case it has load connected.
When a motor is at low speed it has more torque supporting the braking operation. Less speed means less inertia so there a less requirement of braking energy. But when the speed is high is the torque demanded is high the electric motor cant provide that torque at high speeds. The energy loss is also high under these conditions.
How electric and mechanical brakes are coordinated?
Hybrid vehicles usually have several braking systems, and braking mode switches are significant events during braking. It is difficult to coordinate torque fluctuations caused by mode switches because the dynamic characteristics of braking systems are different.
In electric vehicles, we use types of braking Regenerative braking and Mechanical Braking.
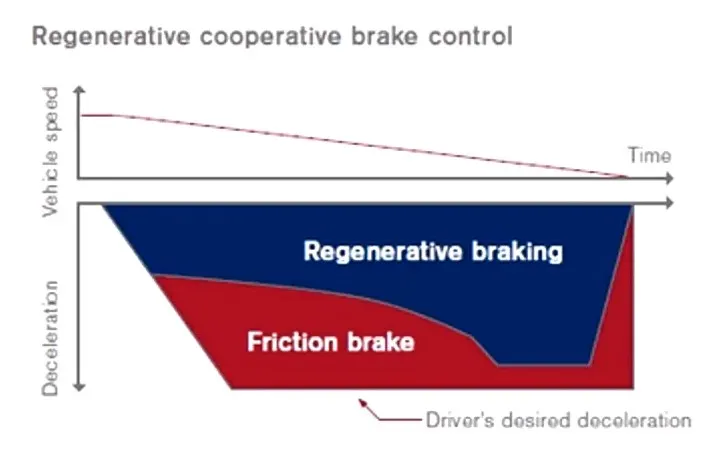
In the fig below we can see the braking line of both Regenerative braking and Mechanical Braking.
There are two types of brake control strategies.
Series Combination: In this case, we apply Mechanical brake and Regenerative braking one after another.
Parallel Combination: In this case, we apply the Mechanical brake and Regenerative brake both parallelly.
This is the more efficient and widely used Braking strategy.
3.Make a MATLAB program that plots the contour of given motor speed, torque, and efficiency values. Attach the code as a .m file attach a screenshot of all the plots
Here we consider
Loss Coefficients
For Copper Loss (kc)=0.2
For Iron Loss (ki)=0.008
For Windage Loss(kw)=0.0001
and Constant Loss =20.
The Equation of Losses are given below
`Copper Loss=kc**T^2`
`IronLoss=ki**omega`
Windage Loss`=kw**omega^3`
Total Loss = Copper Loss+Windage Loss + Iron Loss+Constant Loss
Output Power = Torque x Speed
Input Power = Output power +Losses
Efficiency = Output Power/Input Power
The Code used for the plot is given below
clc
w=linspace(0,1000);
T = linspace(0,300);
kc=0.2;
ki=0.008;
kw=0.00001;
ConL=20;
[X,Y]=meshgrid(w,T);
copper_loss=(Y.^2)*kc;
iron_loss=X*ki;
windage_loss=(X.^3)*kw;
o_p=X.*Y;
input_power=copper_loss+iron_loss+windage_loss+o_p+ConL;
Eff=(o_p)./(input_power);
n=linspace(0.7,0.95,10);
box off
grid off
contour(X,Y,Eff,n)
title('Speed Vs Torque')
xlabel('Speed (Rad/Sec)')
ylabel('Torque (Nm)')
The output plot is given below
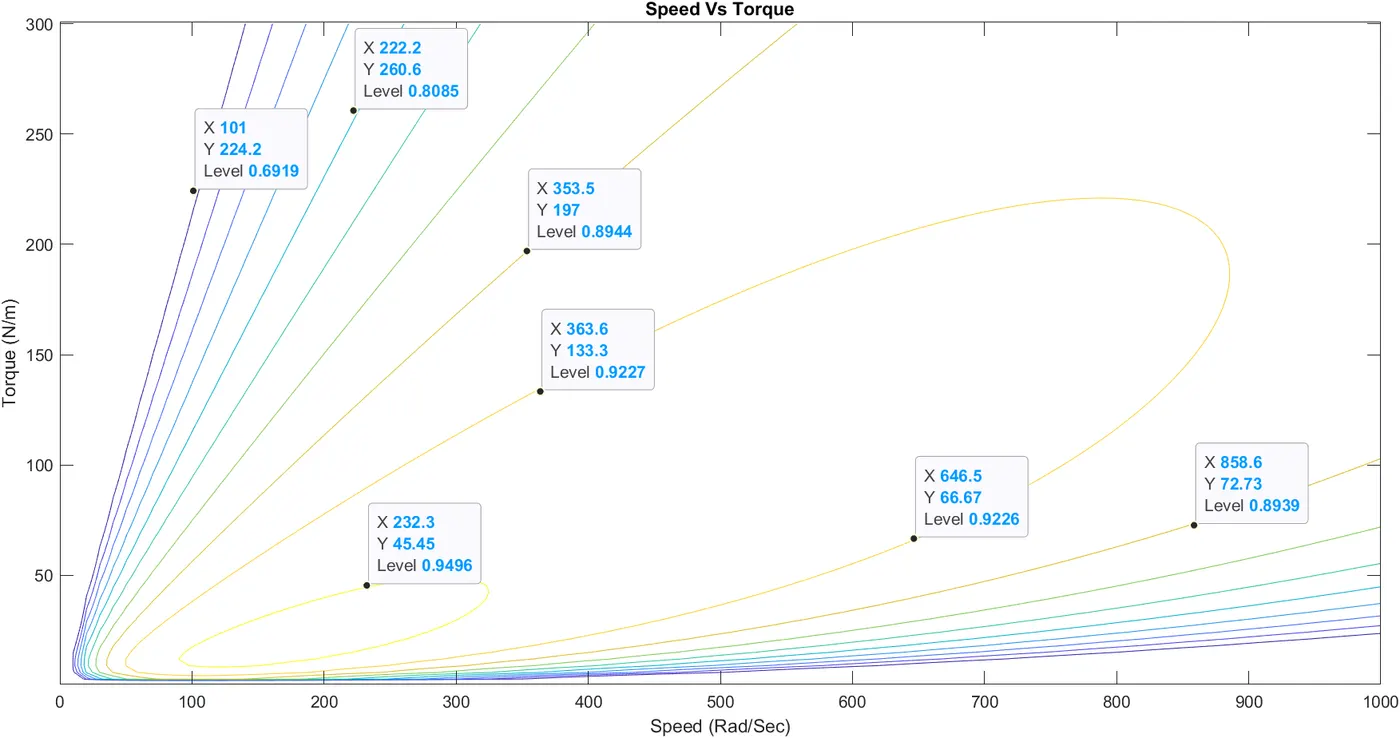
We can observe Speed(Rad /Sec) in X-axis and Torque(Nm) in Y-axis
Each contour represents Efficiency. Some of the values are displayed with the data cursor in the plot.
CONCLUSION
1. The Braking energy required for a drive cycle is calculated using an excel plot.
2. The reasons for electric motor couldn't develop braking torque at high speed similar to starting is discussed and the coordination of electric and mechanical brakes is also described.
3. A MATLAB program is written to plot the contour of given motor speed, torque, and efficiency values.