Week-4 Challenge WOT Condition Part-2
1.Difference between mapped and dynamic model:
Mapped model:
In mapped model the data used for operation and stimulation are to be entered in a form of look up table and configured with the parts and the operation is performed.
Advantage: The analysis becomes easier because of the global based model.
Disadvantage: More data has to be collected.
Case study:
Engine:Engine efficiency could be stimulated with arrary of data interpreted in the system.
Motor:Motor specifications like rpm,efficiency,heat could be entered to obtain the stimulation.
Generator:Specifications like current,torque could be entered for stimulation.
Dynamic model:
In dynamic model it understands the behaviour of the components and it behaves accordingly.It gives detail analysis based on the real time operation.
Advantage:It operates on the situtation of components and collection of data not required.
Disadvantage:Could not stimulate according to our customized specifications.
Case study:
In dynamic model the real values and specification of engine,motor and generator are entered for the stimulation.
Changing model type:
First we have to open the reference application of either Ev or HEV.The block diagram will appear.From the appeared block click on the block passenger car.From the appeared blocks select the generator block.
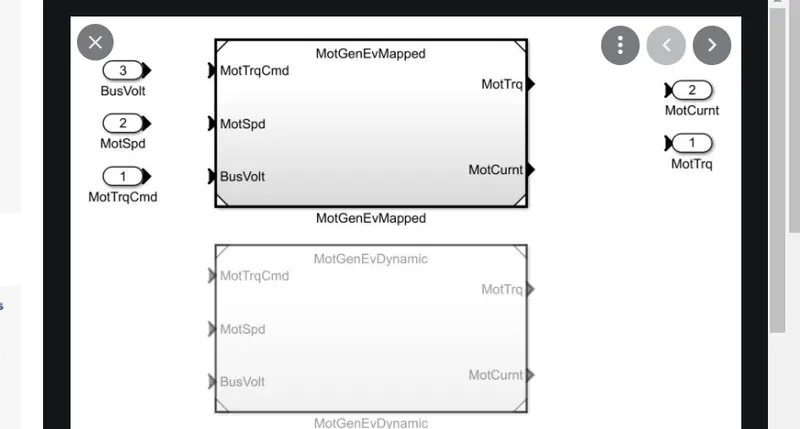
The above blocks will appear showing the mapped and dynamic model.
We can change the model by following the simple steps.
- Choose the block we need to configure.
- Select the variant manager option.
- Click on set us label modelactive choice.
By following these steps we can change the model type.
2.Calculating miles to gallon:
Factors considered during fuel flow:
- Battery power
- Fuel flow
Miles to gallon:
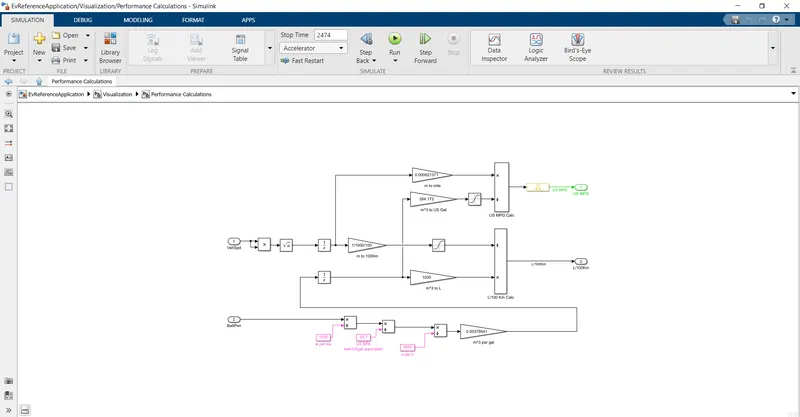
The above model is taken from EV reference application.The steps for converting miles to gallon are as follows,
First the miles value is converted into meter cube.
As we know that 264.172US gallon=1000L
The reference model is pure EV ,it only operates on the battery.So the fuel efficiency is calculated with the considerations of battery current and the velocity of the vechicle/kilometer.
Thus the fuel efficiency is calculated and convertd after the saturation.
3.HEV application-WOT drive cycle:
The model is stimulated for 30 seconds.
Performance scope of HEV-WOT
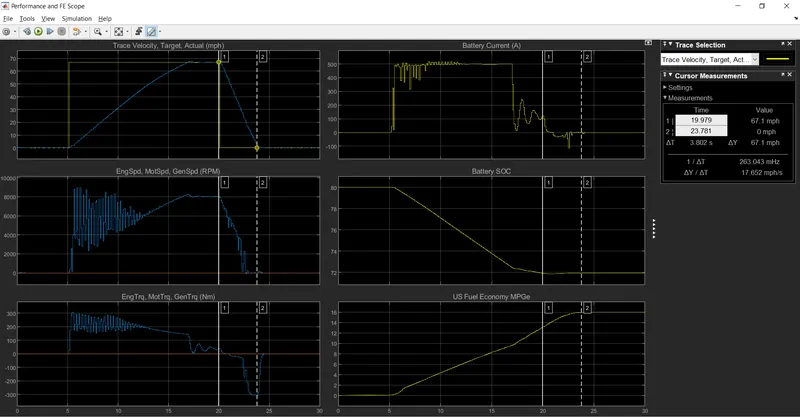
Observations:
Plot1(Traget velocity vs actual)-This plot gives the actual velocity with respect to vechicle velocity,Here it reaches 67.1mph.Here both actual and vechicle velocity tends to remain same.
Plot2(Eng speed,motor speed,Gen speed)-This plot gives the relation of engine and motor speedd.The same is given in rpm.
Plot3(Eng trq,motor trq)- This plot gives the value of battery and motor torque in Nm.
Plot4(Battery current)- This plot gives the plot of current in ampere.
Plot5(Battery SOC)- This plot gives the state of change of battery.It denotes the use of battery power during the velocity change.
Plot6(Fuel economy)-This plot gives the efficiency of the fuel in US miles per gallon.
Now we can change the wind and grade of the HEV from the environment block.
The performance then obtained is ,
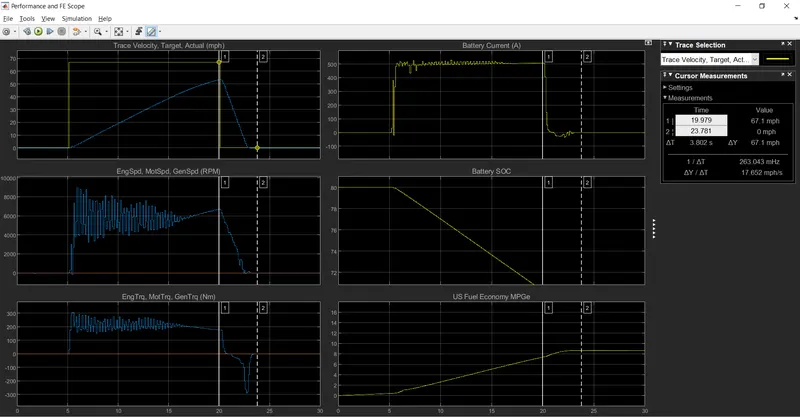
Observation:
Plot1(Traget velocity vs actual)-This plot gives the actual velocity with respect to vechicle velocity,Here it reaches 52mph.Here vechicle velocity is decreased because of the effect of wind and grade.
Plot2(Eng speed,motor speed,Gen speed)-This plot gives the relation of engine and motor speedd.The same is given in rpm.Here some flutuations are seen as the effect of wind.
Plot3(Eng trq,motor trq)- This plot gives the value of battery and motor torque in Nm.A multiple variation are seen in the graph.
Plot4(Battery current)- This plot gives the plot of current in ampere.Some fluation in current is seen as the result of wind.
Plot5(Battery SOC)- This plot gives the state of change of battery.It denotes the use of battery power during the velocity change.It remains same as that of the previous case.
Plot6(Fuel economy)-This plot gives the efficiency of the fuel in US miles per gallon.A mild change is seen in accordance with the previous case.
4.Compare EV and HEV:
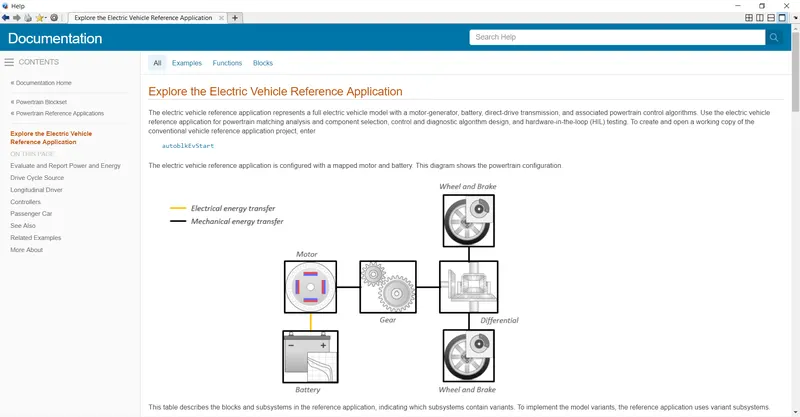
The model of a pure EV is as follows,
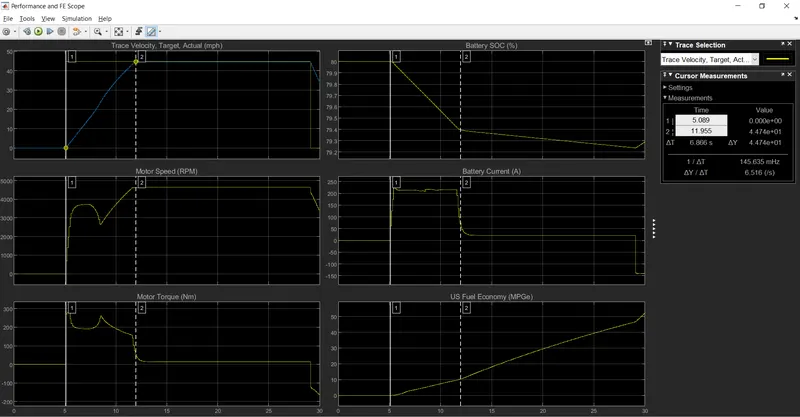
The performance of the EV with WOT cycle.
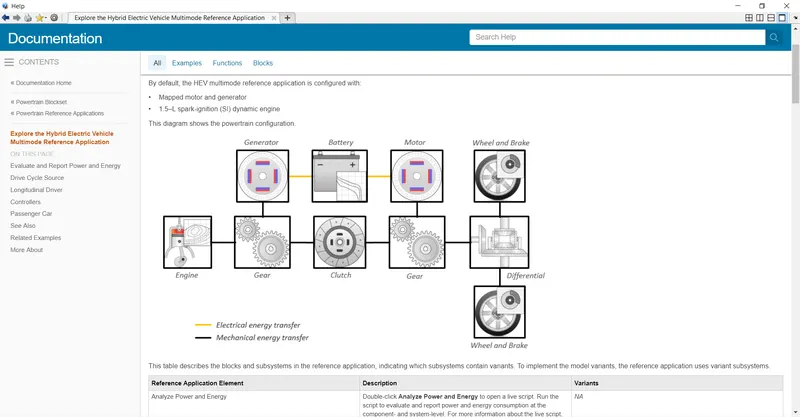
The model of HEV is as follows,
The performance of HEV with WOT cycle is,
The differance in the graph depends on the operation of the vechicle. Ev operates only on the battery and HEV operates on both engine and battery.As a result variation in the properties are seen in both the graph according to the change in property.