Week-3 Challenge: ADVISOR Tool
1.cargo mass-500 can vehicle travel 45kmph:
First we have to open the advisor tool from matlab.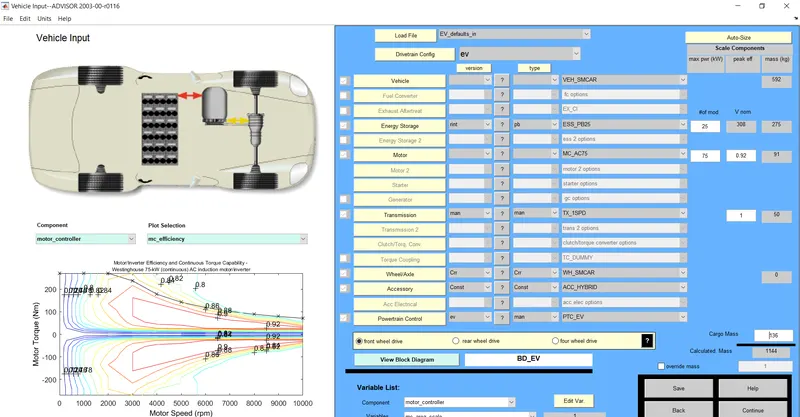
after opening it we have to select the EV default file from the drop down option.We have to change the cargo mass to 500 kg as given in the question.
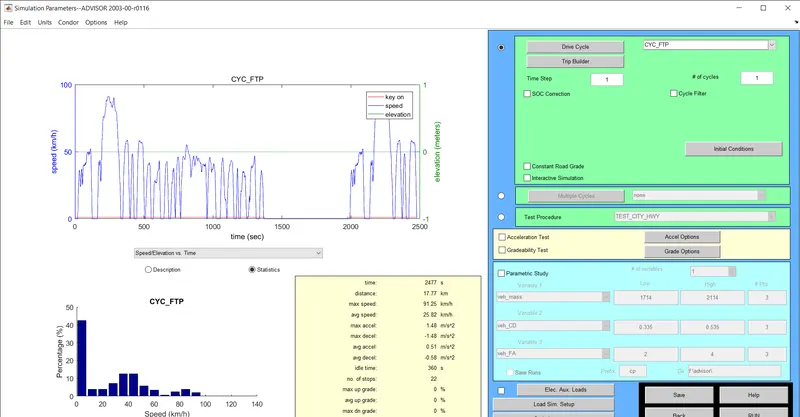
From the above option we have to select the FTP drive cycle and click run button.
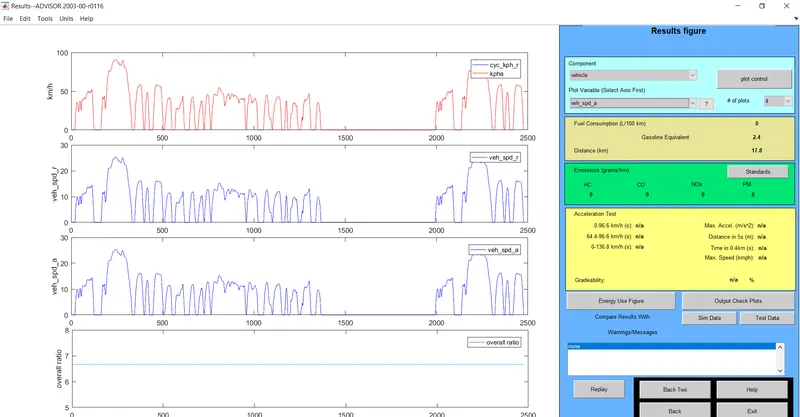
Above was the output of the advisor for 1 cycle the maximum distance covered is 17.8km
For 2 cycles- 17.8km
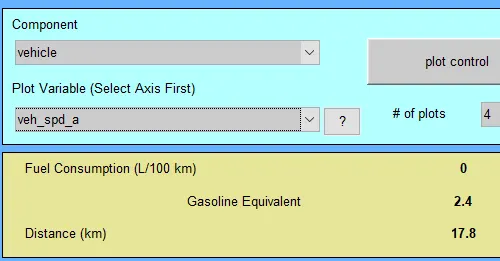
For 3 cycles-35.5km
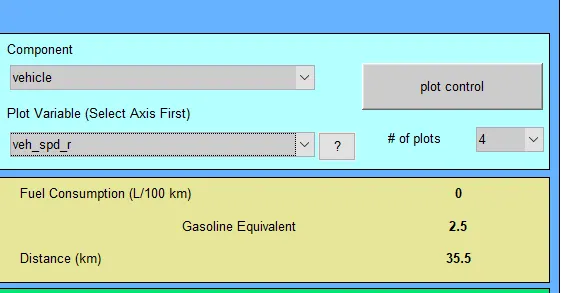
For 5 cycles-41.4km
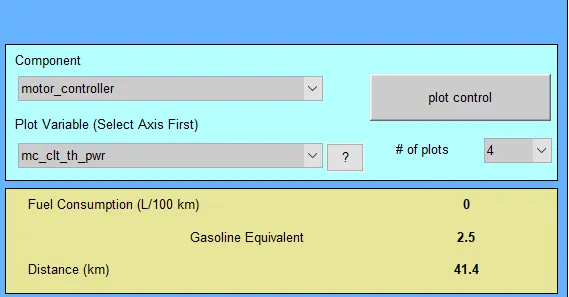
From the above interferance we can say that the vehicle cannot reach 45km. As the cargo mass increaes the speed of the vehicle decreases.
2.Changing battery capacity:
We have to change the battery capacity from the normal value.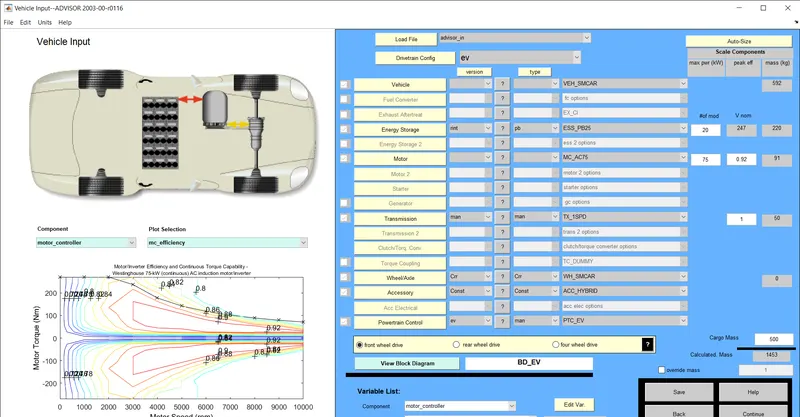
Here we have a changed the battery value to 20 and continued the stimulation with all other parameters to remain same with the previous simulation.
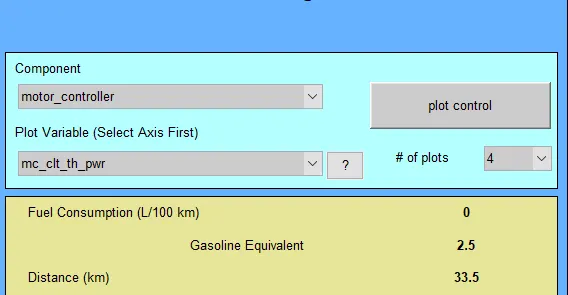
From the above table, we can see that the distance covered is 33.5km for 5 cycles.It is clear that when the battery capacity decreased the distance covered is also decreased.
Now we change the battery value to 40.
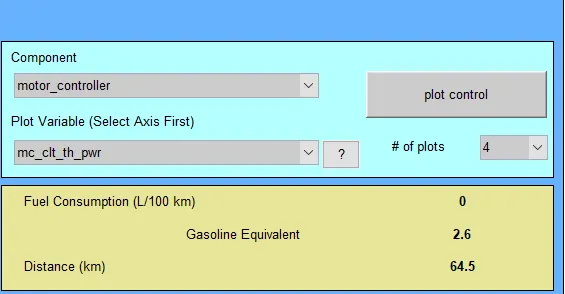
From the above table, we can see that the distance covered is 64.5km for 5 cycles.It is clear that when the battery capacity increased the distance covered is also increased.
From the above simulation we can conclude two important points.
- When the battery value decreased from the normal value the distance covered also decreased.
- When the battery value increased from the normal value the distance covered also increased
3.Gradibility test for Prius_jpn:
First we have to open the advisor from matlab.Then we have to select the Prius jpn file from the drop down.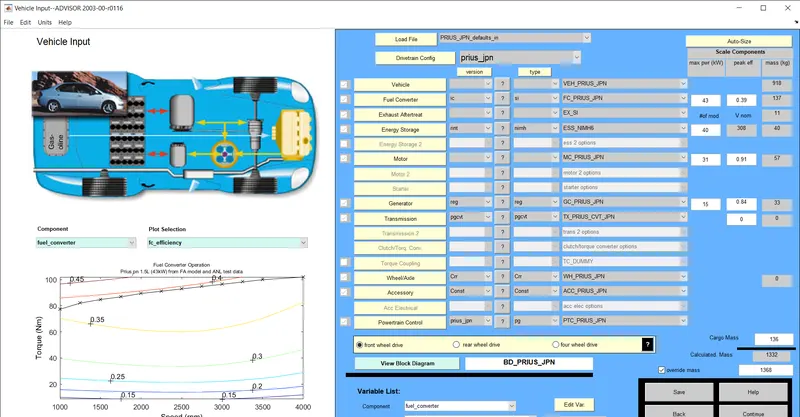
After selecting the car we can proceed to next step .In the next page we can select any drive cycle of our wish.We have to select the gradibility test option and a gradibility option will open.
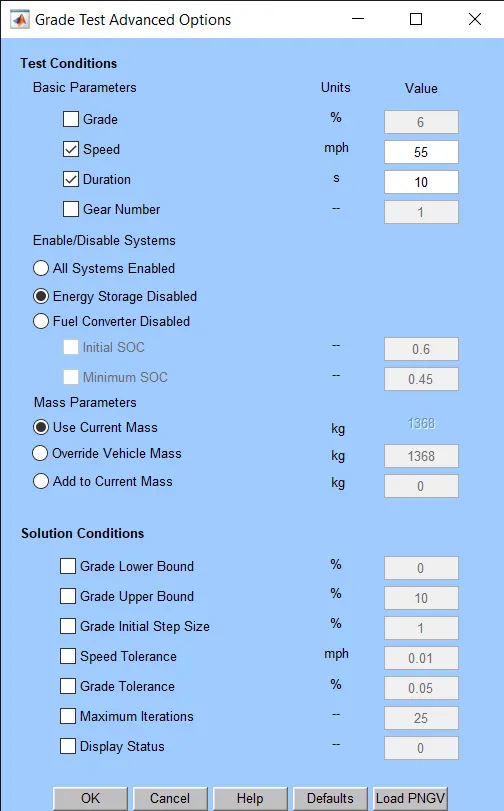
we can keep all the parameters with the standard value for the first stimulationand click ok and run the stimulation.
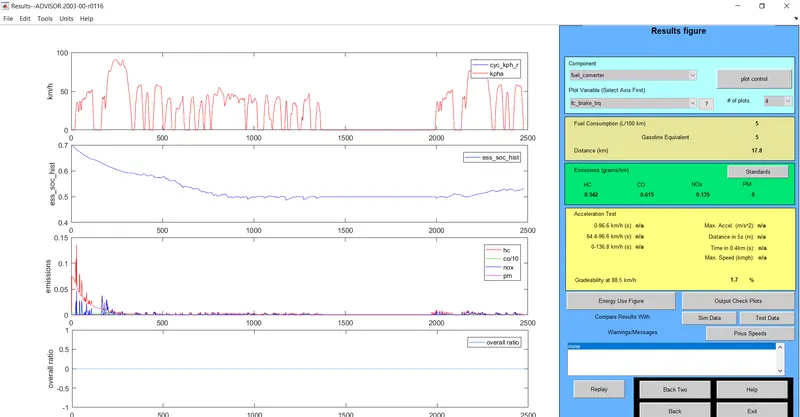
From the output we can see the result of gradibility displayed in percentage.Now we can change the speed value from the gradibility option and observe the output of the gradibility percentage.
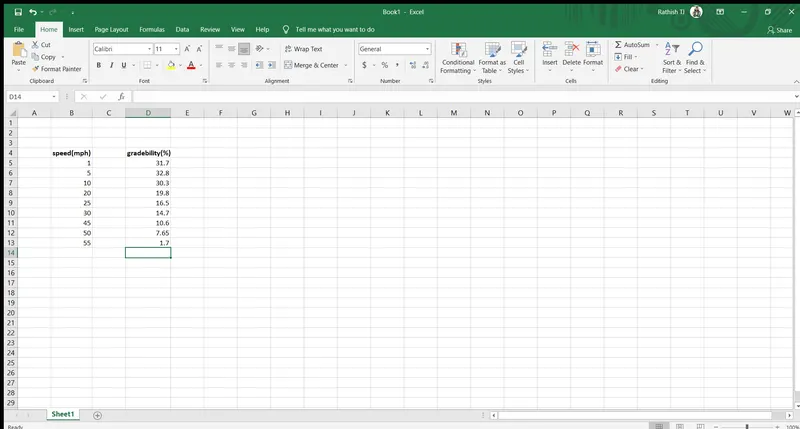
The above table gives the relation between the speed of the vehicle (mph) and the gradibility percentage.
From the table ,we can conclude,
When the speed of the vehicle increases the percentage of gradibility decreases.