Week-4 Challenge WOT Condition Part-2
- What is the difference between mapped and dynamic model of engine, motor and generator? How can you change model type?
EXPLANATION: A mapped model is a model with pre-assigned data in lookup table where the output values are readily available for input values.
A dynamic model is model which can perform for realtime operations with random input .A mapped model is quicker than dynamic one Because it does not simulate for realtime values.
The difference between the models are the mapped model functions similar to lookup tabes nut dynamic model use the real time simulation for output.
Steps to change the models are:
1) Click the passenger block diagram.
2)Click the Electric plant diagram then click the motgenEV block
3) Right click on the screen there shows a variant then click the variant and change the mapped model into dynamic model
Image for step 1 & 2


Image for step 3:
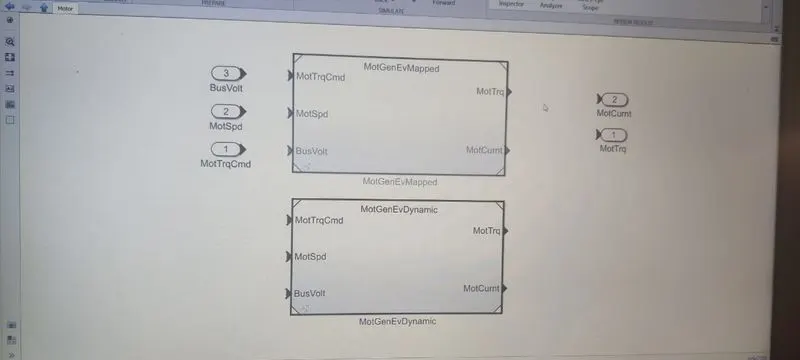
Thus the above images has shown how to change the mapped model to Dynamic model
How does the model calculate miles per gallon? Which factors are considered to model fuel flow?
EXPLANATION: miles per gallon means for how many miles does vehicle can travel for one gallon which is 3.8 litres .In electric vehicle no of miles is consider as a range of vehicle .As a figure shows that battery power input kw is converted to m^3 per gallon which is integrated and the output is given.
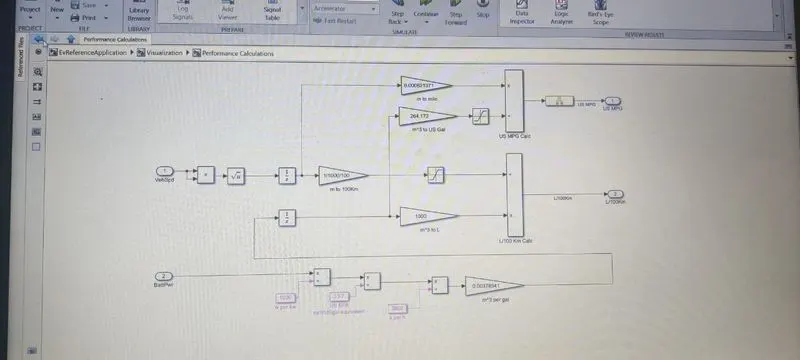
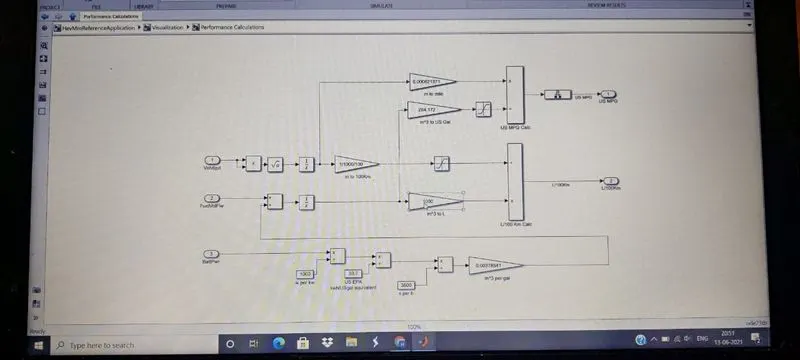
FOR HEV VEHICLE:
As for Hybrid case there are three inputs for one output which is mileage.The vehicle speed is calculated like integration of speed with respect to time and fuel rate in m^3 litres which gives in US MPG.
Vehicle speed and battery power are the Main factors to consider fuel model. Both Battery power and Vehicle speed are taken as input to obtain (L/100) which is amount of fuel required to run the vehicle for 100KM.
3.Run the HEV ReferenceApplication with WOT drive cycle. Change the grade and wind velocity in the environment block. Comment on the results.
EXPLANATION:Aim is to change the grade and wind velocity values as for initial case both values are 0.The conditions are shown below,

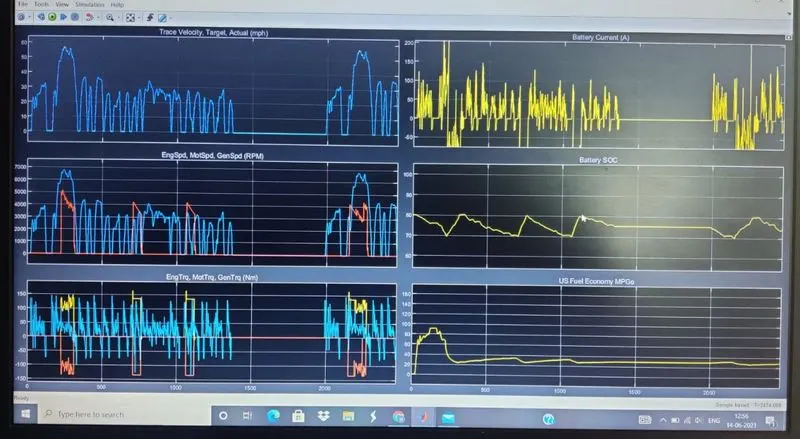
By keeping those two values as zero the result are:
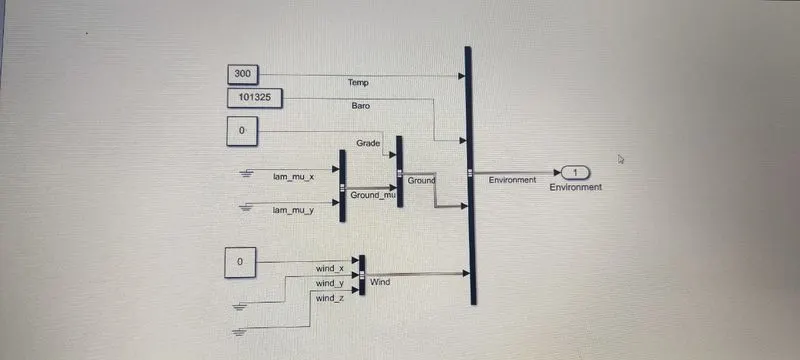
case: wind velocity and Grade are 15:
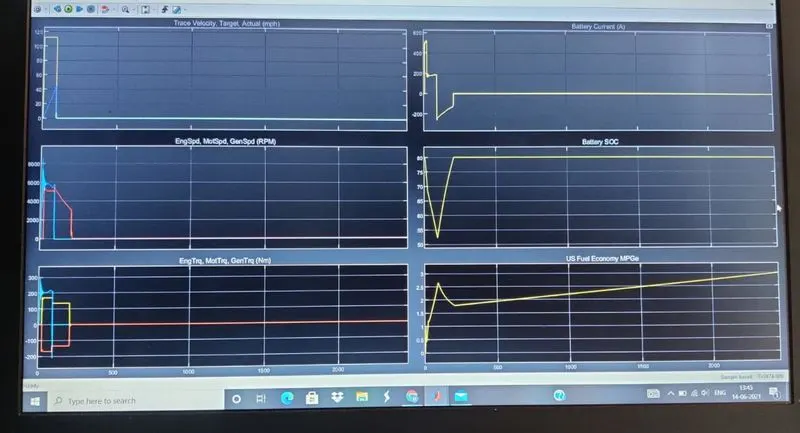
As for the first case :
To attain maximum speed for grade and wind velocity 0 , it keeps on increasing and decreasing at the time 15 th second it get attains it maximum speed and the graph keep on changing by increasing and decreasing at 55 th second it get constant for sometimes till 80 th second.for grade and wind velocity it attains it maximum speed at 4-5s and it get decreased to zero for next second.so the total duration is for approximately 10 seconds.
As for the second case:
The speed of motor is varying for some times when it achieved constant speed it drops to zero for above values.It reached the maximum speed with 6 seconds which is 6000 RPM. for first case it keeps on varying and then only drops to zero.
As for the third case:
For the third part there is also negative values because of torque is produced due to speed of vehicle not by motor.The motor is giving high torque for attaining high speed,then it drops down to zero .
As for fourth case:
The current is increasing due to speed increasing beacuse current consumed by motor is high at the time of maximum speed.Then it decreasing to negative and reaches to zero because of regenerative braking take placed and reaches to zero.
As for fifth case:
The state of charge(SOC) is decreased because of battery charge is used for attaining the top speed.After achieved its top speed requirement of charge is less so it become constant.
As for sixth case:
At initial time need of fuel is more to attain maximum speed.After that need of fuel is not much needed so the graph keeps on increasing.
4) Keeping all other parameters same, compare the simulated results of hybrid and pure electric powertrains.
EXPLANATION: The main difference between the hybrid and electric vehicle are all the blocks are same.but there will be no engine block inside EV model.
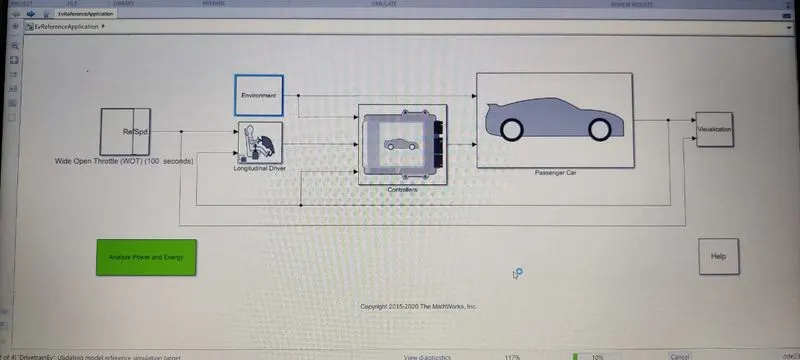
The output graph for EV is for grade 15 and wind velocity 15:
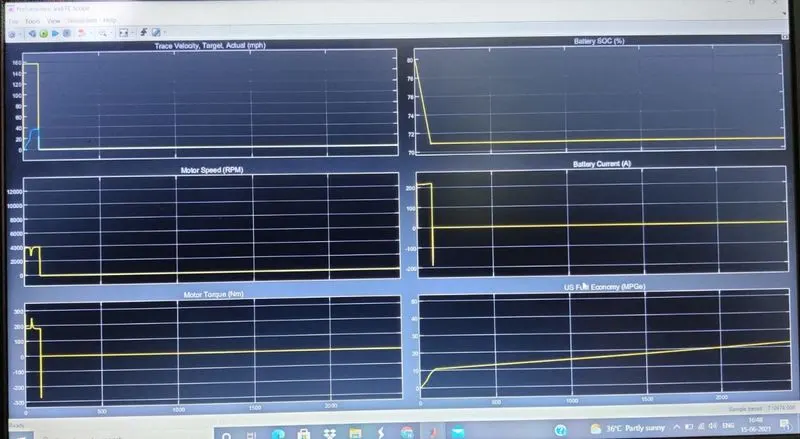
As for first part : The top speed is achieved more faster than HEV ,where HEV takes mor than 15 seconds to achieve top speed but ev takes 9 seconds to achieve the speed.
As for second graph:
Ev attains the RPM at on instant itself which is far better than HEV and graph obtained by EV is also smooth.
As for third graph:
The motor torque is same as like HEV but the difference is droping negative and zero time is fast so the it require high torque for sometimes only.Then it goes to negative due torque produced by vehicle speed.
As for fourth case:
The SOC battery is get reducing for sometimes then it becomes to constant.Because the vehicle demand the high charge for initial condition as like HEV case for our case.
As for fifth and sixth case:
Battery Charge is same as like torque case which reduced due to after vehicle attains speed so after that actions it demands less charge from battery.But in HEV case the graph decreased and get constant because of engine.In sixth case fuel efficient is low because it is pure Ev.It attain constant value before HEV attains. So consumption of fuel is also low.