Week-4 Challenge WOT Condition Part-2
AIM:
To explain the following:
- What is the difference between mapped and dynamic model of engine, motor and generator? How can you change model type?
- How does the model calculate miles per gallon? Which factors are considered to model fuel flow?
- Run the HEV ReferenceApplication with WOT drive cycle. Change the grade and wind velocity in the environment block. Comment on the results.
- Keeping all other parameters same, compare the simulated results of hybrid and pure electric powertrains
OBJECTIVE:
- Provide proper explanation to the appropriate questions
- Solve the given calculation by using the related formulae
- Display the results by run the required model
- Make a comparison and show the results
1. DIFFERENCE BETWEEN MAPPED AND DYNAMIC MODEL OF ENGINE, MOTOR AND GENERATOR
Lookup Table:
- The lookup table is a block in simulink, that we can helps to create a model by putting a data in to the lookup table
- In this lookup table library, we have different types of lookup table like 1-D, 2-D, 3-D, n-D which are used by giving the inputs as per the dimension
- For example, by putting the appropriate data into lookup table, we can find the output of brake torque by giving the input of brake
- The benifits: During the calculation of complex equations of physical phenomenon, we face some issues and it may lead to waste more times on it. At the time, we can use the either choice of lookup table for calculate the equations (It happens at the back end). By this way, we can also save the runtime
For Engine:
Mapped Model
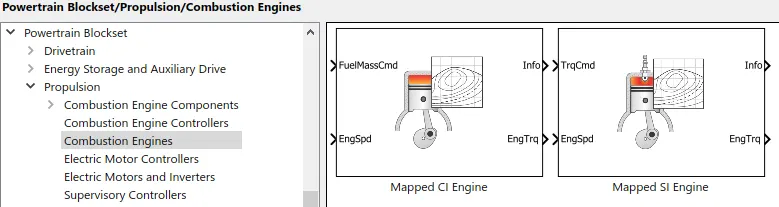
- Usually mapped models are basically comes with the lookup tables. In this models a set of steady state lookup tables which are used to characterize the engine performance
- This mapped engine block gives an output as per the input which are mentioned in the data set were we put in the lookup table
- This tables provide overall engine characteristics such as actual torque, fuel flow rate, BSFC, and engine-out exhaust emissions
- Above picture has the mapped blocks for CI and SI engines in the section on powertrain blockset of simulink library
- This mapped blocks has only used if there is any data set available for the appropriate models. Otherwise we can move up with the dynamic models
-
You can use the block for:
1. Hardware-in-the-loop (HIL) engine control design
2. Vehicle-level fuel economy and performance simulations
Dynamic Model
- In the dynamic blocks, there is no need to use the previous dataset or anything. It's only provides an output based on the on-time input like which is not pre-defined as before
- Model decomposes the engine behavior into engine characteristics that are separated into lower-level components. By combining components in this way, the models capture the dynamic effects
For Motor:
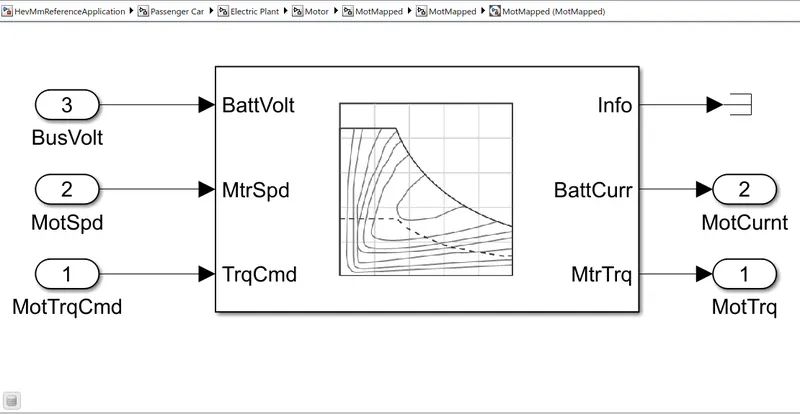
Mapped Model
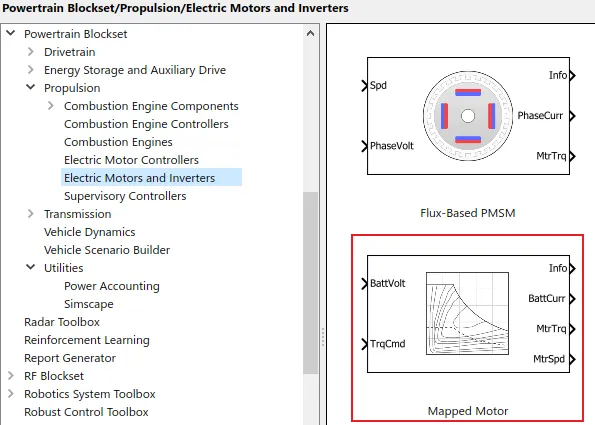
- Here the mapped motor block has usually used in EV, HEV, etc which is replaced for IC engine or works together with IC engine
- This mapped block has receives an input from the lookup table which has feeded with the previous dataset
- The Mapped Motor block implements a mapped motor and drive electronics operating in torque-control mode
- The output torque tracks the torque reference demand and includes a motor-response and drive-response time constant
- Use the block for fast system-level simulations when you do not know detailed motor parameters, for example, for motor power and torque tradeoff studies
- The block assumes that the speed fluctuations due to mechanical load do not affect the motor torque tracking
Following are the steps used to get through the 'motor mapped' subsystem,
HevMmReferenceApplication/Passenger Car/Electric Plant/Motor
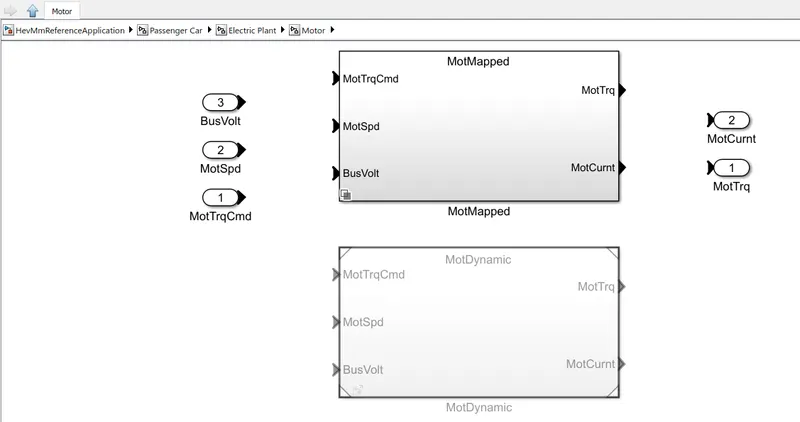
- Enter into the motor mapped block to reach the motor mapped block (lookup table)
Dynamic Model
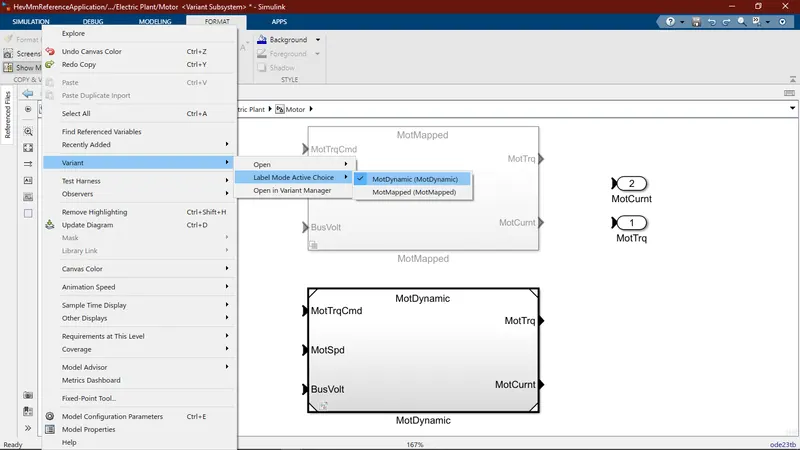
- By clicking the right side button on the canvas, following steps will be used to change the motor from mapped to dynamic
- In this way we can change the model type as per the requirement
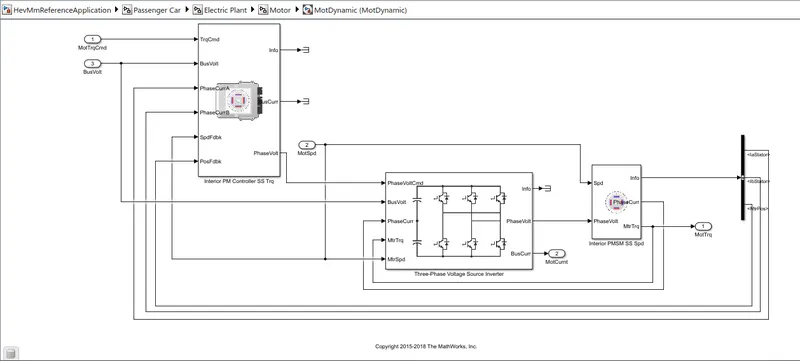
- By getting inside the motor dynamic block, we can reach the motor dynamic evaluation section
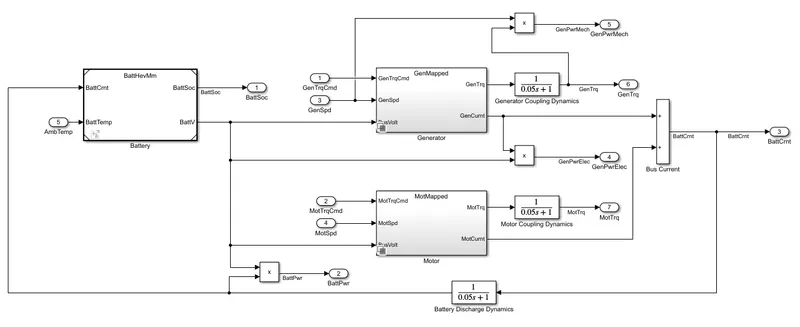
For Generator:
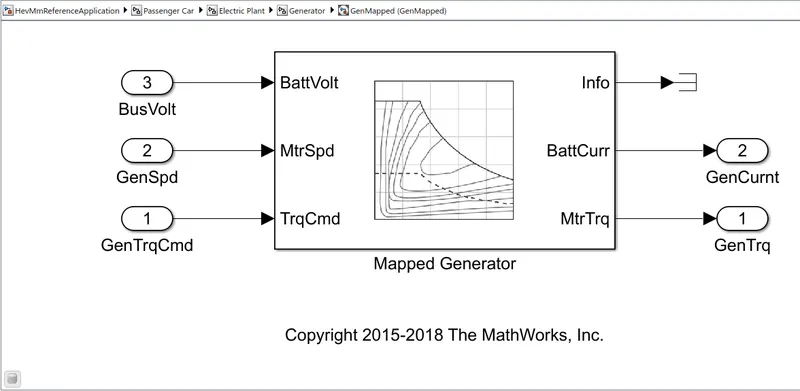
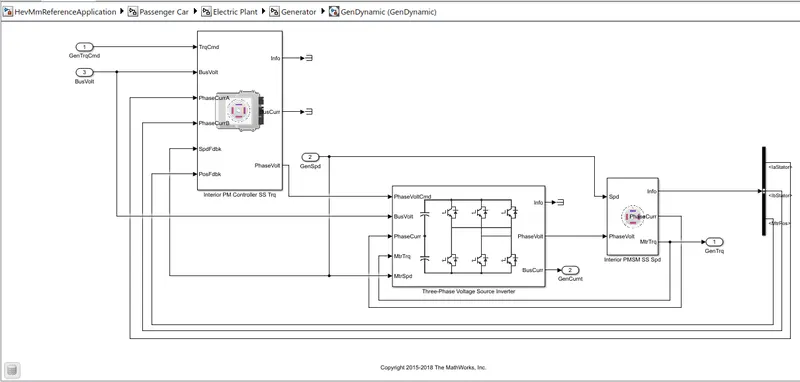
- Here the generator has called the another side of motor, because the motor has works as the generator when the regenerative braking mode got activated
- So that motor has similar to the generator even itr's in mapped or dynamic model
Mapped Model:
Dynamic Model:
2. HOW DOES THE MODEL CALCULATE MILES PER GALLON? WHICH FACTORS ARE CONSIDERED TO MODEL FUEL FLOW?
In the automobile miles per gallon (MPG) prediction is a typical "nonlinear regression problem", in which several automobile features are used to predict fuel consumption in MPG
MODEL:
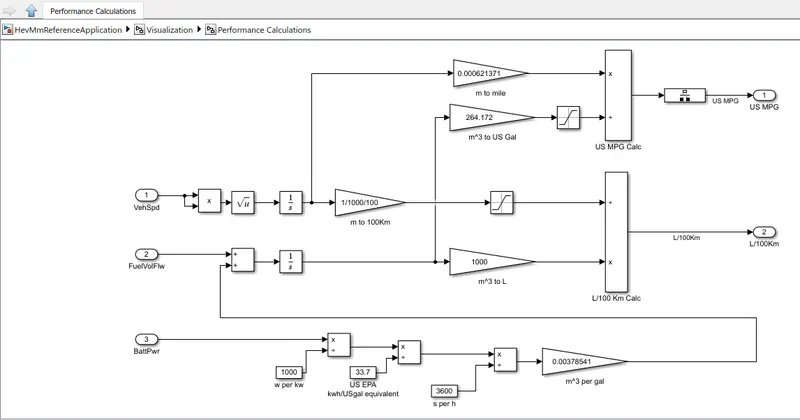
EXPLANATION:
- Here the vehicle performance has been calculated by the given pre-calculated inputs of vehicle speed, fuel volume flow and battery power
- Now we going to start with the battery power which has converted from watts to kilo watts per hour, so that we using the divide block for that calculation

- This block uses for both multiply or divide inputs. This outputs the result of dividing its first input by its second. And we going to continue this block for next two times for the varies calculation
- Here "US EPA" has takes places in the next role, which is stands for United States - Environmental Protection Agency. It's an independent executive agency of the United States federal government
- This EPA website provides access to several EPA databases to provide information tasked with environmental protection activities that may affect air, water and land
- So that they created an EPA’s Calculator to communicate the magnitude of GHG (Greenhouse Gas Equivalencies) emission reductions
- As per the standards, the value of 33.7 has divided with the output of previous calculation
- Then the output of US EPA calculation has divided with 3600 seconds and it's output passed to the gain block to multiplies the input by a constant value (0.00378541)
- Now the output of gain block has added with the pre-calculated value of fuel volume flow by sum block, then it passed to the integrator
- The integrator block has outputs the value of the integral of its input signal with respect to time

- On the same time, the pre-calculated value of vehicle speed has squared by product block then it's square rooted by sqrt block for neglect if any negative values cames. Then it passed to the integrator block for the integration
- Now the both integrated results of vehicle speed and fuel volume flow has passed to the next processes
- So that the vehicle speed side of output value has send to the gain block to multiplies by constant value (0.000621371) for converts the unit (metre to mile) and the fuel volume flow side value has passed to the gain block to multiplies by constant value (264.172) for converts the unit (m^3 to US gallon)
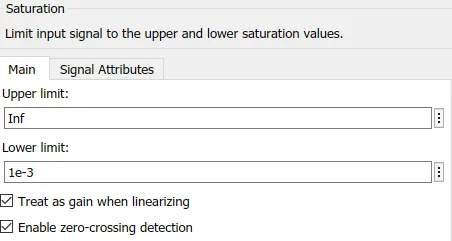
- Then the converted fuel volume flow value has gets into the saturation block to produes an output signal of the input signal bounded to the upper and lower saturation values
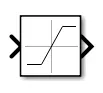
- The upper and lower limits are specified by the parameters Upper limit and Lower limit which are displayed below
- Finally, the both integrated results of vehicle speed and fuel volume flow has passed to the final calculation of 'US MPG' and calculated with using divide block
- And that output value has passed to the rate transition block to transfers data from the output of a block operating at one rate to the input of a block operating at a different rate
- So this way has used to calculates the performance calculation of miles per gallon and this way has also similar to find the kilometer per litre
3. RUN THE HEV REFERENCE APPLICATION WITH WOT DRIVE CYCLE. CHANGE THE GRADE AND WIND VELOCITY IN THE ENVIRONMENT BLOCK. COMMENT ON THE RESULTS
-
By default, the HEV multimode reference application is configured with:
1. Mapped motor and generator
2. 1.5–L spark-ignition (SI) dynamic engine
This diagram shows the powertrain configuration,
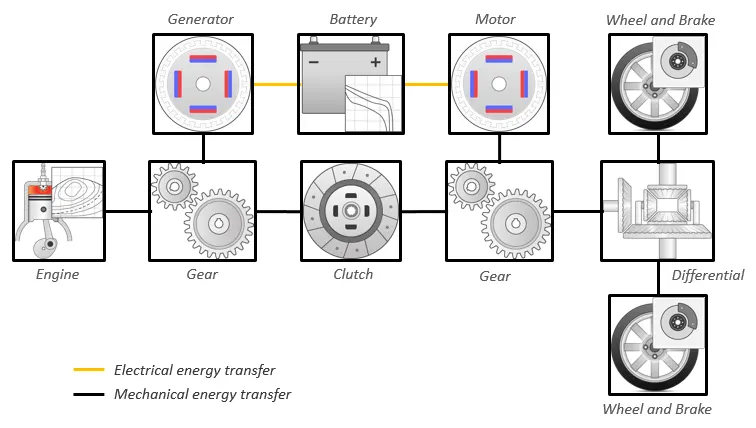
- The HEV reference application has now changed the initial input as "WOT drive cycle" with 5 seconds stop time
HEV MODEL:
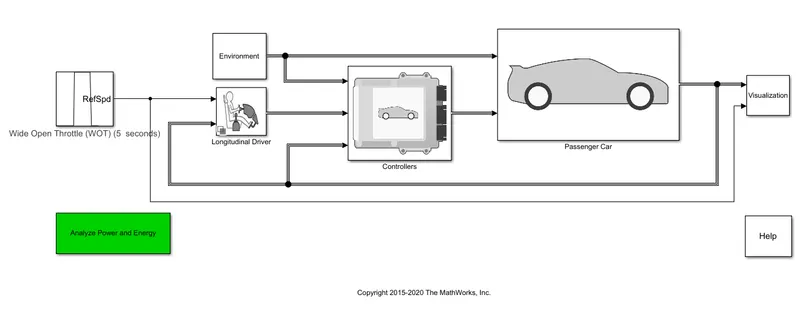
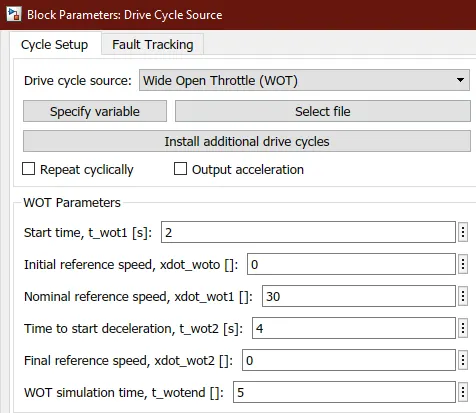
- The parameters values of WOT drive cycle has given by,
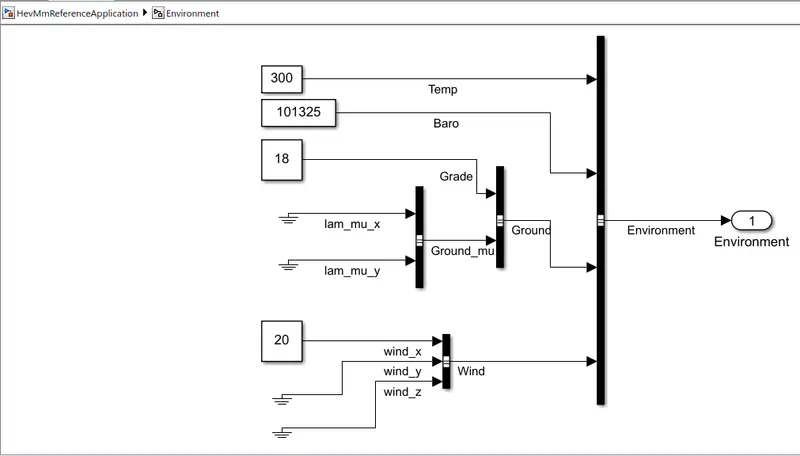
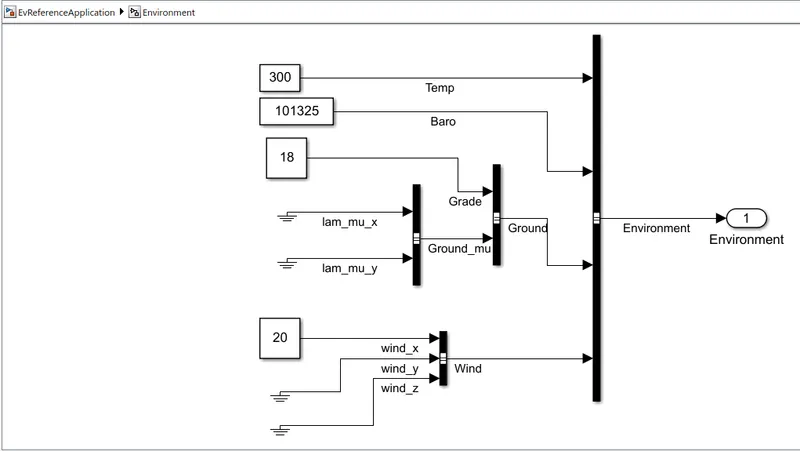
- Then the environment block has feeded with the gradeability and wind velocity as 18 and 20 as respectively
RESULT:
EXPLANATION:
- The HEV reference application has feeded the inputs of driver source cycle (WOT - Wide Open Throttle) with parameters changes from the default were displayed above
- Also the 'garde' and 'wind velocity' parameter values of environmental block values are provided as by assumption and the remaining blocks are left as be default
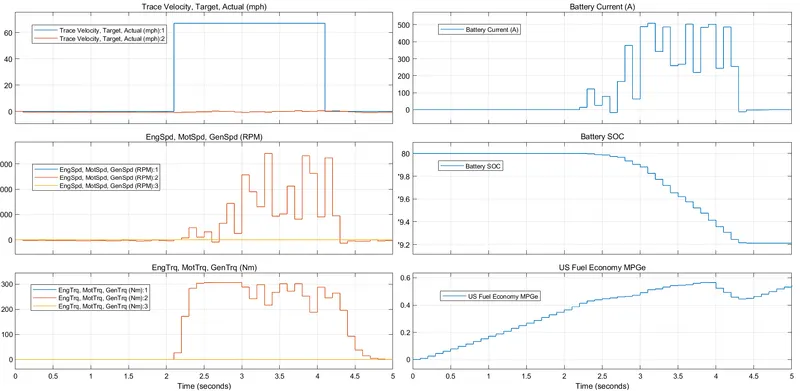
- After the program runs with stop time as 5 secs, the huge scope in the 'visualization' block has displayed the 6 major graphs of HEV
Following will explain about the graphs,
- Graph 1 - In the trace velocity graph, the actual (mph)-1 has actives from 2nd sec to 4th sec on above 60mph of velocity has achieved
- Graph 2 - In the engine, motor, generator speed graph, the RPM 2 has raised for 3 seconds at the rate of 6000 RPM above, after that it came back to the rest position
- Graph 3 - In the engine, motor, generator torques graph, the torque has raised above 300Nm for certain amount of seconds as per the given acceleration to the vehicle
- Graph 4 - In the battery graph, the current has fluctuated around 500amps at the time of vehicle acceleration, it's tells about the usage of current
- Graph 5 - In the Battery state of charge(SOC) graph, the charged battery got stabled from the beginning, but it cames gradually down when the acceleration given at the time of 2-4 secs to the vehicle, so that 0.8% of battery only got used at the time
- Graph 6 - In the US fuel economy graph, The MPG has got increased gradually from the beginning, at the acceleration time only it has slow downs it's gradually increasing of fuel economy. When the acceleration ends, again it back to increasing gradually it's fuel economy
4. COMPARE THE SIMULATED RESULTS OF HYBRID AND PURE ELECTRIC POWERTRAINS BY KEEPING ALL OTHER PARAMETERS SAME
- The electric vehicle reference application is configured with a mapped motor and battery. This diagram shows the powertrain configuration,
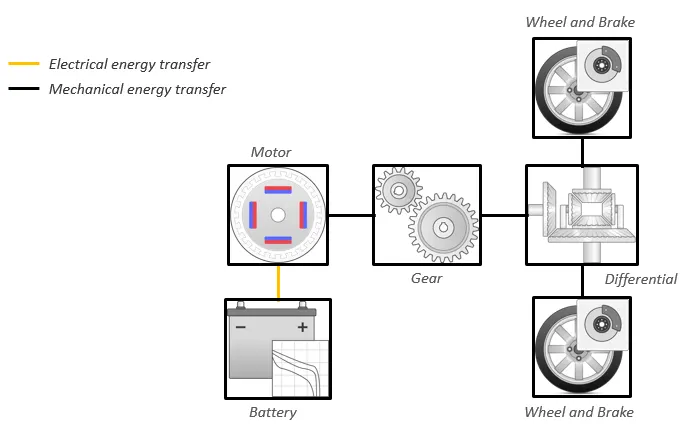
- The procedure of HEV model has followed here by the same and stop time: 5 secs,
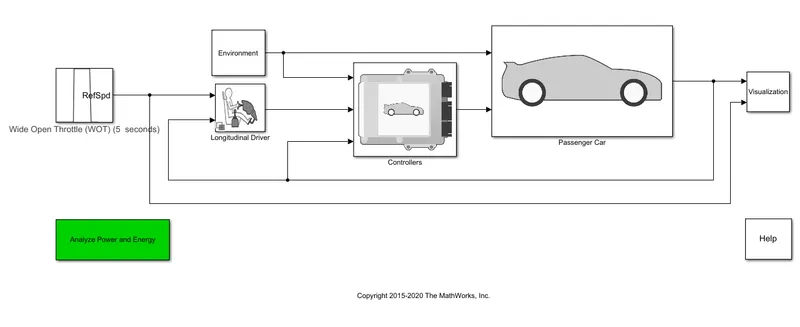
- Then the environment block has feeded the gradeability and wind velocity with the previous HEV model reference,
RESULT:
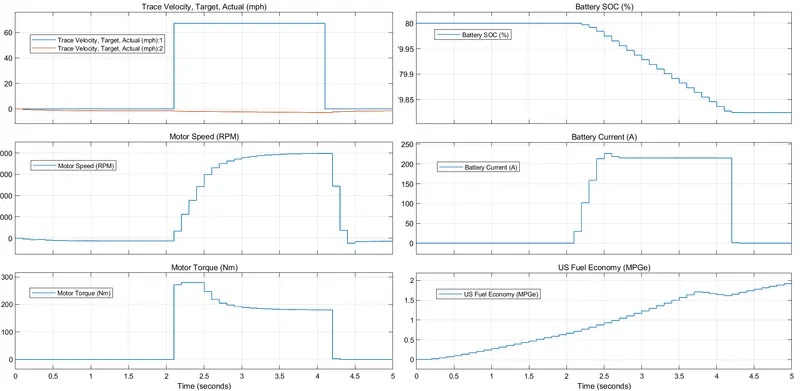
EXPLANATION FOR COMPARISON:
Following table has detailed about the HEV and EV comparison,
| SL.NO | LIST OF PERFORMANCE GRAPH | HEV | EV |
| 1 | Trace velocity, Target actual(mph) |
Actual(mph)1: The velocity goes high at the acceleration give time Actual(mph)2: Maintain it's rest position till the cycle ends |
Actual(mph)1: The velocity goes high at the acceleration give time Actual(mph)2: During the acceleration, it slightly goes below it's rest position |
| 2 | Motor speed(RPM) | Speed 2: This only gradually increased it's speed upto 6000 RPM during the acceleration time | The speed of EV motor has increased gradually same as HEV, but it reached only 4000RPM speed. After the acceleration ends, it got sudden speed down |
| 3 | Motor torque(Nm) | Torque 2: During the acceleration, the torque has fluctuated upto 300Nm, then it's gradually got slow down | On acceleration, torque has raised upto ~280Nm, but it gradually slow down for 1 sec, after that it maintains the torque level ~180Nm for next 1 sec |
| 4 | Battery SOC (%) | During the acceleration, the battery storage usage: 80 - 79.2%, which means it has used 0.8% of battery power | During the acceleration, the battery storage usage: 80 - 79.8%, which means it has used 0.2% of battery power |
| 5 | Battery current (A) | Upto 509amps has reached during the acceleration and it fluctuated till the acceleration ends | Upto 226amps has reached during the acceleration and maintained a stable usage till the acceleration ends |
| 6 | US Fuel economy (MPG) | By comparing the both fuel economy, HEV is higher than EV in this limited time of analysis | By comparing the both fuel economy, EV is lower than HEV in this limited time of analysis |
REFERENCES:
- US EPA - https://www.epa.gov/energy/greenhouse-gases-equivalencies-calculator-calculations-and-references
CONCLUSION:
- Mapped and dynamic models of varient system has learned successfully
- Model calculation of miles per gallon has explained with the help of US EPA references
- HEV Reference Application with WOT drive cycle and changes in parameters has simulated well
- Comparison of simulated results of hybrid and pure electric powertrains has achieved