Week-4 Challenge WOT Condition Part-2
1. What is the difference between mapped and dynamic model of engine, motor and generator? How can you change model type?
Ans:
| Mapped model of engine | Dynamic model of engine |
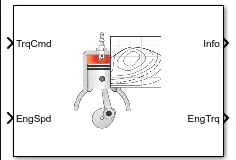 |
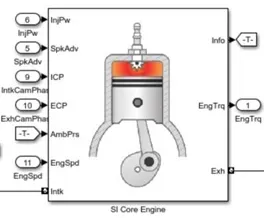 |
|
|
|
|
|
|
|
|
|
|
| Mapped motor | Dynamic motor |
 |
 |
|
|
|
|
|
|
| Mapped generator | Dynamic generator |
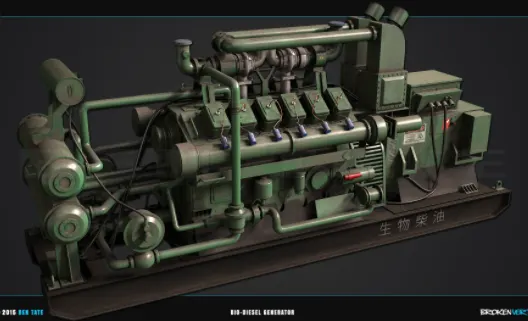 |
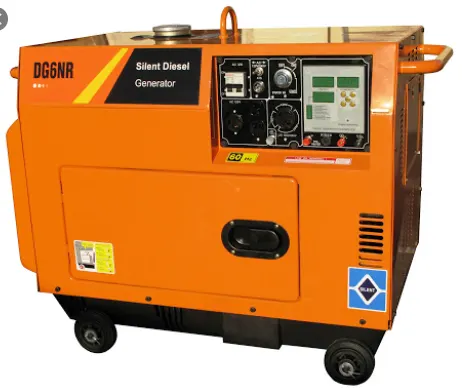 |
|
|
|
|
|
|
Changing model type from Mapped to Dynamic and Dynamic to Mapped:
- In the reference application of HEV model where the mapped model is used in the passenger blockset. Below that dynamic model also present but it was comment out.
- If we want dynamic model then we need to comment out the mapped model.
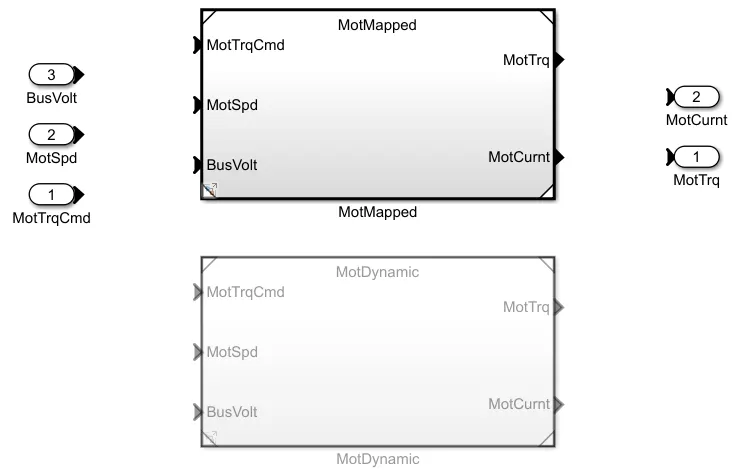
- When we double click on the passenger car we are getting one electric plant block in side that we getting below block
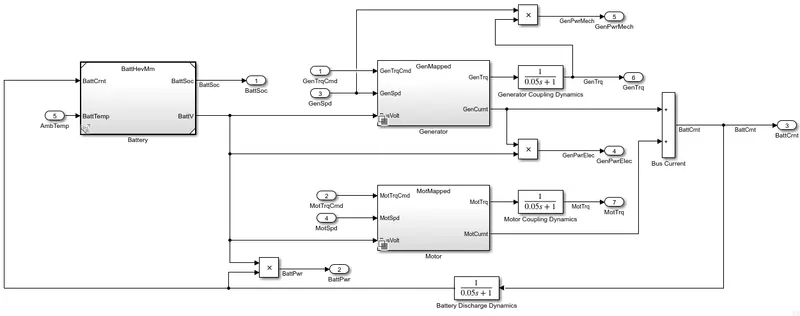
- If we want to change motor mapped to motor dynamic we need to right click on the motor mapped block and select variant option from that we select label mode active choice where we getting the changing option of mapped to dynamic and dynamic to mapped.
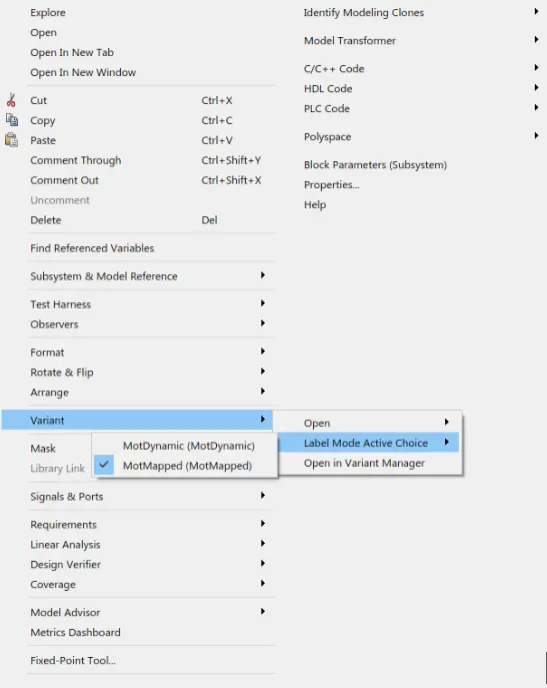
Like that we changing the model from Mapped to Dynamic and Dynamic to Mapped.
----------------------------x-------------------------------------------x-----------------------------------
2. How does the model calculate miles per gallon? Which factors are considered to model fuel flow?
Ans:
Miles per gallon is a fuel economy rating followed in some countries in order to establish a relationship between fuel consumed and distance travelled by a vehicle.
Open any vehicle model available in the powertrain blockset, here we have opened the Electric Vehicle reference application.
In that double click on the visualization block and agin double click on the performance calculations we got calculation blocks as shown in below:
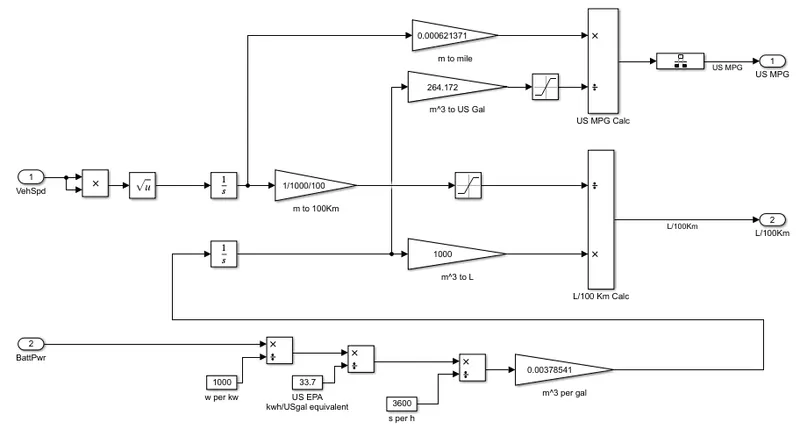
Inputs:
Vehicle Speed:
- In the vehicle speed we can see that there is conversion happening, when we multiply speed with integration will get distance in miles. And converting it into km by dividing 1000.
- Then that is fed to two blocks i,e L/100 block and US MPG block, In the US the MPG is calculated in miles.
- Here we calculating the amount of fuel required to travel 100 kms, and also distance covered for USMPG then these results are compared.
Battery Power:
- The initial battery power is in watts hence we converting int into kw by dividing 1000, then we have converted it into kwh again dividing 3600, after that converted into m^3 gallon by multiplying the factor of 0.00378541, then we integrate to convert m^3 to L with multiplying factor of 1000.
- Then it is converted into US gallon by multiplying 264.172 factor to get m^3 to gallon. Then integrated distance is converted into miles and fed it to US MPG block.
- This is again converted to 100km and fed to the L/100 km block, these results are then used for comparision.
- Finally, the distance measured and the energy flow are calculated and they are divided to get the result in miles/gallon.
Factors considered to model fuel flow:
- It should have low ignition temperature.
- It should produce very small amount of residues such as ash.
- It should have large calorific value.
- It should not produce gases which pollute the air.
------------------------------------x------------------------------------------x-------------------------------
3. Run the HEV Reference Application with WOT drive cycle. Change the grade and wind velocity in the environment block. Comment on the results.
Ans:
Powertrain Configuration:
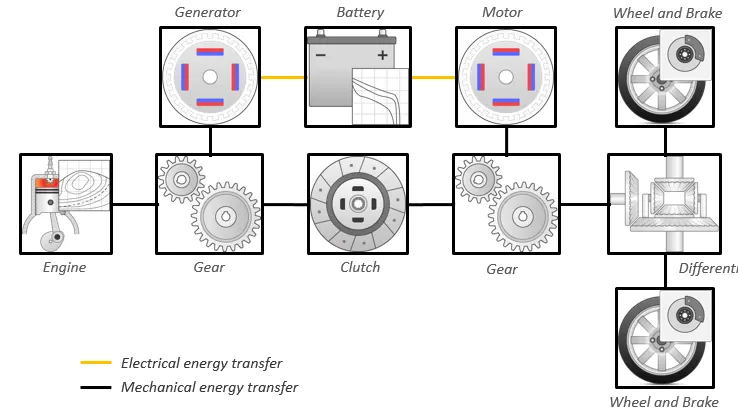
- The hybrid electric vehicle reference application represents a full multimode hybrid electric vehicle (HEV) model with an internal combustion engine, transmission, battery, motor, generator, and associated powertrain control algorithms.
- Use the reference application for powertrain matching analysis and component selection, control and diagnostic algorithm design, and hardware-in-the-loop (HIL) testing.
- To create and open a working copy of the hybrid electric vehicle reference application project, enter By default, the HEV multimode reference application is configured with:
- Mapped motor and generator
- 1.5–L spark-ignition (SI) dynamic engine
HEV reference application using matlab documentaion:
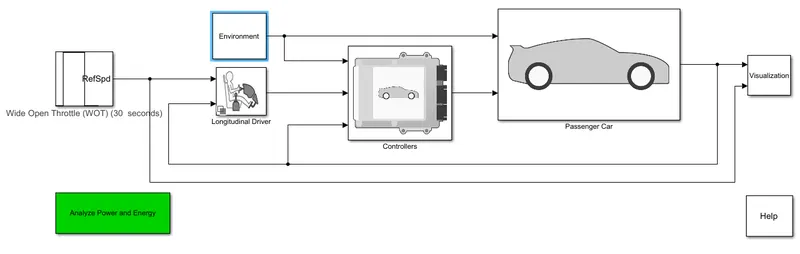
- The hybrid electric vehicle (HEV) multimode reference application represents a full multimode HEV model with an internal combustion engine, transmission, battery, motor, generator, and associated powertrain control algorithms.
- Use the reference application for powertrain matching analysis and component selection, control and diagnostic algorithm design, and hardware-in-the-loop (HIL) testing.
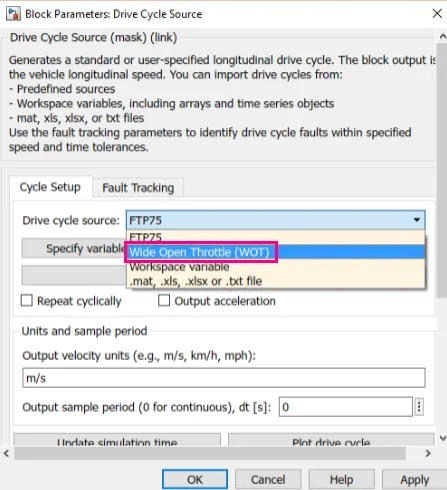
Changing of Driving cycle from FTP75 to Wide Open Throttle:
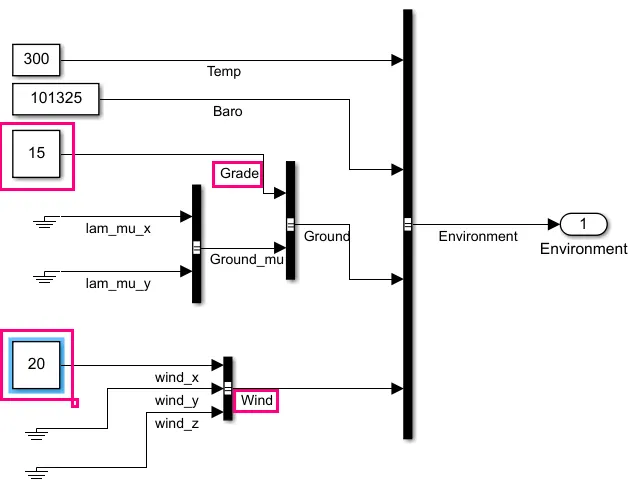
To change the Grade and Wind velocity we need to double click on the environment block after that subsystem of environment will open from there we changed the grade and wind velocity. The below image shows the changing of grade and wind velocity :
Explaination:
Drive Cycle source block:
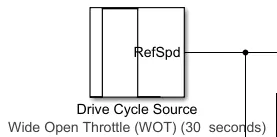
Generates a standard or user-specified drive cycle velocity versus time profile. Block output is the selected or specified vehicle longitudinal speed.
Environment Subsystem:

Creates environment variables, including road grade, wind velocity, and atmospheric temperature and pressure.
Longitudinal Driver System:
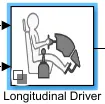
Uses the Longitudinal Driver or Open Loop variant to generate normalized acceleration and braking commands.
-
Longitudinal Driver variant implements a driver model that uses vehicle target and reference velocities.
-
Open Loop variant allows you to configure the acceleration, deceleration, gear, and clutch commands with constant or signal-based inputs.
Controllers Subsystem:
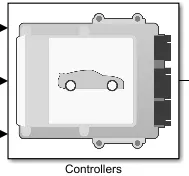
Implements a powertrain control module (PCM) containing a hybrid control module (HCM) and an engine control module (ECM).
Passenger car Subsystem:
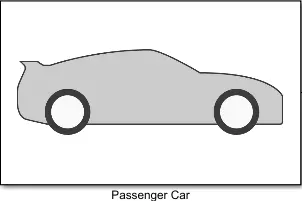
Implements a hybrid passenger car that contains engine, electric plant, and drivetrain subsystems.
Visualization Subsystem:

Displays vehicle-level performance, battery state of charge (SOC), fuel economy, and emission results that are useful for powertrain matching and component selection analysis.
Analyze Power and Energy:
Double-click Analyze Power and Energy to open a live script. Run the script to evaluate and report power and energy consumption at the component- and system-level. For more information about the live script, see analyze power and energy.
Output of the Simulation:
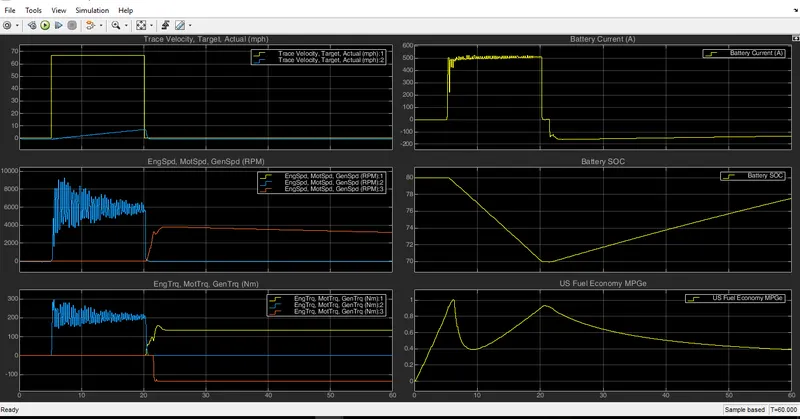
- The first plot shows that Trace velocity and Target actual. In that the acceleration period starts from 5 seconds to 20 sec. Due to the grade and wind velocity the vehicle cannot reached its top speed.
- From second plot it shows that speed of engine, motor and generator. During acceleration period the speed of motor increases due to increase in acceleration.
- From third plot shows that torque of enginr, motor and generator. In that the motor torque increases with increase in motor speed and engine torque increases after reducing the motor torque.
- The fourth plot shows that current taken by the battery in that during acceleration period only the battery gives supply to the motor.
- The fifth plot show that SOC of battery. In that the SOC of battery reduces from 80 to 70 during acceleration period.
- The sixth plot shows that Fuel economy in that at starting it uses fuel and during acceleration it will reduces.
---------------------------x-----------------------------------------x-----------------------------------
4. Keeping all other parameters same, compare the simulated results of hybrid and pure electric powertrains.
Ans:
Block diagram of EV reference application:
- The electric vehicle (EV) reference application represents a full electric vehicle model with a motor-generator, battery, direct-drive transmission, and associated powertrain control algorithms.
- Use the electric vehicle reference application for powertrain matching analysis and component selection, control and diagnostic algorithm design, and hardware-in-the-loop (HIL) testing.
Here we also changed the drive cycle from FTP75 to Wide Open Throttle as we did in HEV multimode reference documentation.
Here also we changed the Grade and wind velocity of 15 and 20 respectively.
After double clicking the visualization we got the subsystem as shown in below:
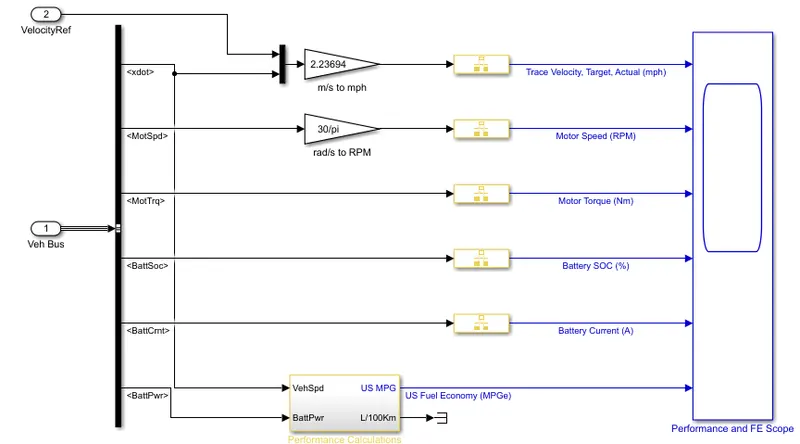
After running the simulation we got output as shown in below:
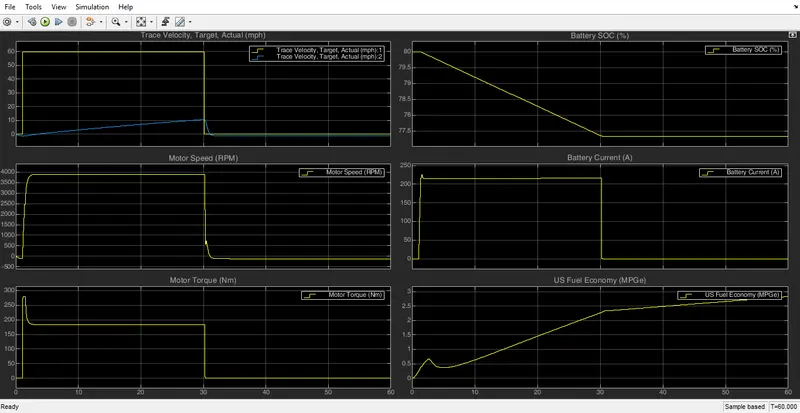
- The first plot shows that Trace velocity and Target actual. In that the acceleration period starts from 0 seconds to 30 sec. Due to the grade and wind velocity the vehicle cannot reached its top speed but it will be higher than the HEV vehicle.
- From second plot it shows that speed of motor . During acceleration period the speed of motor increases due to increase in acceleration, here the motor speed reaches upto 3800 rpm.
- From third plot shows that torque of motor. In that the motor torque increases initially starts decreases when accelerating.
- The fourth plot shows that current taken by the battery in that during acceleration period only the battery gives supply to the motor. Here it takes current half of the HEV vehicles.
- The fifth plot show that SOC of battery. In that the SOC of battery reduces from 80 to 77 during acceleration period.
- The sixth plot shows that Fuel economy in that at starting it uses fuel and during acceleration it will increases and then become constant.
Comparision of Hybrid and Pure Electric Powertrains:
| Parameters | HEV | EV |
| Acceleration period | Starts from 5-20 sec. | Starts from 0-30 sec. |
| Speed of motor | Reaches upto 8500 rpm | Reaches upto 3800 rpm |
| Motor torque range | 250 N-m during acceleration | 180 N-m during acceleration |
| Battery current in Amps | 500 A | 210 A |
| Battery SOC in % | 80-70 | 80-77 |
| Fuel economy in MPGe | Found lesser MPGe value | Better than HEV |
| Emission | Present | Zero emission |
Hence considering all the parameters we conclude that Electric vehicle gave good performance.
----------------------------x--------------------------------------------x------------------------------------