WOT Condition
- What is the difference between the mapped and dynamic models of engine, motor, and generator? How can you change the model type?
- How does the model calculate miles per gallon? Which factors are considered to model fuel flow?
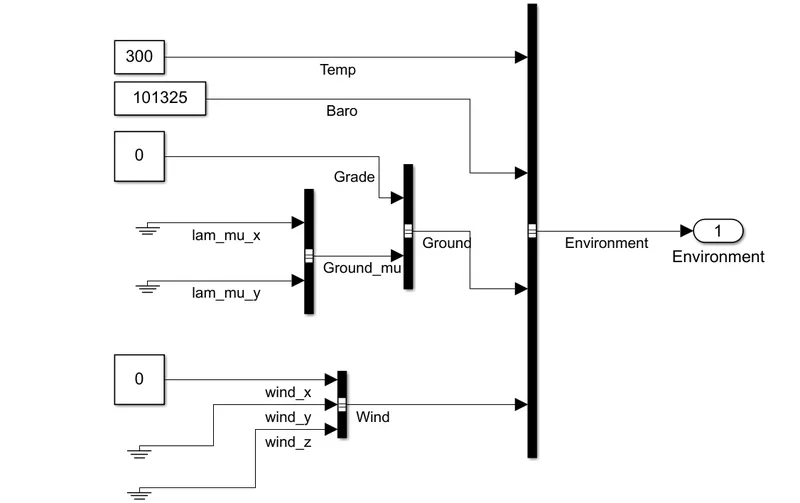
- Run the HEV ReferenceApplication with WOT drive cycle. Change the grade and wind velocity in the environment block. Comment on the results.
- Keeping all other parameters the same, compare the simulated results of hybrid and pure electric powertrains.
MAPPED MOTOR:
The Mapped Motor block implements a mapped motor and drive electronics operating in torque control mode. The output torque tracks the torque reference demand and includes a motor-response and drive-response time constant.
MAPPED ENGINE:
The Mapped CI Engine block implements a mapped compression-ignition (CI) engine model using power, air mass flow, fuel flow, exhaust temperature, efficiency, and emission performance lookup tables. You can use the block
for:
-
Hardware-in-the-loop (HIL) engine control design
-
Vehicle-level fuel economy and performance simulations
The lookup tables, developed with the Model-Based Calibration Toolbox™, are functions of injected fuel mass, F, engine torque, T, engine speed, N, and engine temperature,
DIFFERENCE BETWEEN MAPPED AND DYNAMIC MODEL:
MAPPED MODEL:
- The mapped model is where the data points are pre-assigned look_up tables
- The engine torque is sensed the block generates the required torque simply without considering the real-time motor or engine.
- The output values are stored for the corresponding the input values of the motor
- the accuracy of the results are not high but simulation is done in less time it does not run by real-time parameters
Dynamic model:
- The dynamic model taken inputs as the outputs of subsystems and generate outputs.
- It turns the real-time simulation where the required input from the drive cycle is taken.
- the accuracy of this model is very high
- the simulation will take a very long time to complete so many individual simulations running by all the sub_systems
2.How does the model calculate miles per gallon? Which factors are considered to model fuel flow?
- Miles per gallon is fuel economy rating determined by how far a car can travel with a gallon of petrol or diesel
- in case of electric vehicle how much energy needed for car traveling
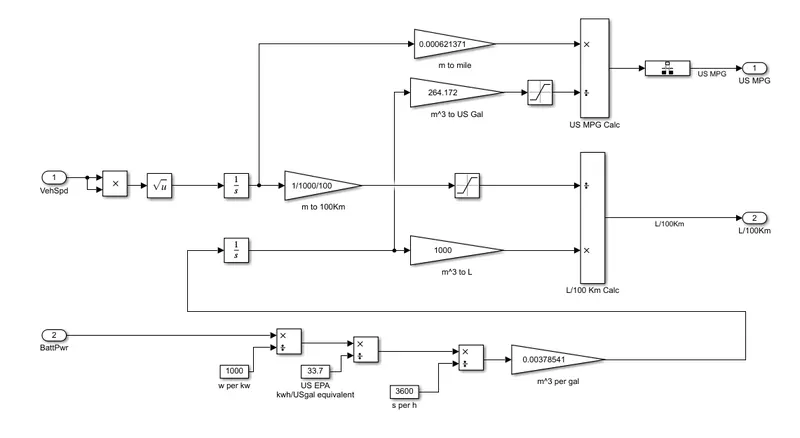
- the power strain block set has a model calculates the miles per gallon for all kind of vehicle
 T
T
The above model takes the input of the vehicle speed, fuel flow, and battery consumption for calculating miles per gallon.
- The battery power is converted in watts and the cycle takes as input
- battery consumption and fuel flow both are consumed equally
- The entire distance traveled is further divided by the volume consumed for that distance. we get millage in different units.
3.Run the HEV ReferenceApplication with WOT drive cycle. Change the grade and wind velocity in the environment block. Comment on the results
HEV REFERENCE APPLICATION:
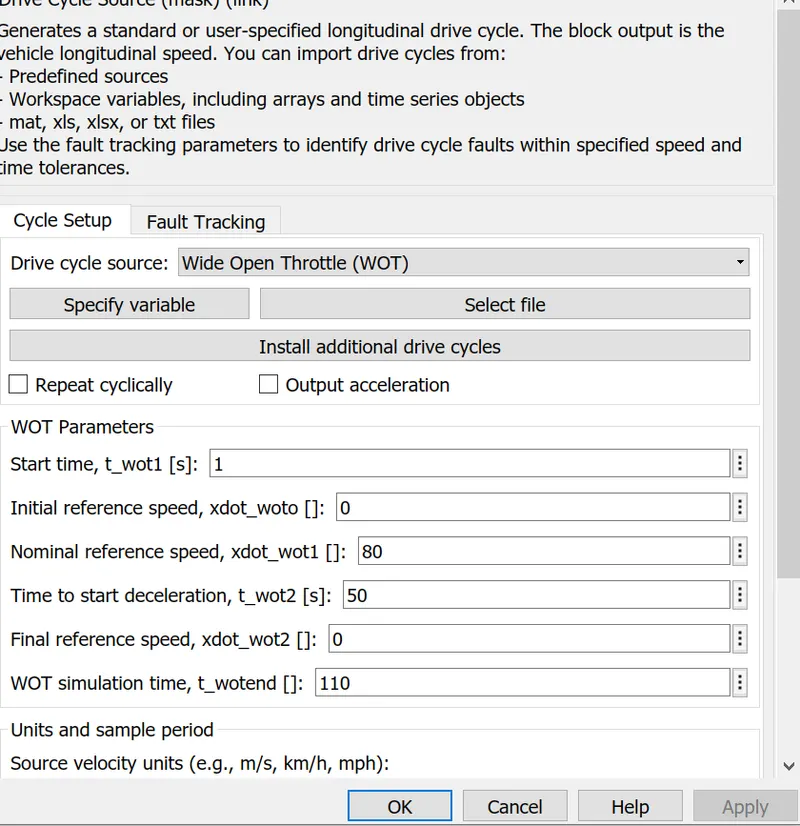
Run the simulation doesn't change grade and wind values.
results:
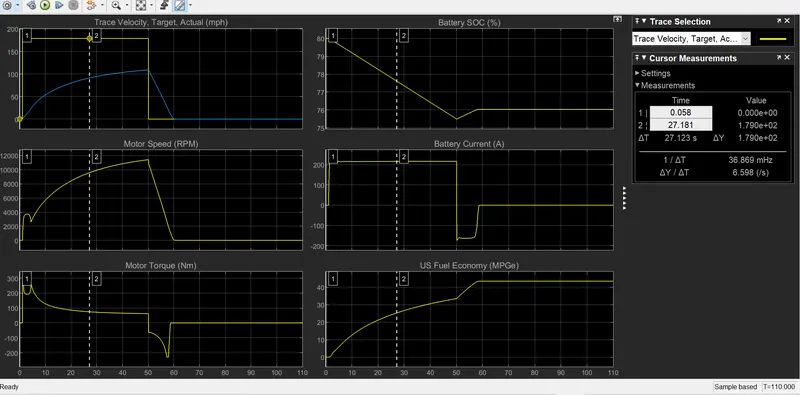
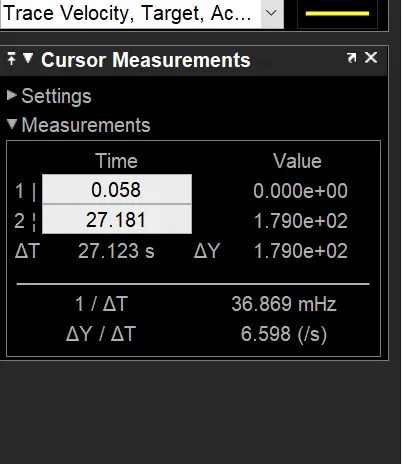
- wot cycle take 27.18 seconds to achieve 80mph speed
- battery recharge is
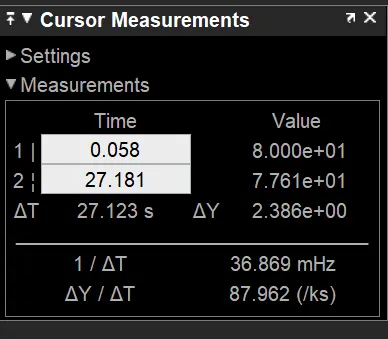
- After 50-sec speed has decelerated.
- motor speed at 80 mph Is approximately 9500rpm
- peak engine torque is 280 N/M
- peak battery discharge is 210 A
- Peak current charge to the battery is -180A
CHANGE THE GRADE AND WIND VELOCITY VALUES:
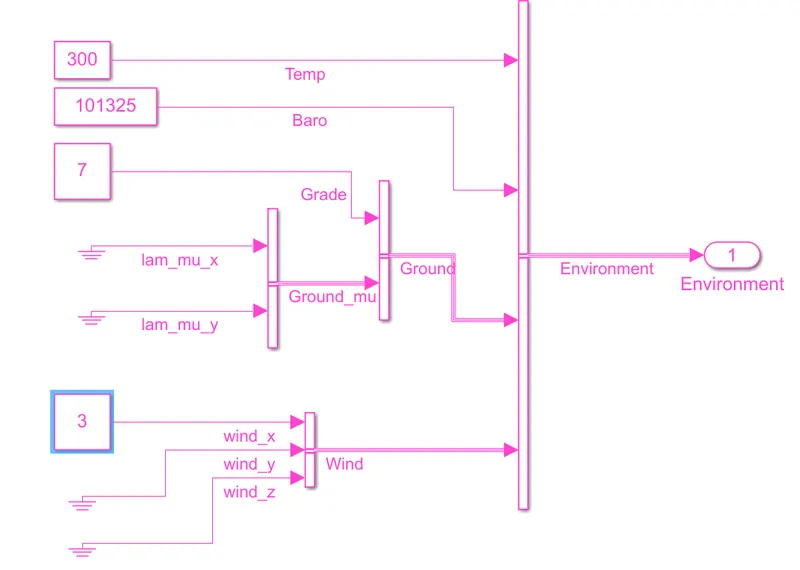
- Chane the grade value 0 to 7
- wind velocity also change 0 to 3
- Run the simulation after changes
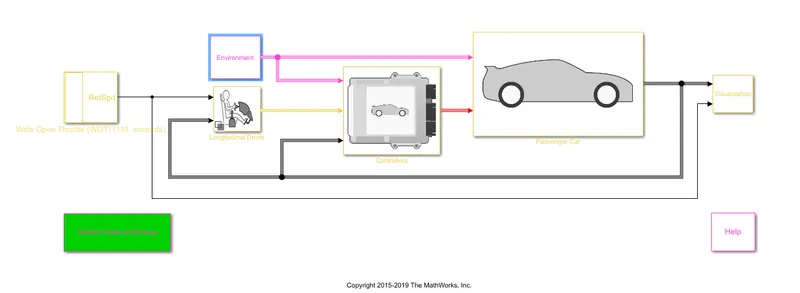
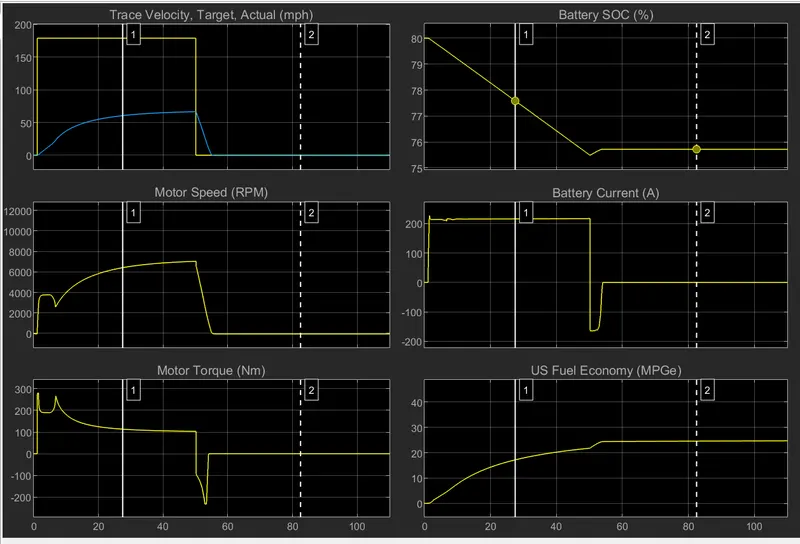
- wot cycle take more than 50 seconds to achieve 80mph speed
- After 50-sec speed has decelerated.
- motor speed at 80 mph Is approximately 7000rpm
- peak engine torque is 280 N/M, Motor torque is not changed it's with grade and wind velocity
- peak battery discharge is 210 A
- Peak current charge to the battery is -180A
- from the above results when we are changing grade and wind velocity values these effected on the speed of the vehicle.
Keeping all other parameters the same, compare the simulated results of hybrid and pure electric powertrains:
simulated results of pure electric powertrains:
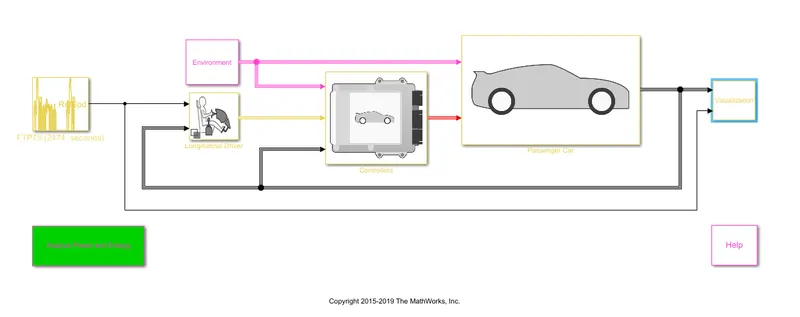
FTP75 Drive cycle Pure electrical vehicle with mapped model run the simulation:
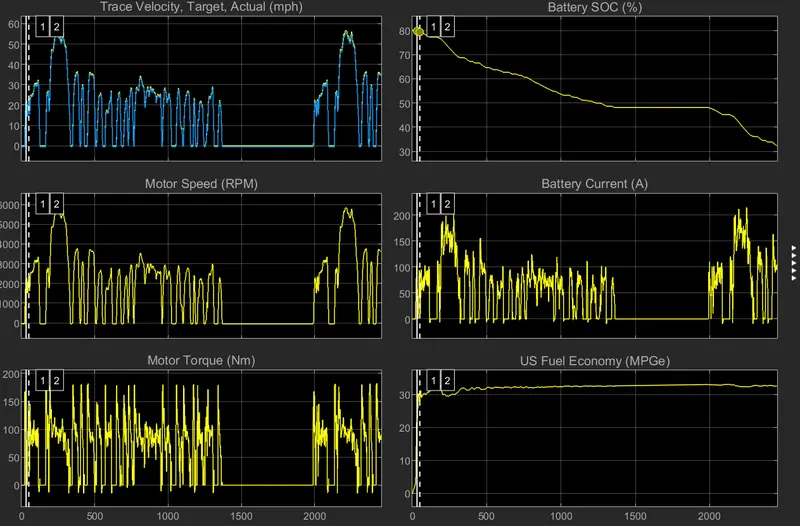
COMPARISON:
- Maximum acceleration 55mph reached to take 300 sec, in the hybrid electric vehicle take 1 sec to reach high acceleration.
- Pure electric vehicle Efficiency is more than a hybrid vehicle.
- motor speed is 5600rpm. pure electrical vehicle motor speed is lower than hybrid electrical vehicles.
- Motor torque is 180-NM. Compared with hybrid vehicle torque values also low.
- power consumption is similar. battery consumption is the low rate in pure electrical vehicles.