Week-4 Challenge WOT Condition Part-2
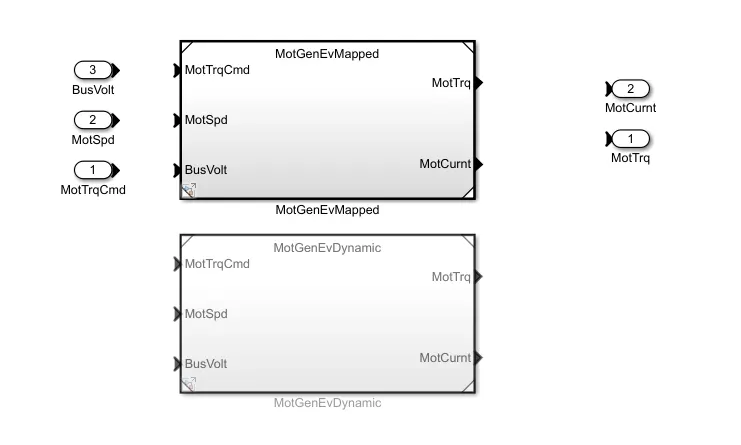
1. What is the difference between mapped and dynamic model of engine, motor and generator? How can you change model type?
Mapped model of engine,motor and generator:
- The mapped model is one type where the data points are pre-assigned in lookup tables.
- The engine or motor torque requirment is sensed and the motor or engine block generates the required torque output without considering the real time motor or engine parametes.
- The output values are stored for the corresponding input values of the engine, motor and generator.
- The accuracy ot this Mapped model is not highbut the simulation will be done in much less time and it does not run with real time parameters.
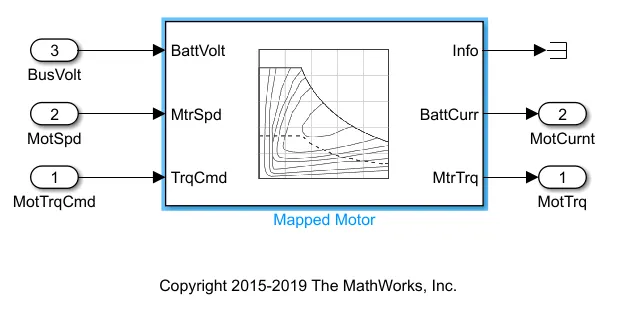
Dyanmic model of engine,motor and generator:
- The dynamic model is another type it uses the combination of the outputs from various subsystems to generate the output.
- This model runs with the real time motor or engine parameters and the required inputs are taken from the drive cycle, the individual real time simulation gets performed and summing all the results of the subsystem and gives the output for the simulation.
- The accuracy of this model is very high because of using real time components parameters.
- This model takes very long time for simulation to completed because of so many individual simulations running by the all subsystem of the engine, motor and generator.
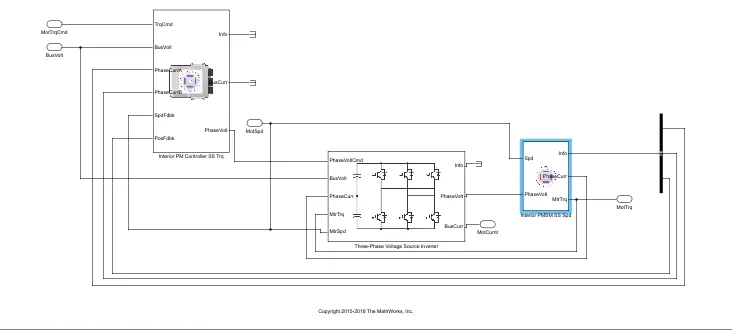
Steps to change the model type:
- In the power train block set we need to select the type of vehicle first wheather it is full electric, full engine or the hybrid vehicle.
- After that simulink model will appears by showing the work flow blocks of the models.
- In that we need to go to the Passanger block => Electric plant => Motor block
- After this just right click on white space of simulink and then go to Variable => Lable mode active choice in this we change the model type
2. How does the model calculate miles per gallon? Which factors are considered to model fuel flow?
Miles per gallon:
- Miles per gallon is fuel economy rating it will us how for a vehical can travel on per gallon of fuelfor an engine powered vhical.
- In the case of electric vehicle, it tell us the energy required to propel the vehicle through a particular distance.
- In our case the amount of fuel energy required to move an engine powered vehicle through a particular distance is determined and then it is compared with the equivelant amount of electric energy required to move the vehicle through the same particular distance and finally it is expressed as miles per gallon.
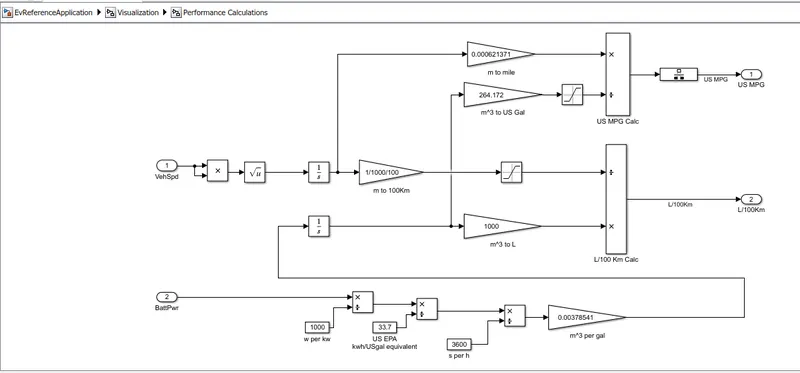
Vehical speed:
- In this model the vehicle speed is get from drive cycle input.
- The distance covered by the vehicle is get by itegrating the speed of the vehicle with respect to time.
Battery Power:
- The amount of energy required from the battery power to propel the vehicle is equvalent to engine is calculated here.
- The battery power is gien in watt hour and it is converted into KWH by dividing with 1000.
- Then we convert the energy from battery KWH to US gallon for this we know that 1 US gallon= 33.7KWH, therefore we dividing the battery energy by 33.7.
- After this we try to get US gallon per sec. for this we are dividing the US gallon by 3600.
- Then we convert US gallon per sec into the volume of fuel flow in cubic meter per sec(m^3/sec) for this we are multiplying US gallon per sec with 0.00318541.
- Finally the battery energy equivalent in Kg/sec is given as input for the fuel flow parameter in order to find the equivalent US gallon energy and estimate the miles per gallon.
Calculating miles per gallon:
- The input form the vehicle speed is in m/s which is converted into miles by multiplying with 0.000621371.
- Thereafter the fuel in cubic meter is converted into gallons by multiplying it with 264.172.
- The mile values and gallon values are then consider to find the miles per gallon efficiency.
3. Run the HEV ReferenceApplication with WOT drive cycle. Change the grade and wind velocity in the environment block. Comment on the results.
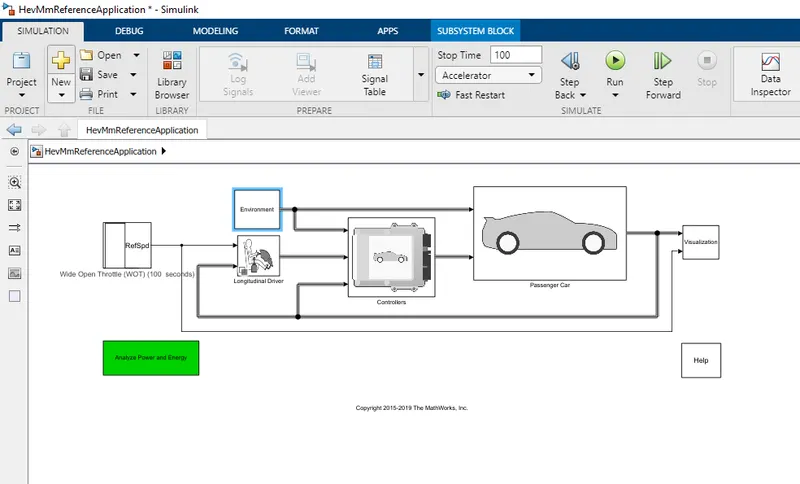
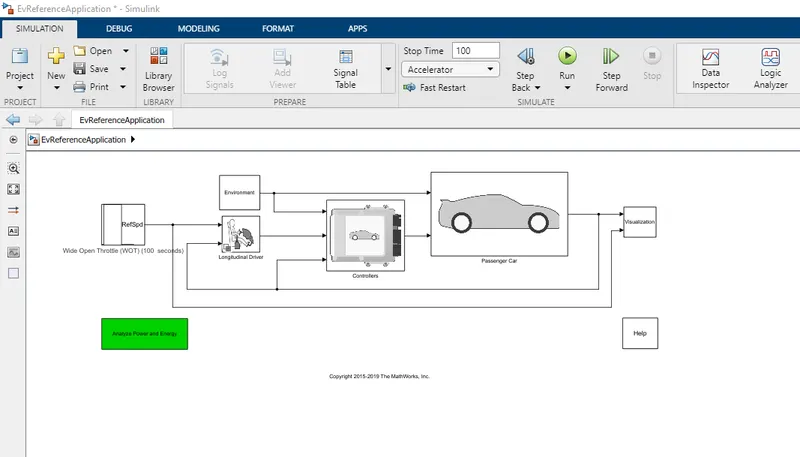
- Here below I have shown HEV vehicle model of simulink
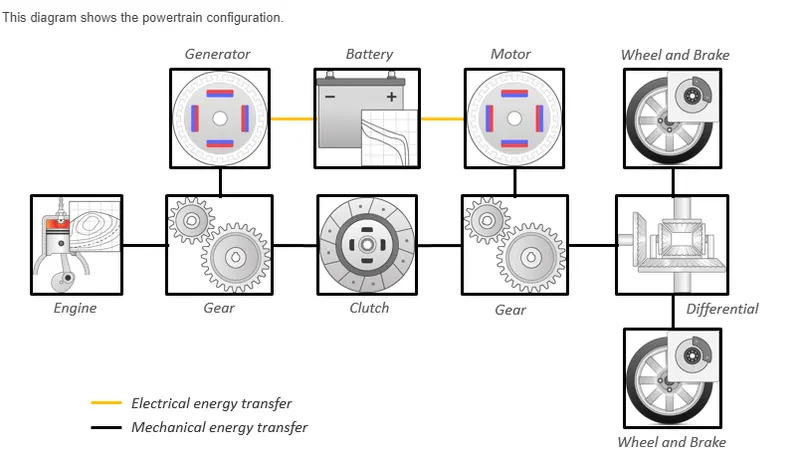
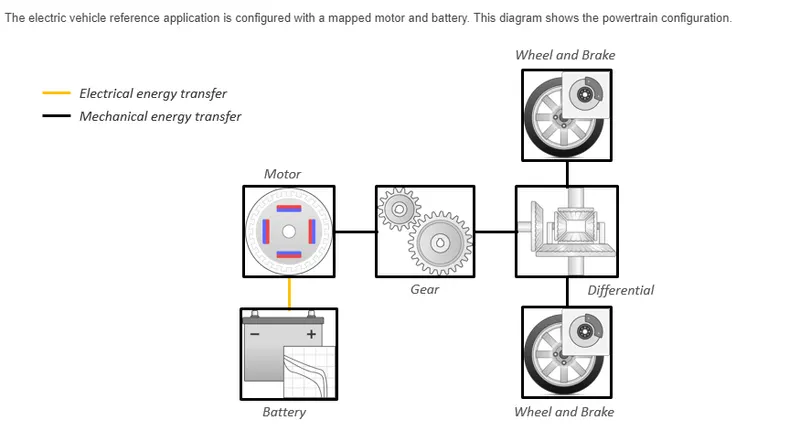
- HEV model powertrain configuration block diagram shown below.
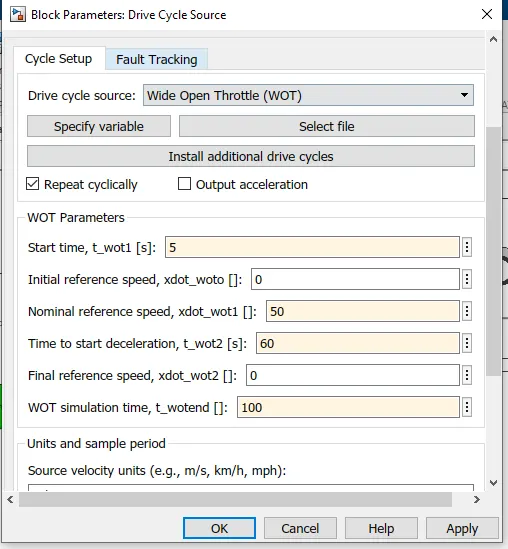
- I have carried out this simulation by using WOT drive cycle for 100 sec and changed the grade and wind velocity values in Environment subsystem.
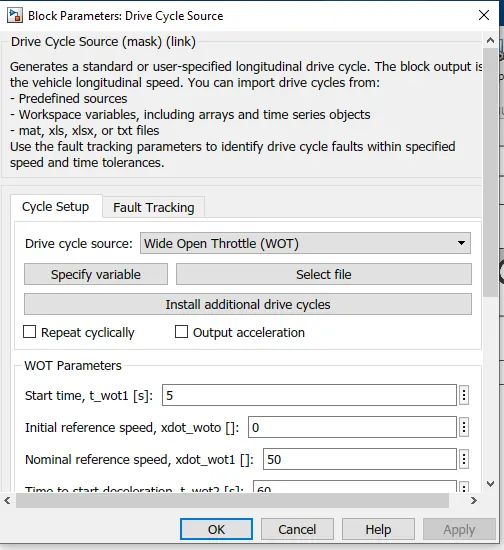
- The drive cycle parameters and the nominal reference speed and time to start deceleration were changed is shown below.
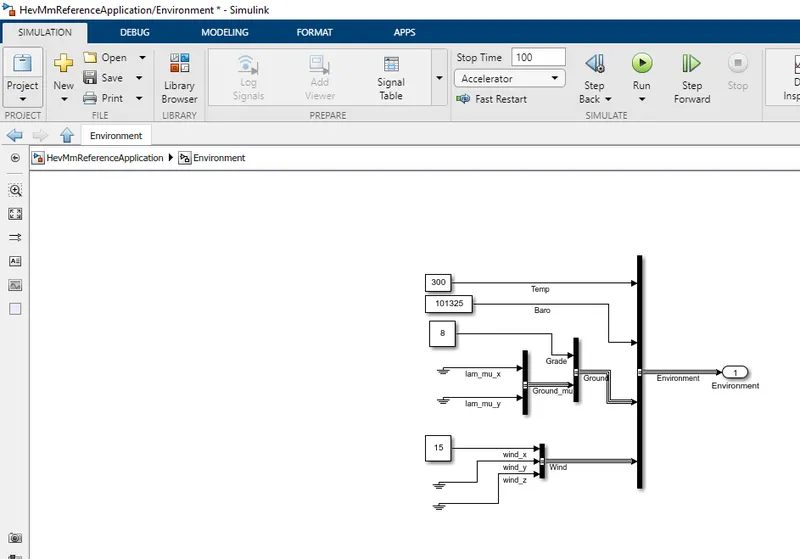
- Wind velocity and grade values are changed to 15 and 8 in Environment subsystem is shown below.
- The scope result of this simulation can be seen below.
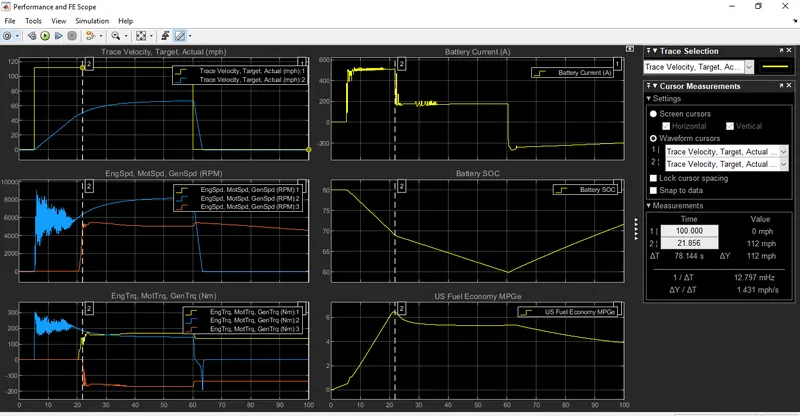
Graph 1: Trace velocity,Target,Actual
- Max. velocity: 66.40 mph
- Time taken to accelerate: 55 sec
- Time taken to decelerate: 4.5 sec
In this graph the blue line and yellow line shows the desired paths it can be said that the battery power is not enough to meet the requirement of the set environment parameter.
Graph 2: Motor,Engine and Generator RPM
- Max motor RPM: 9096 Rpm
- Max Gen RPM: 5472 Rpm
- As seen in the graph the blue line which is the motor RPM that is increasing with the acceleration, initially only motor is used to accelerate the vehicle due to this motor having higher RPM.
- The yellow line is overlapped on the motor RPM plot(blue line).
- Red line represents generator starts to charge the battery when the SOC of battery starts dropping.
Graph 3: Motor torque and Engine torque
- Max Engine torque: 170.2 Nm
- Max Motor torque: 306.6 Nm
- Blue line indicating the motor torque is intially high.
- Yellow line indicating the engine torque comes into graph when the motor torque decreases.
- Red line indicating the generator this line graph throughout the time in negative region because it charging the battery
Graph 4: Battery current:
- During accelaration period i.e. in full throttle period is was observed maximum battery current 524.4 A is consumed.
- During deceleration period the battery current value becomes negative -266.5 A.
- Whenever the acclaration is required the battery current requirement is increased.
- Whenever the decelaration is happened battery current comes to negative which means regenerative braking is happen.
- During the constant velocity period the battery current also becomes constant.
Graph 5: Battery SOC:
- The SOC of battery was observed that fall from 80 to 59.92 % during the full throttle period.
- During the deceleration period it was observed SOC of battery raise form 59.92 to 71.65 %.
- The SOC of battery starts decreasing during accelaration period.
- The SOC of battery starts increase during deceleration period which means regenerative braking is happened.
Graph 6: US Fuel Economy MPG
The maximum fuel economy achieved by the vehicle is 6.47 MPG.
4. Keeping all other parameters same, compare the simulated results of hybrid and pure electric powertrains.
In this the parameters of EV model is changed to same as a WOT parameter of HEV model shown below.
 EV model powertrain configuration block diagram shown below.
Drive cycle parameters of EV model is shown below.
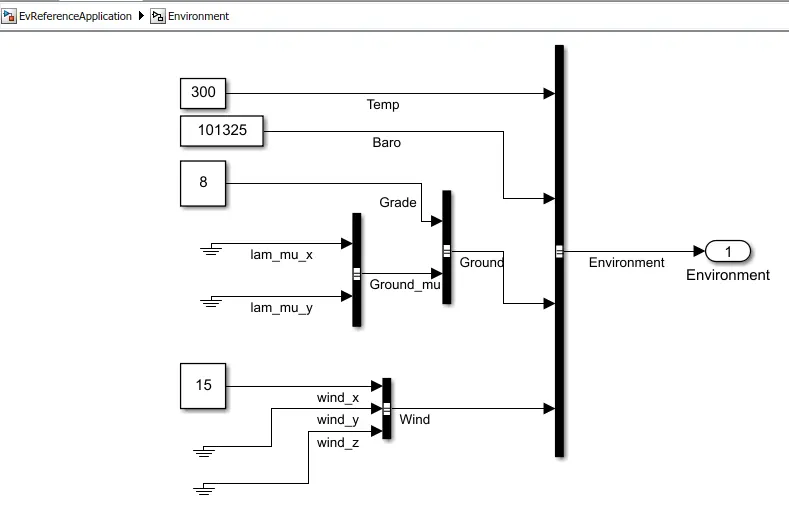
Environment parameters of EV model is shown below. Wind velocity and grade values are changed to 15 and 8.
The final scope result of this simulation is shown below.
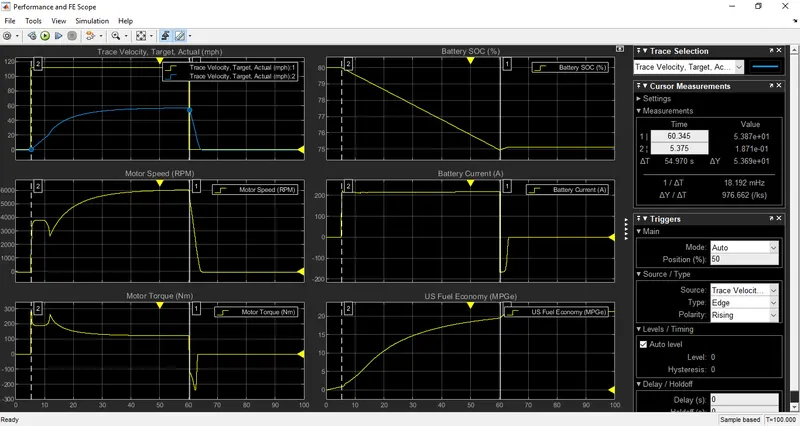
Graph 1: Trace velocity,Target,Actual
- Max velocity: 56.75 mph
- Time taken to accelerate: 55 sec
- Time taken to decelerate: 4.3 sec
Graph 2: Motor RPM
- Max Motor RPM: 6022
Graph 3: Motor torque
- Max Motor torque: 280 Nm
Graph 4: Battery current:
- During accelaration period i.e. in full throttle period is was observed maximum battery current 217.353 A is consumed.
- During deceleration period the battery current value becomes negative - 168.26 A.
- Whenever the acclaration is required the battery current requirement is increased.
- Whenever the decelaration is happened battery current comes to negative which means regenerative braking is happen.
- During the constant velocity period the battery current also becomes constant.
Graph 5: Battery SOC:
- The SOC of battery was observed that fall from 80 to 74.96 % during the full throttle period.
- During the deceleration period it was observed SOC of battery raise form 74.96 to 75.11 %.
- The SOC of battery starts decreasing during accelaration period.
- The SOC of battery starts increase during deceleration period which means regenerative braking is happened.
Graph 6: US Fuel Economy MPG
The maximum fuel economy achieved by the vehicle is 21.20 MPG.
Result Comparison table for HEV and EV model:
|
Parameters |
HEV Model |
EV Model |
|
Grade |
8 |
8 |
|
Wind Velocity |
15 |
15 |
|
Simulation Time |
100sec |
100sec |
|
Simulation Results |
HEV Model |
EV Model |
|
Max. Velocity achived in MPH |
66.40MPH |
56.75MPH |
|
Max. Motor speed in RPM |
9096RPM |
6022RPM |
|
Time taken to accelerate |
55sec |
55sec |
|
Time taken to decelerate |
4.5sec |
4.3sec |
|
Max. Motor Torque in Nm |
306.6Nm |
280Nm |
|
Battery SOC% |
80-59.92% |
80-74.96% |
|
Fuel Economy in MPG |
6.47MPG |
21.20MPG |
From the simulation results we can get to know:
- Maximum velocity achived by HEV model is high compared to EV model.
- EV model takes more time to reach maximum speed compared to HEV.
- HEV model draws high battery current compared to EV model during acceleration.
- Battery discharge rate (i.e. SOC% rate) in EV model is low compared to HEV. Because of this the battery SOC of EV model is high compared to HEV model.
- Motor torque is high in HEV model is compared to EV model.
- Fuel economy of EV model is high compared to HEV model.