Week-3 Challenge: ADVISOR Tool
Use ADVISOR tool and simulate the following
Case 1. For EV_defaults_in file, if cargo mass is 500 kg with all other default conditions, can the vehicle travel for 45 km with FTP drive cycle? Conclude your observations.
Objective: To analys the SOC of battery of the EV default model in ADVISOR tool by having 500kg of cargo mass and find that the vechicle can travel for 45km with FTP drive cycle.
Procedure:
1. Open the Matlab tool and load theADVISOR tool.
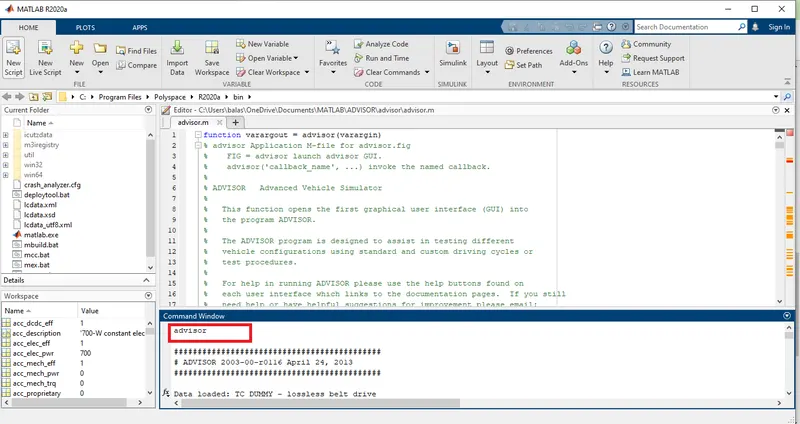
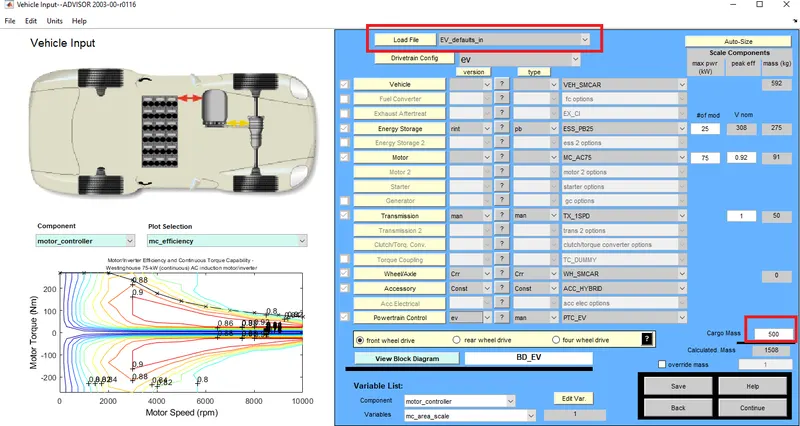
2. In ADVISOR tool select EV default model in load file.
3. Change the cargo mass to 500kg and click continue.
4. Drive cycle window is appers now select the CYC_FTP to be a drive cycle.
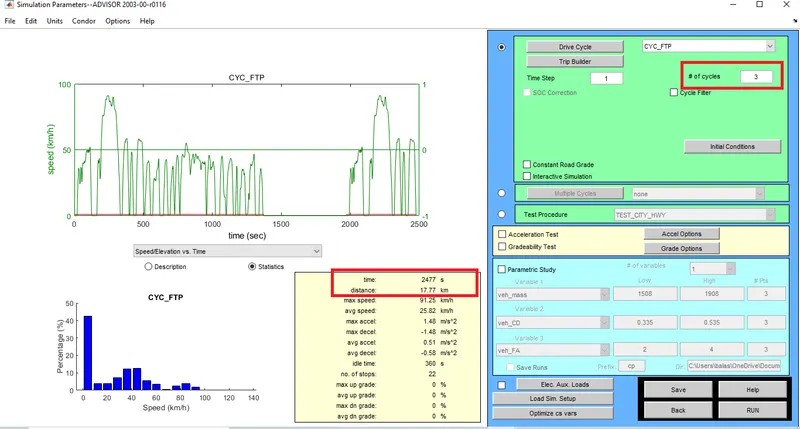
From the drive cycle window we can see each FTP drive cycle losts for a time period of 2477sec and sistance of 17.77km. In order to verify if the vehicle can travel upto 45kms. We have to consider 3 number of cycles.
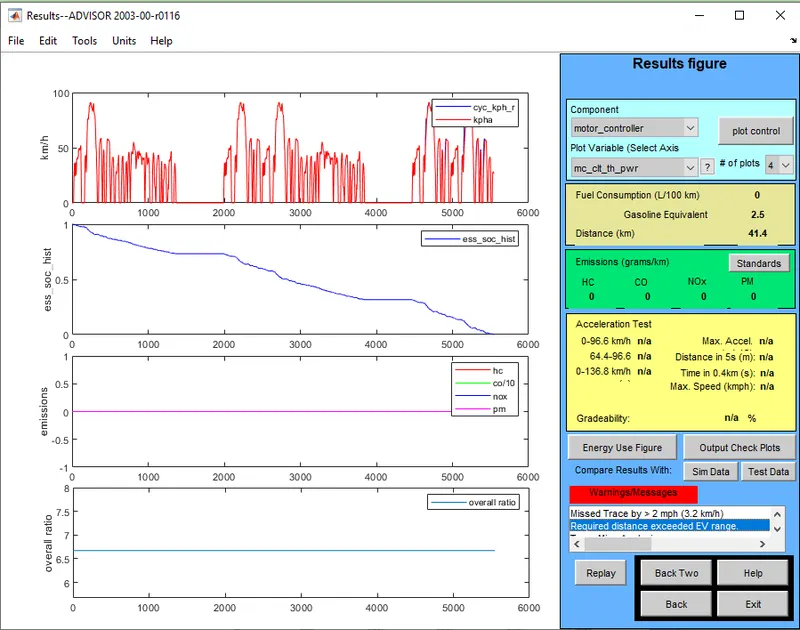
5. On click on the run button the result figure window will appears and it gives the graphical representation of drive cycle data, SOC of battery data, emission and overall ratio data etc.
Conclusion:
From the above graph of SOC we can see that the SOC reaches to 0 before the vehicle completes its 3 drive cycles.
In result figure window under fuel consumption tab it shows that the distance travelled by this EV default model vehicle is 41.4kms and also a warning message is displayed 'Required distance exceeded EV range'. Therefore this EV default model vehicle, if cargo mass is 500 kg with all other default conditions,the vehicle cannot travel for 45 km with FTP drive cycle.
Case 2. In the above case, try changing the battery capacity and repeat the simulation.
Procedure:
1. Repeate the same procedures in case 1 from 1 To 3.
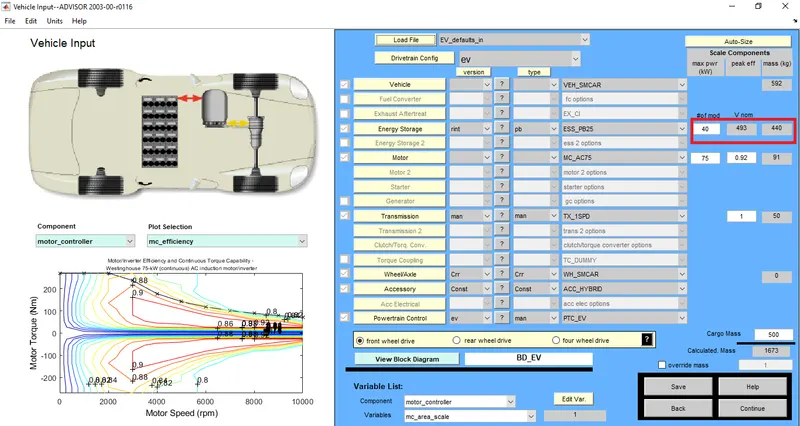
2. In procedure 3 increase the battery modules to 40 now it nominal voltage is changes to 493 volt. Finally click continue button.
3. Drive cycle window is appers now select the CYC_FTP to be a drive cycle.
From the drive cycle window we can see each FTP drive cycle losts for a time period of 2477sec and sistance of 17.77km. In order to verify if the vehicle can travel upto 45kms. We have to consider 3 number of cycles.
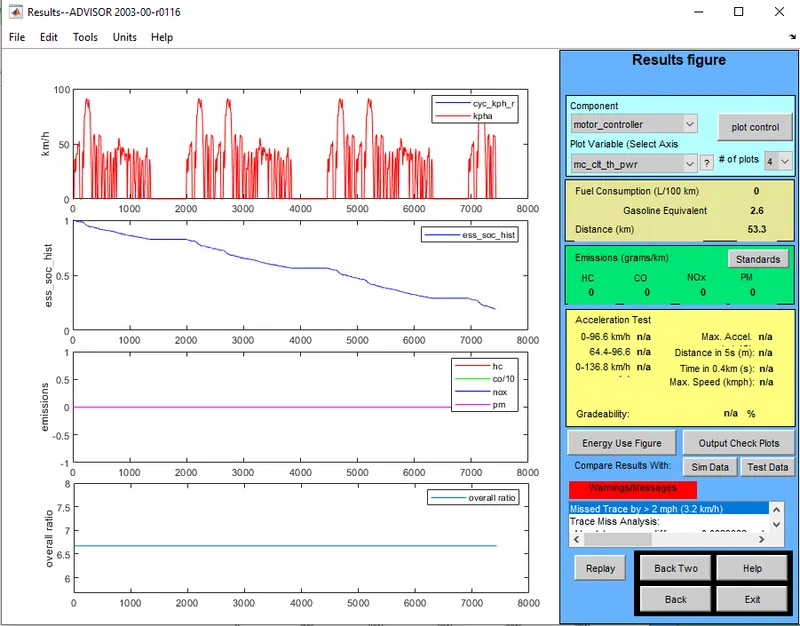
4. On click on the run button the result figure window will appears and it gives the graphical representation of drive cycle data, SOC of battery data, emission and overall ratio data etc.
Conclusion:
From the above graph of SOC we can see that the SOC reaches to 0 before the vehicle completes its 3 drive cycles.
In result figure window under fuel consumption tab it shows that the distance travelled by this EV default model vehicle is 53.3kms after increased the battery modules to 40 numbers. Therefore this EV default model vehicle, if cargo mass is 500 kg with all other default conditions and after increased the battery modules to 40 numbers ,the vehicle can able to travel for 45 km with FTP drive cycle.
Case 3. Perform gradeability test with PRIUS_Jpn_defaults_in file. Compare your results in table and conclude.
Objective: To Perform gradeability test with PRIUS_Jpn_defaults_in file in ADVISOR tool. Compare your results in table and conclude.
Procedure:
1. Open the Matlab tool and load theADVISOR tool.
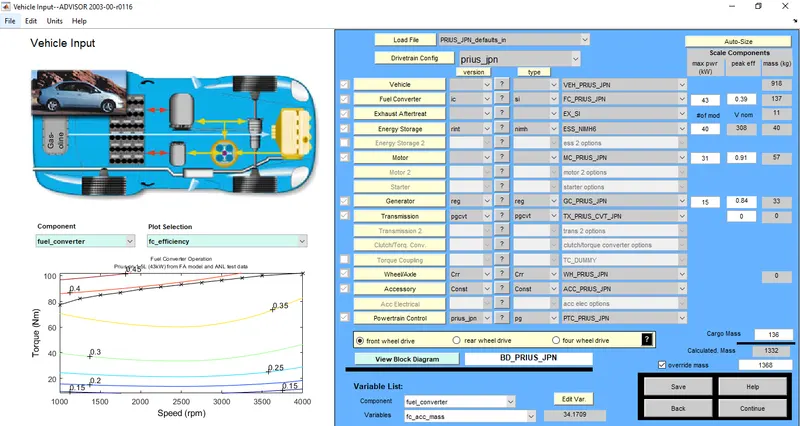
2. In ADVISOR tool select PRIUS_Jpn_defaults model in load file with the all default values click the continue button.
3. Drive cycle window is appers now select the CYC_UDDS to be a drive cycle.
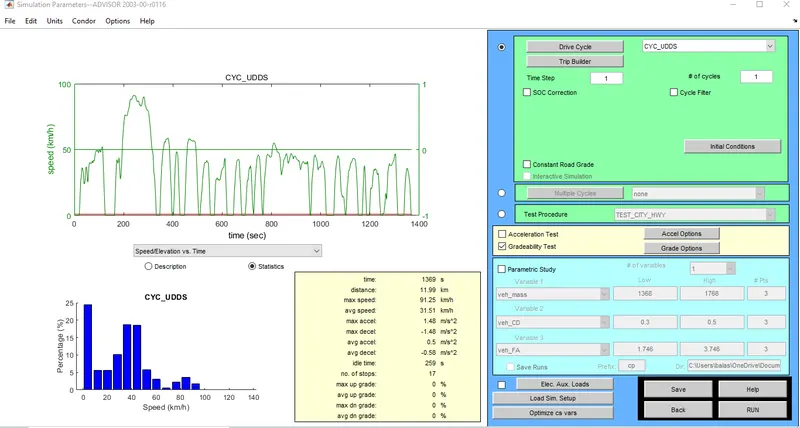
4. Select the check box Gradability test in that select the grade options after this 'grade test advance options' window will pop up in this change the speed and run the model we see the final outcomes.
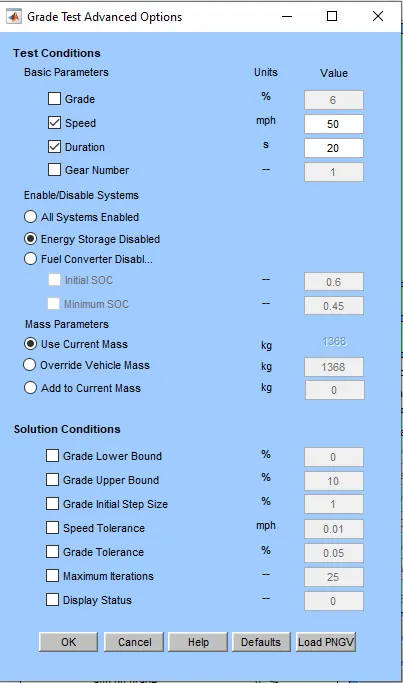
5. By continuosly doing this different speeds we can able to see the gradability performance of PRIUS_Jpn model vehicle.
Condition 1: Speed 50mph or 80.5kmph and duration 20sec
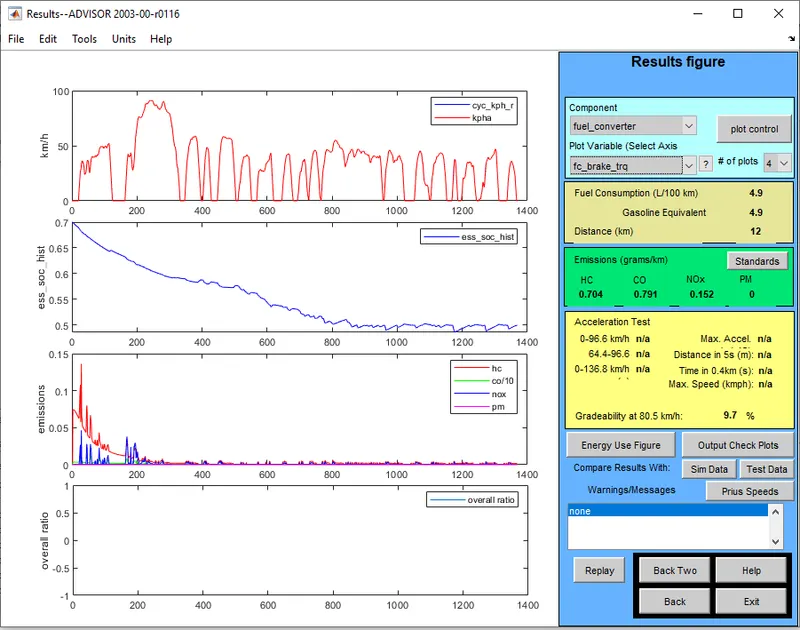
From the result fig window we can see at 80.5kmph gradability is 9.7%
Condition 2: Speed 70mph or 112.7kmph and duration 20sec
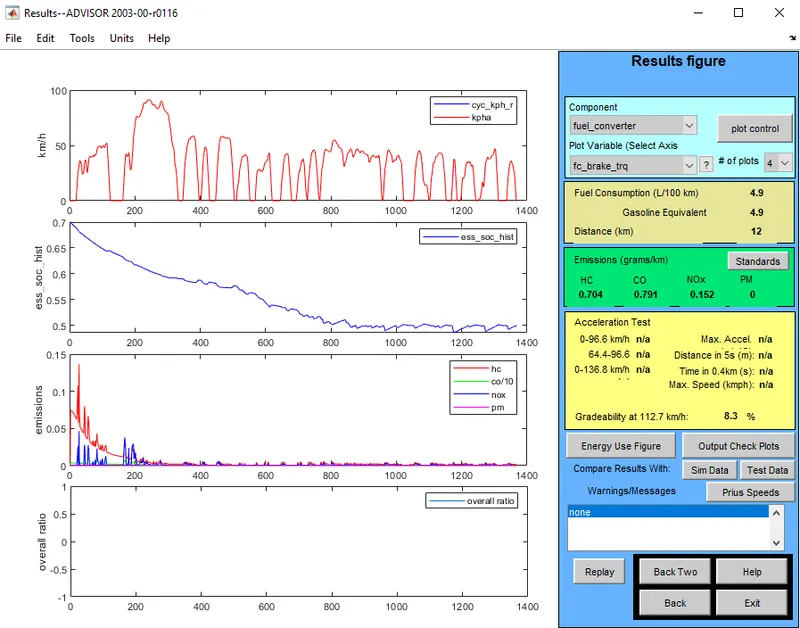
From the result fig window we can see at 112.7kmph gradability is 8.3%
Condition 2: Speed 90mph or 144.8kmph and duration 20sec
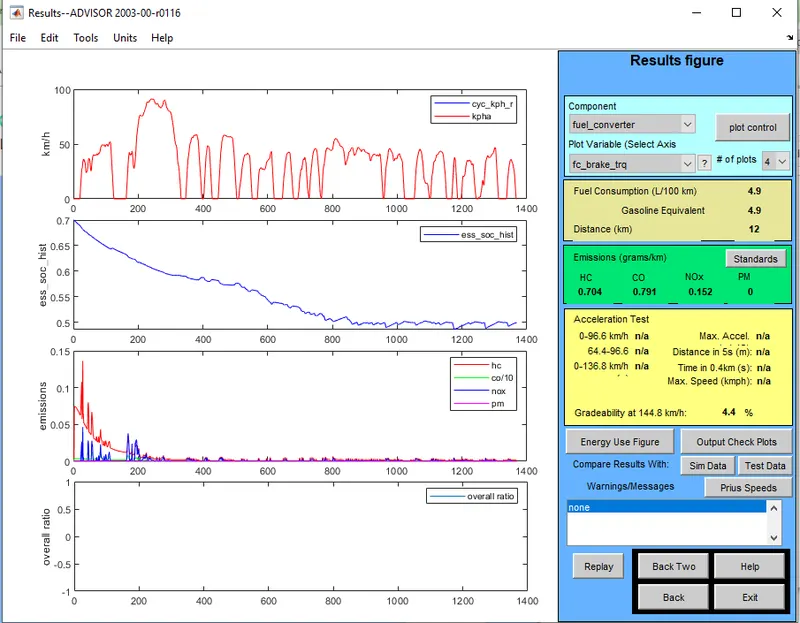
From the result fig window we can see at 144.8kmph gradability is 4.4%
Conclusion:
| S.no | Speed in MPH | Speed in KMPH | Gradability % |
| 1 | 50 | 80.5 | 9.70% |
| 2 | 70 | 112.7 | 8.30% |
| 3 | 90 | 144.8 | 4.40% |
From the above table we can clearly able to see the when the speed of the vehicle increases gradability of the vehicle got decreases.