Week-4 Challenge WOT Condition Part-2
AIM:
- What is the difference between mapped and dynamic model of engine, motor and generator? How can you change model type?
- How does the model calculate miles per gallon? Which factors are considered to model fuel flow?
- Run the HEV ReferenceApplication with WOT drive cycle. Change the grade and wind velocity in the environment block. Comment on the results.
- Keeping all other parameters same, compare the simulated results of hybrid and pure electric powertrains.
1.What is the difference between mapped and dynamic model of engine, motor and generator? How can you change model type?
Mapped Model:
This type of model uses a set of steady state look up table to determine engine performance. This model is used for analysis and desiging purpose which does not required engine dynamic characteristics. The look up table consist of all engine characteristics such as fuel flow, air flow, torque, efficiency, exhaust, temperature etc.
Dynamic model:
Dynamic model decomposes the engime behaviour into individual components model by combining components in this way, the models capture the dynamic effects. We can use this model to analyze the impact of individual engine component on overall performance.
Steps to change the model type:
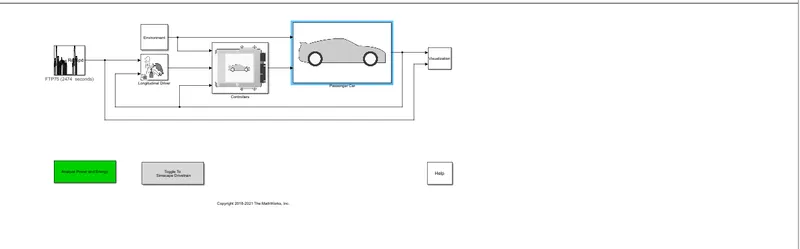
- Open the simulink model of powertrain blockset which is available in MATLAB website
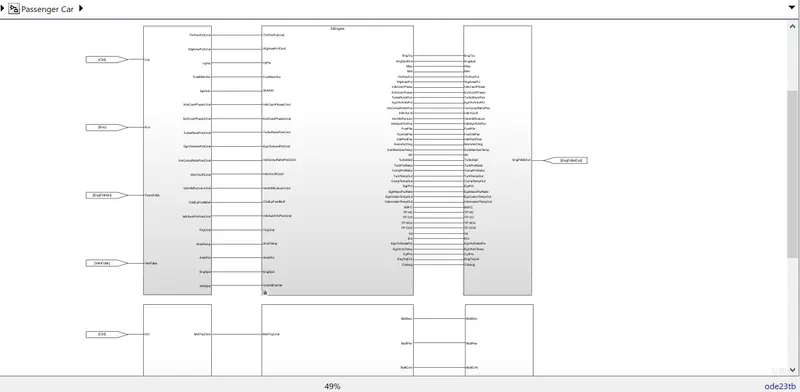
- Double click on the passenger block and enter into the block
- There you will find the engine plant
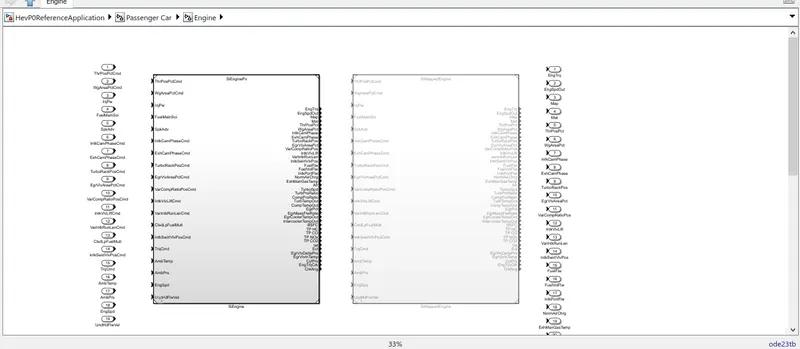
- Right click on the engine plant and select variant
- In variant click on label model active choice and there you choose mapped or dynamic model in this way you can change model type.
2.How does the model calculate miles per gallon? Which factors are considered to model fuel flow?
To know how the model calculate the miles per gallon open performance calculation block miles per gallon is fuel economy rating which can be determined by how much miles the vehicle is travelled per gallon fuel. In this case of EV vehicle this is measured by how much electrical energy is consumed by battery while travelling certain distance. Factors are considered to model fuel flow are battery power vehicle speed, fuel flow.
The EPA gives each vehicle three different MPG rating as all car leasing notes:
- High MPG : the average a car will get while driving on an open strech of road without stopping or starting typically at higher speed.
- City MPG :The score a car wil get on average in the city conditions with stopping and starting at lower speed and combined average of high and city MPG.
While MPG can help you compare different vehicles it doesn't tell you anything about the real world fuel prices However you can easily calculate the approximately how much you'll spend on fuel at different price
How does the model calculate miles per gallon?
To calculate the fuel flow, vehicle speed and battery power are taken into consideration
Thecabove MPG calculation is for HEV which means it contains both fuel and battery energy
First we get battery power ratings in WATTs which is converted into KW and further into KW/h
Then it is converted into US gallon equivalent energy by dividing it by the standard value 33.7 then it is converted into US gsllons per second
It is multiplied by standard value 0.00378541 to get volume in meter cube/gallon and it is added to the fuel flow for total value as it is an HEV
Further meter Cube is converted into US gallons per second
3.Run the HEV ReferenceApplication with WOT drive cycle. Change the grade and wind velocity in the environment block. Comment on the results:
First we open the HEV reference application from the sources.
After selecting that now we have to select the drive cycle whuch is by default is another parameter now change that into WOT drive cycle
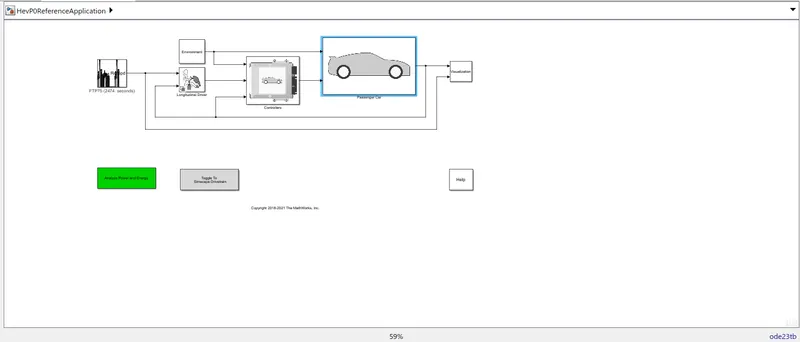
Now selecting the drive cycle
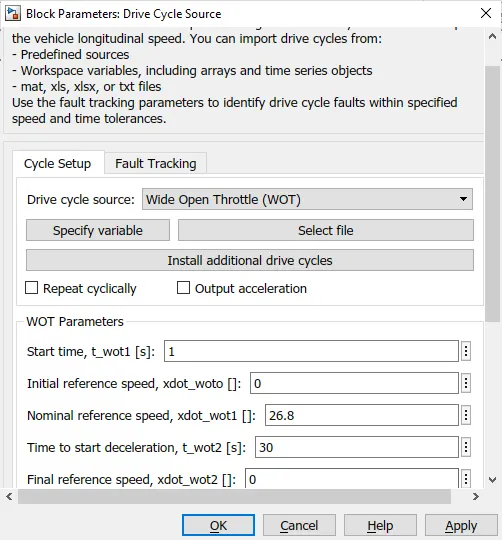
Inside the window we csn change our drive cycle. we can even change spped torque acceleration and simulation time.
Graph when the duty cycle was changed:
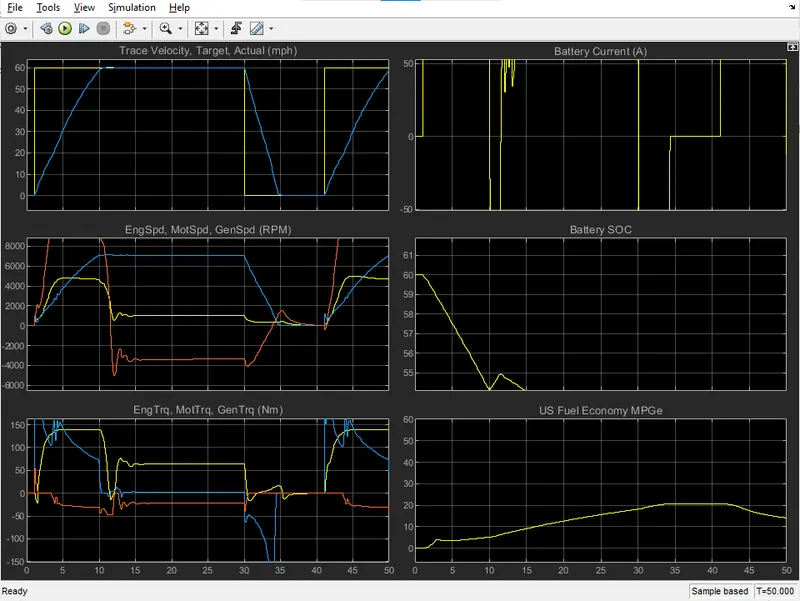
Changing the parameters in the Environment block
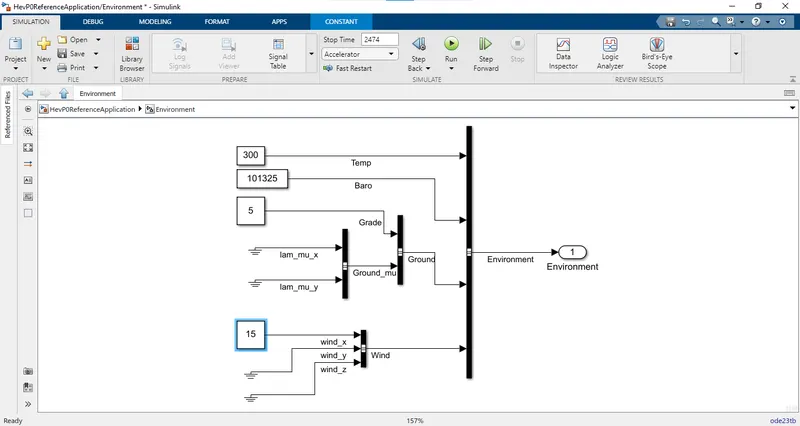
We get therse graphs
Graph1: Trace velocity vs actual velocity:
The yellow line indicate the trace velocity and blue reprents the actual velocity line here we can see that vehicl requires from 2 sec to 20 seconds to achive the maximum speed towards the targeted path by using batter power on after that the vehicle decelerate.
Grap 2: Engime motor and generator speed:
As the battery is fully charged at initial condition only the motor speed which is in blue colour is used to indicate which is high at the starting because of resistance due to slope and wind velocity the engine speed (yellow line) is overlapped with generator speed (orange line) indicating both running on the same rom. Initially there is no need for the engine and generator speed of the vehicle. Therefore they are at 0 RPM But when the battery will be discharging or when the state of charge (SOC) becomes 70% then the only engine will start to rotate to provide and maintain the speed of the vehicle and so far generator will also start to charge the battery at the same time hence the rpm will be same
Grap 3: Engine torque, motor torque, and generator torque:
As the battery is being used at the start so torque will be also maximum for the motr in this case until the vehicle acquries its maximum for the motor in this casr the torque requried will reduce. here also the when there is deceleration the torque value becomes -ve indicating no need of torque and battery becomes constant once battery goes into charging state generator torque will be -ve indicating electric motor is charging and in this period engine has to overcome the torque requried of the vehicle.
Graph 4: Battery current:
When a vehicle uses an electric motor then only it is used to generate the power of the motr when the vehicle accelerates then no current is extracted to produce power for the motr form the graph you can see the current requriement becomes stable when the battery charging mode is activated.
Graph 5 : SOC (State Of charge):
State of Charge is very important for battery driven vehicles from the graph it can be seen that the battery is used below 80% the state charges goes down and battery goes on charging mode through generator once the battery gets charged then its state of charge also increase and it wont fall down untill battery is subjected to another operation.
Graph 6: MPGE:
The graph show miles per gsllon equivalent to run the vehicle during the higher speed the fuel need is high as the vehicle deaccelrate the fuel need is high as the vehicle deaccelrate the fuel requried is less
These are the observation we stidied from the above graph
4. Keeping all other parameters same, compare the simulated results of hybrid and pure electric powertrains :
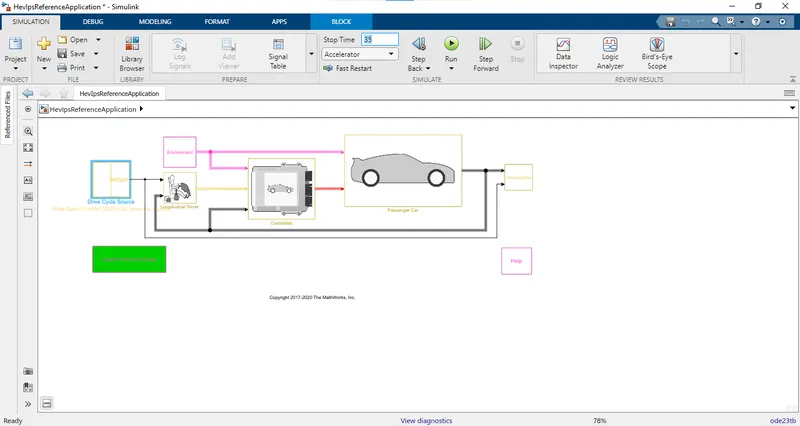
From the soure select electrical referece vehicle MATLAB divert us to the EV simulation model we are keeping all parameters the same as we applied
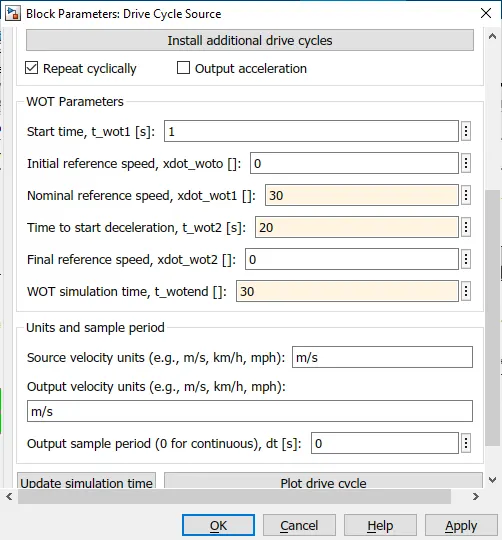
We will slect the WOT as drive cycle and make necessary changes like speed, tie and run timee and keeping all same as we used in the HEV model
and the environment parameters will be
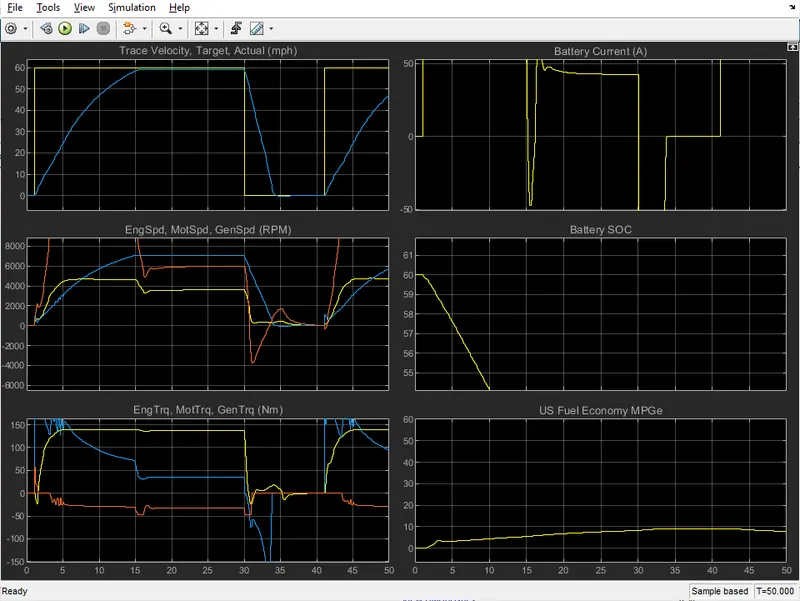
afyer the run the cycle for 35 seconds in the accelerator mode as the simulation gets over the and we the graphs as this way
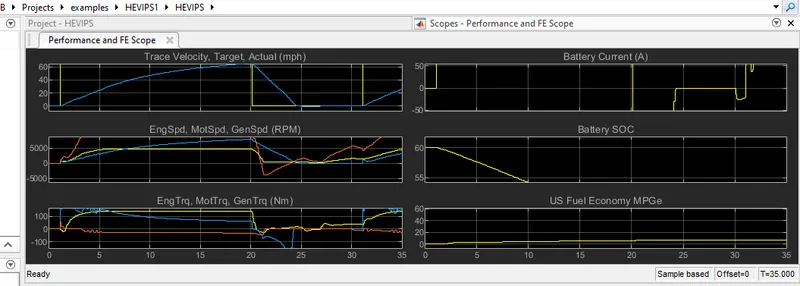
From the above graphs :
Pure Ev can achive less vlocity that HEV that is less that 60kmph which is less compared to previous one
Motor spedd in the RPM is less than that of HEV but the path tracing is the same motor torque is alomst in the same HEV battery current uses is half in EV to produce power as that of HEV
also, battery use is less battery draining is low and it can be seen in graph of SOC that keeping all the parameters the same the battery uses is 5 times more in the case of HEV than that of pure EV's battery drains quickly in case of HEV
Fuel economy is alomst double in the case of Pure EV than that of HEV.
Hybrid cars offers better fuel efficiency or longer distances compared to pure Electricvehicle.