Study about EV and HEV Simulink model and their powertrain blocks(Mapped, Dynamics).
Aim: Study the Pure EV and HEV Simulink model made by using a powertrain block in Matlab and compare the output results.
Objectives:
- Study about the powertrain blocks.
- Study about pure electrical vehicle(EV) Simulink model made from powertrain blocks.
- Study about Hybride electrical vehicle(HEV) Simulink model made by using powertrain blocks.
Theory:
Powertrain Blockset: It is a new product that supports automotive and controls engineers in their powertrain modeling and simulation efforts. Powertrain Blockset provides fully assembled reference application models of gasoline, diesel, hybrid, and electric powertrains. It includes a component library for simulating engine subsystems, transmission assemblies, traction motors, battery packs, and controllers. Powertrain Blockset also includes a dynamometer model for virtual testing.
Automotive teams that are deploying Model-Based Design often look for a starting point for building system models and applying these models to design and testing. Developing a system model from the ground up requires significant effort and engineers with specialized skills. With Powertrain Blockset, we engineers can take advantage of a maintained, well-documented, and open set of models that can be customized to their needs.
1.What is the difference between the mapped and dynamic models of engine, motor, and generator? How can you change the model type?
a.The difference between the mapped and dynamic models is as follows:
1.In the mapped model's parameters are given through the lookup table. This data comes from the experiments, which can be used only to verify the conditions given and not useful for real-time conditions.
2.In the dynamic model we have to give each parameter of each block or parameters individually and we can change any parameters according to our need and conditions.
b.Steps to change the model type from mapped to dynamic is as follows:
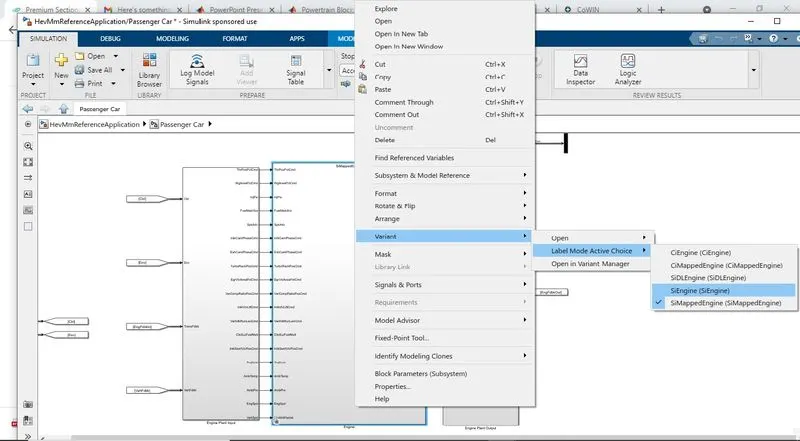
1.For the engine
a.Path to change the engine block from mapped to dynamics
passenger car==>Engine
b. Now right click on the Engine and select variant option and click on then Label model active choice and then for dynamic engine select SiEngine.
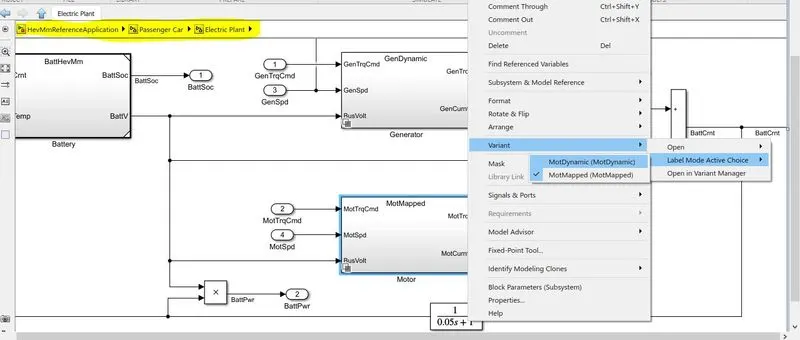
2.For the motor to change from the mapped models to the dynamics models:
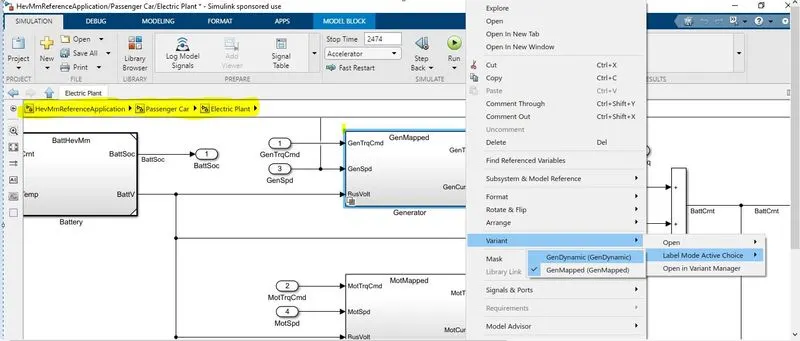
3.for Generator to change from the mapped to the dynamics models:
2.How does the model calculate miles per gallon? Which factors are considered to model fuel flow?
A.To calculate the miles per gallon:
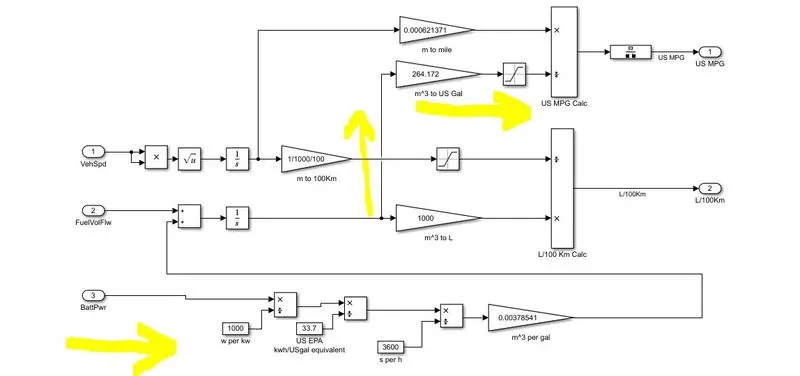
Steps to calculate the miles per gallon:
1.First, we convert the Battery power from Kw to m^3 per gal as per the following steps:
a. From Kw to W:
`(Bat tpwr)/1000`
b. From watt to Kwh/USgal:
`((Bat tpwr)/1000)/33.7 = Bat tpwrxx2.97xx10overset(-5)`
c. to convert the Kwh/US gal to Kws/USgal:
`(Bat tpwrxx2.97xx10^-5)/3600 =Bat tpwrxx8.24xx10^-9`
2. Now we add the Battery power to the fuel Volume flow and integrate it with respect to time.
`int((Bat tpwrxx8.24xx10^-9)+(Fuelvolumeflow))*dt ...........................................(1)
3.Now we multiply the equation 1 with 264.172 to convert from m^3 to Us gal
`(int((Bat tpwrxx8.24xx10^-9)+(Fuelvolumeflow))*dt)xx264.172`...................................(2)
4.Now to convert the vehicle speed to distance in miles
a.Doing square of the vehicle speed to remove all the negative value of speed which is due to deacceleration of the vehicle after that doing square root of the vehicle speed as follows:
`VehSpd^2 = sqrt(VehSpd) = VehSpd = int(VehSpd)*dt = D`
D= Distance traveled by vehicle
b.Now we have a distance in m now we have to convert this distance to 100Km as follows:
`(D/1000)/100 = Dxx10^-5`
c. last step is to convert this distance which is 100km to Miles as follows:
`Dxx10^-5xx0.000621371`.................................................................................(3)
5.For equation 2 we have added the saturation point which allows the values which are greater than the 0.001 as shown below diagram:
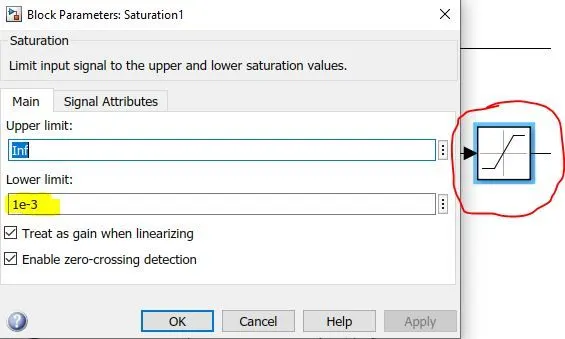
6.After adding the saturation block to equation 2 now we have to divide equation 3 with equation 2 as follows:
`((int((Bat tpwrxx8.24xx10^-9)+(Fuelvolumeflow))*dt)xx264.172)/(Dxx10^-5xx0.000621371`
7.So now we get the values in US miles per gallon(MPG)
B.To find factors affecting the fuel flow
a.For the mapped model of the engine:
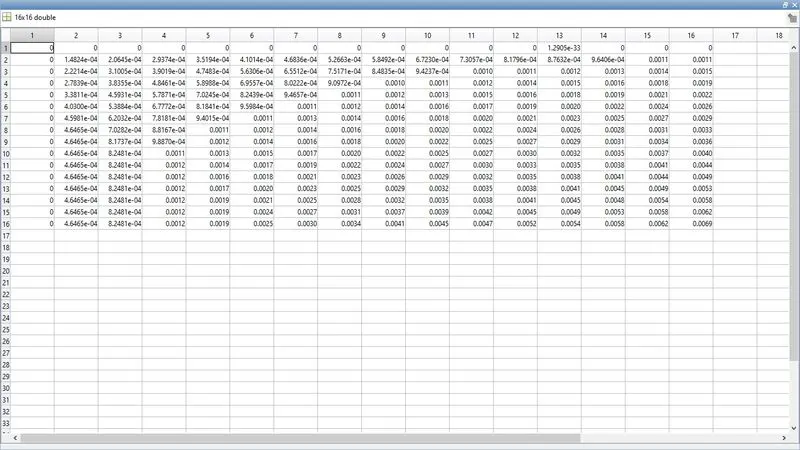
In this model, we are giving input to the engine as a lookup table of fuel mass flow(Kg/s) as shown in the following table:
b.for dynamic model of the engine:
In the dynamic model of the engine the fuel flow depends on the following factors :
-
Injector slope [mg/ms]
-
Stoichiometric air-fuel ratio
-
Fuel lower heating value
-
Fuel specific gravity
3.Run the HEV ReferenceApplication with WOT drive cycle. Change the grade and wind velocity in the environment block. Comment on the results.
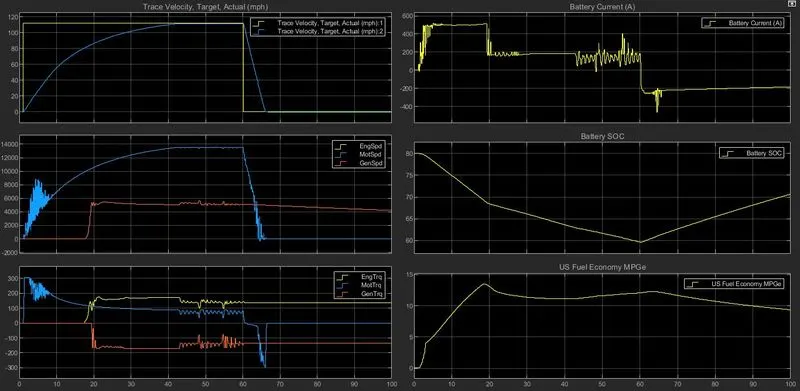
Let's first the model of HEV for WOT drive in which the acceleration time is 50sec and deacceleration time is 60sec and total simulation time is 100sec for the 0-degree grade and 0 wind velocity in the x-direction. So after this, we get the graphs which are as follows:
So let's apply the grade of 10 and wind velocity of 5 so let's see the graph:
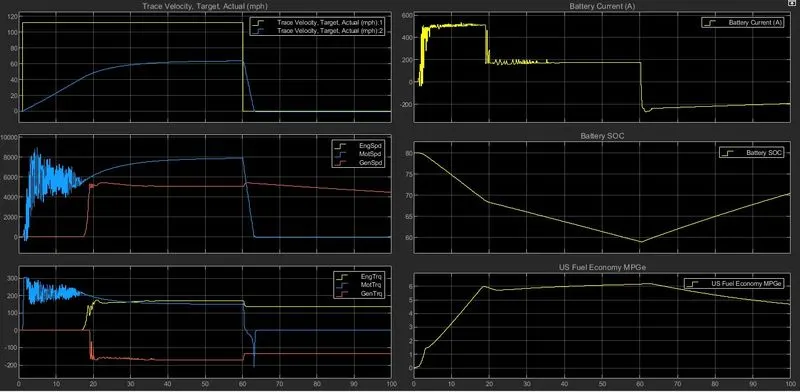
Result: So comparing the above two graphs we can say that as we go on increasing the angle of grad and wind velocity, the grad resistance and air drag resistance go on increasing so to overcome that we have kept the torque of the motor for a longer time as compared to normal condition so due to that the US fuel economy decreases. In the second condition, to get the required torque the speed of the motor decreases.
4. comparison between the simulated results of hybrid and pure electric powertrains.
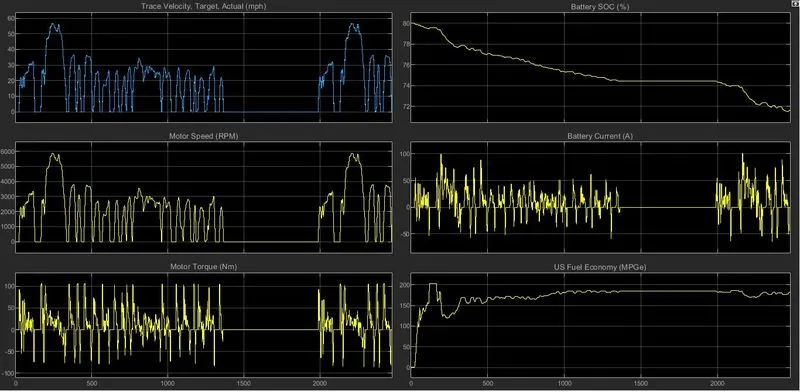
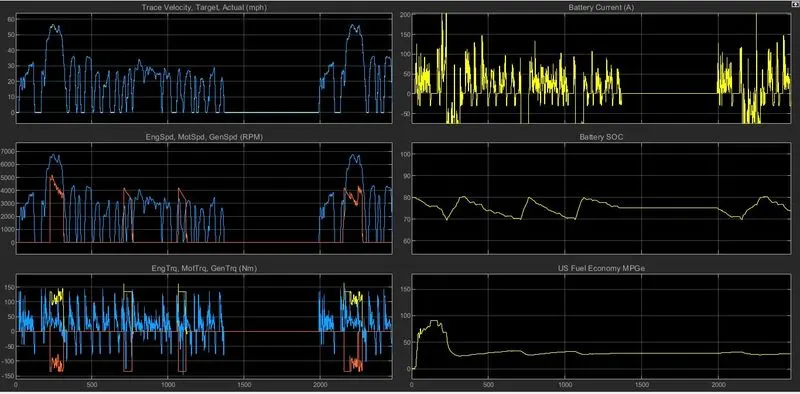
By default, we are using the FTP75 drive cycle for both models so after simulating both the models we will get the following graphs which are as follows:
a.Graphs of the pure electric vehicle(EV) after simulation are as follows:
b.Graphs of the Hybrid electric vehicle(HEV) after simulation are as follows:
Results: So from this we can say conclude the following points:
1.In the pure electric vehicle the Battery SOC is continuously decreasing so after applying more drive cycle the battery will discharge totally so we don't have any backup instead we have to charge it again which can take some time.
2. In the HEV the Battery SOC is using the thermostat strategy in which up to the particular percentage of SOC the vehicle will run on the battery once it reaches a lower limit then it stops and the transmission power comes from the engine and the battery also charges on the engine once battery charges to upper limits the engine turns off and the vehicle will run on the battery power and this process is going to happen continuously until all source of fuel gets consumed.
3.The fuel economy of the pure electric vehicle is more than the Hybride electric vehicle because there is less consumption of fuel to the same distance traveled by vehicles.