Week-4 Challenge WOT Condition Part-2
Week-4 Challenge WOT Condition Part-2
- What is the difference between mapped and dynamic model of engine, motor and generator? How can you change model type? In the Matlab model EV Reference Application related to Power Drain Block set, Motor model consists of two engines. Static and Dynamic engines.
Static or Mapped model works with a Lookup table in which the static values of Motor torque, Battery Voltage, Motor speed are given. All the values are fixed and the execution is fast in the static mode of motor operation.
Dynamic Mode of operation refers to the dynamic operation of the motor where the data given in the motor input is not static. the execution also is not fast compare to the static execution. The values of motor torque, battery voltage given are the exact values of the motor operation.
Below listed are the images from Matlab showing the simulation model path :
Fig1: EvReferenceApplication/Passenger Car/Electric Plant
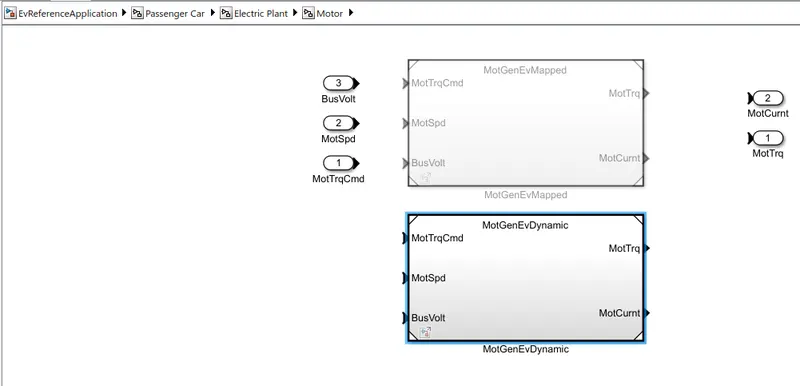
Fig2: Static Model
Fig3: Dynamic Model
Fig1:
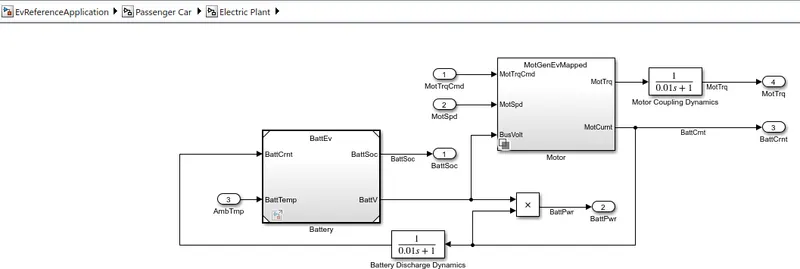
Fig1a: When the Motor subsystem is opened, it shows that there are two models representing Motor Generator operation.
Either Static mode or Dynamic mode can be activated once.
In the below image it shows that the static motor-generator set is operating.
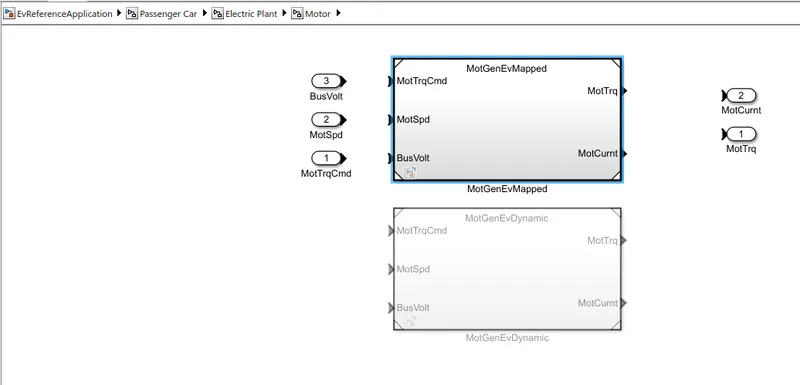
Fig2:
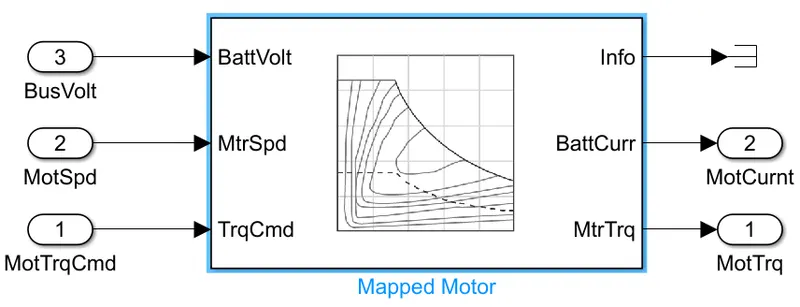
Fig3:
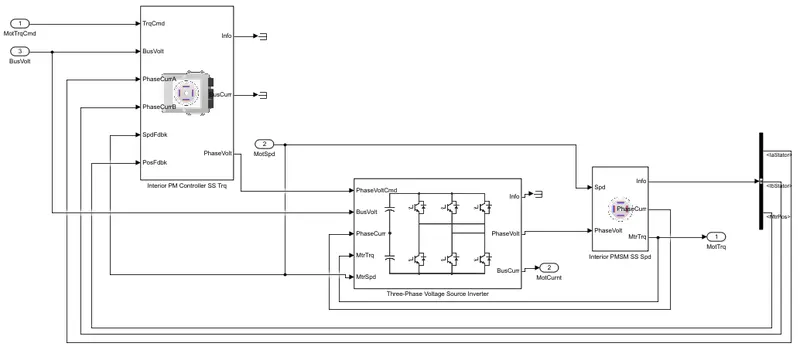
To change the model from Static to Dynamic and Dynamic static both are possible.
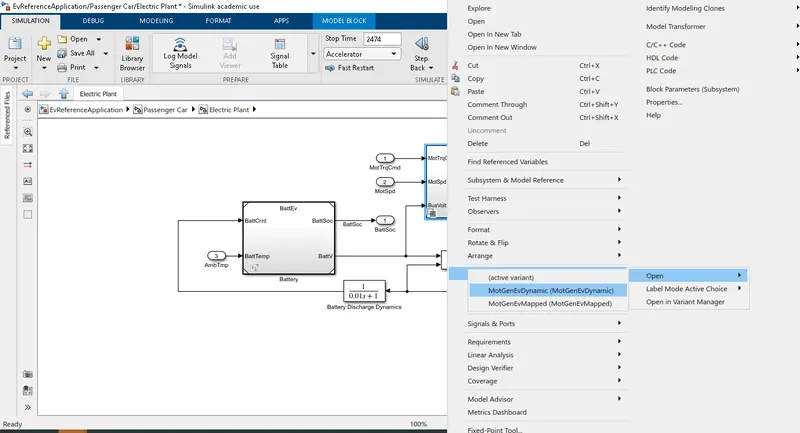
To change the Model, Right-click on Motor, Select Variant, Click on Open and select the MotGenEVDynamic option.
To select the Dynamic Mode, Click on Label mode Active choice and select Dynamic mode. If the selection is done with dynamic mode, the below selection changes from static mode to dynamic mode which is shown in the below figure.
2. How does the model calculate miles per gallon? Which factors are considered to model fuel flow?
Term Miles per gallon is used to measure the distance traveled by the vehicle, ie., no.of miles covered by the vehicle with one-gallon fuel in the tank. Mainly this is used in Conventional Fuel based vehicles or Hybrid Electric vehicles.
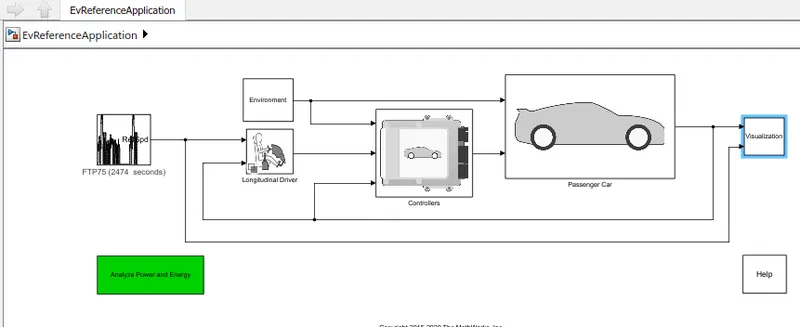
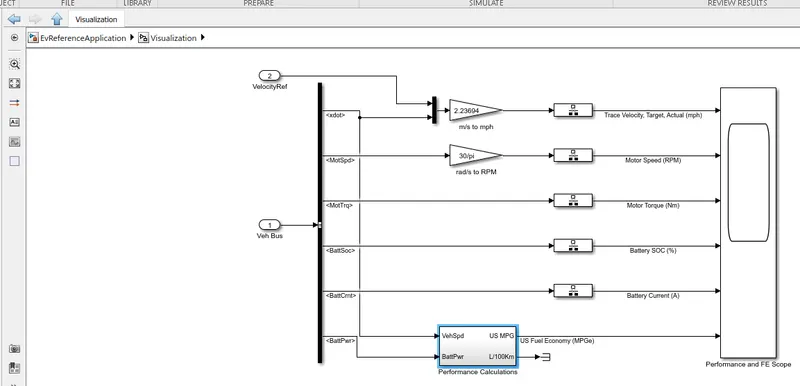
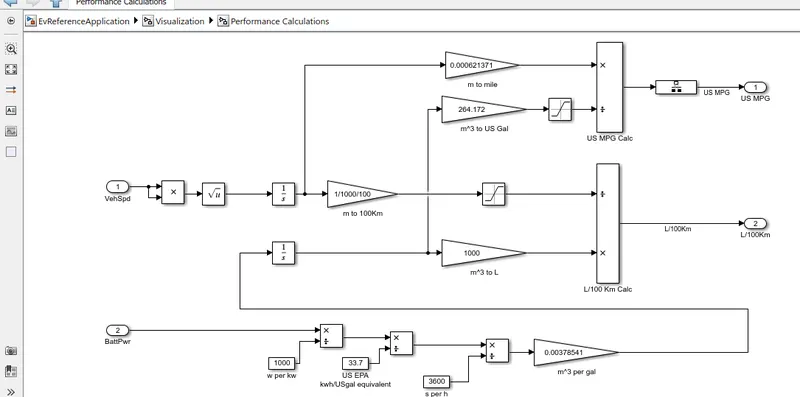
As per the above simulation model it is designed as 1 gallon = 33.7 kwh which is Gasoline Gallon equivalent.
The relation depends on vehicle speed, Battery Power, and Fuel flow.
3. Run the HEV ReferenceApplication with WOT drive cycle. Change the grade and wind velocity in the environment block. Comment on the results.
HEVP4 Reference application is opened in the simulation. In the simulation file, WOT drive cycle is chosen.
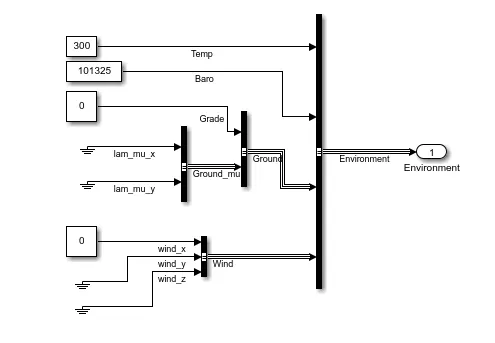
WOT Drive cycle Grade and Wind velocity are to be modified and run the simulation.
The results before modification of the grade and wind velocity are compared with the results after modification.
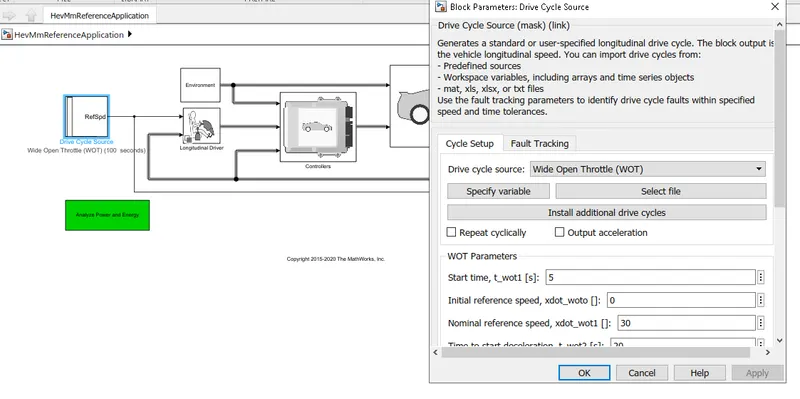
Default block and values in environment block
Grade = 0 and Wind Velocity =0 m/s
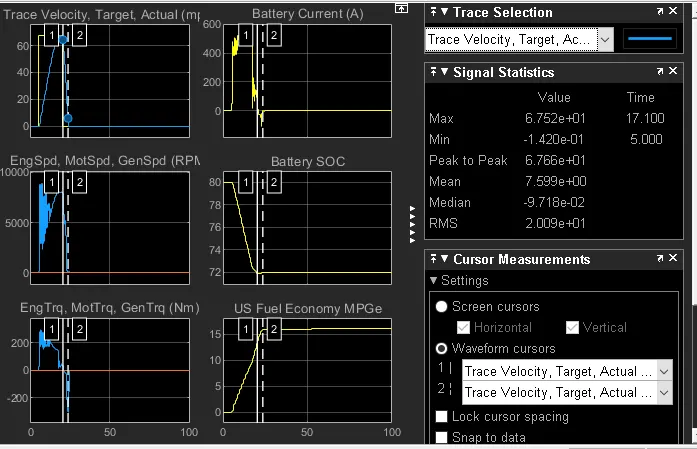
Grade = 5 and Wind Velocity =10 m/s
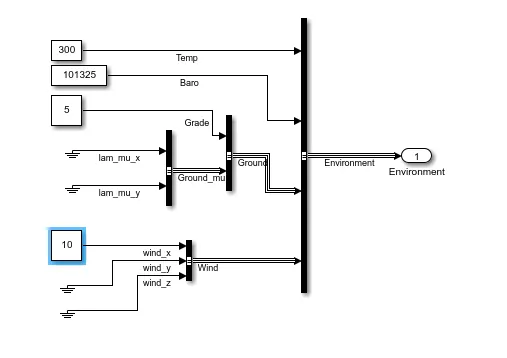
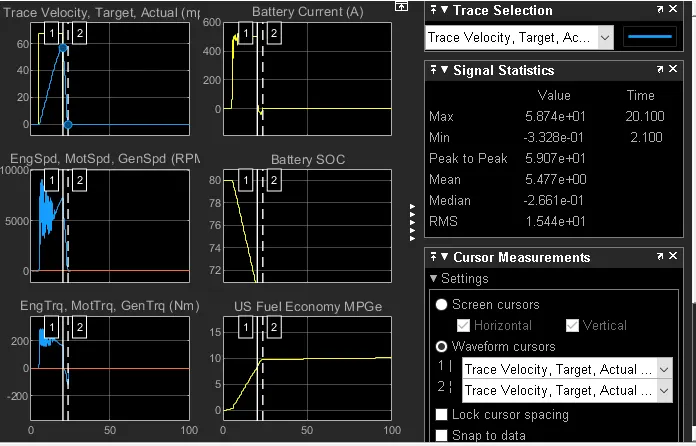
Results Comparision
| Case 1 | Case 2 | |
|
Grade (deg) |
0 | 5 |
| Wind Velocity (m/s) | 0 | 10 |
| Maximum Speed(MPh) | 67.52 | 58.74 |
| Deceleration time (s) | 3.2 sec | 3.6 sec |
| Max Engine Torque (Nm) | 304 | 304 |
| Max Battery Current Drawn (A) | 523 | 526 |
| Battery Soc % | 80% - 71.88% | 80%- 70% |
| Fuel Economy(MPG) | 16 | 10 |
4. Keeping all other parameters the same, compare the simulated results of hybrid and pure electric powertrains.
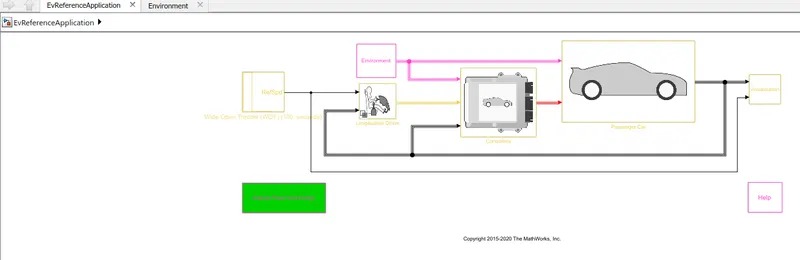
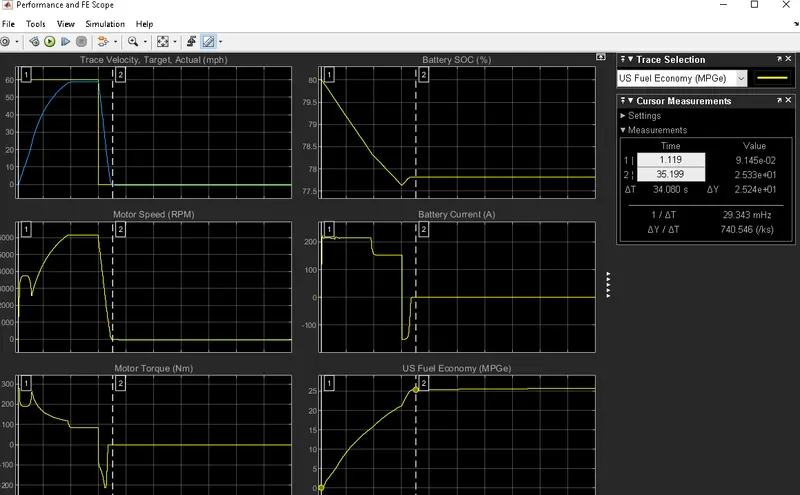
Results Comparision
| Case 2 (HEV) | Case 3 (EV) | |
|
Grade (deg) |
5 | 5 |
| Wind Velocity (m/s) | 10 | 10 |
| Maximum Speed(MPh) | 58.74 | 58.75 |
| Deceleration time (s) | 3.6 sec | 5.1 sec |
| Max Engine Torque (Nm) | 304 | 272.978 |
| Max Battery Current Drawn (A) | 526 | 53.951 |
| Battery Soc % | 80%- 70% | 80 - 77.64% |
| Fuel Economy(MPG) | 10 | 25.33 |
Observations made:
- Deceleration EV is more compared to HEV.
- EV has good Fuel economy compare to HEV.