Week-3 Challenge: ADVISOR Tool
Challenge-3
Use the ADVISOR tool and simulate the following
1. For the EV_defaults_in file, if cargo mass is 500 kg with all other default conditions, can the vehicle travel for 45 km with FTP drive cycle? Conclude your observations.
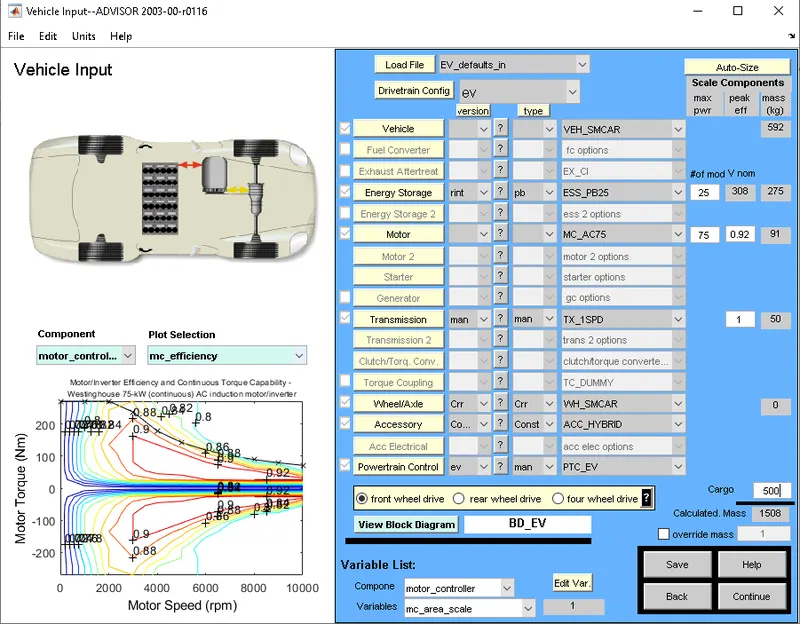
Aim: To run the EV_defaults_in file in the Advisor tool, the Cargo mass is chosen as 500kg. So total calculated mass of the vehicle is 1508kg. Other fields are considered default fields.
Now press continue to set the drive cycle.
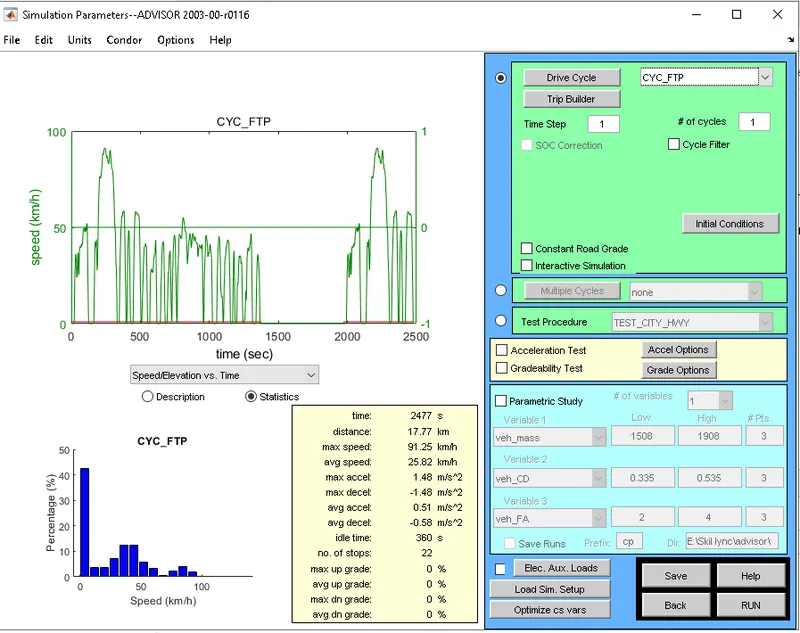
As per the given question, an FTP drive cycle is to be chosen.
The drive cycle cyc_FTP is chosen. Accordingly, a drive cycle display is shown in the figure. The graph is Speed vs time.
As the no. of cycles chosen as one cycle, the distance covered is 17.77km in 2477 seconds. The maximum speed reached is 91.25km/h.
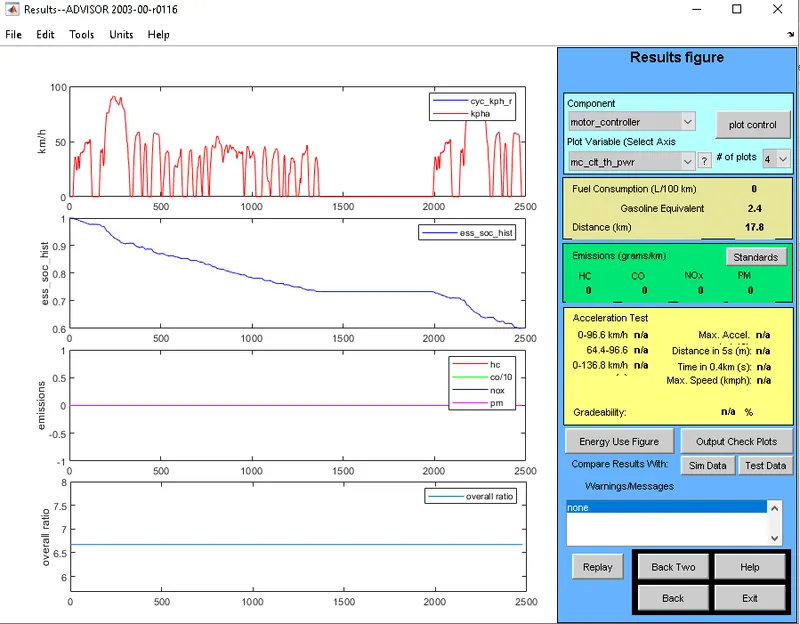
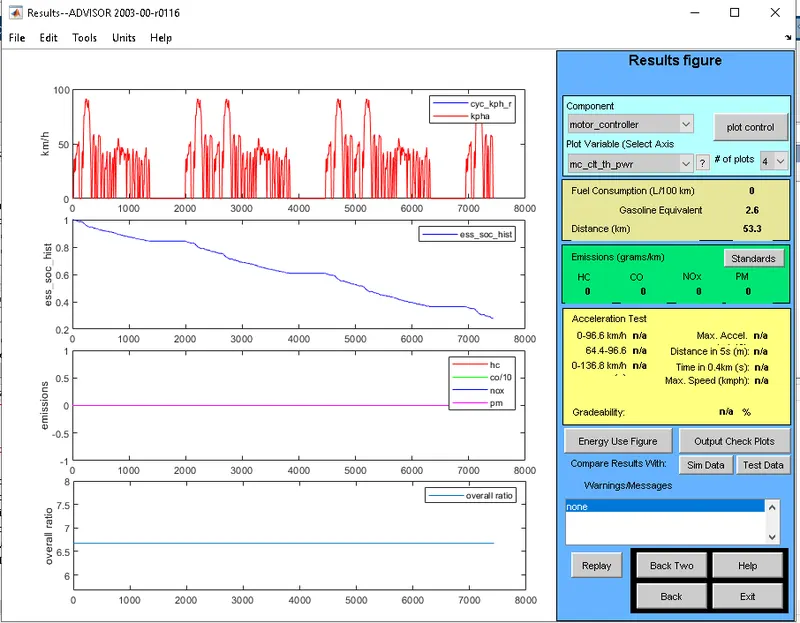
After running the simulation the response shows the drive cycle, SOC, Emissions, and Overall Ratio.
Changing the No.of cycles to 3 so that it is assumed that the vehicle can cover the distance of 45 Km.
But that is not happened as the battery capacity is not sufficient to cover the requested distance.
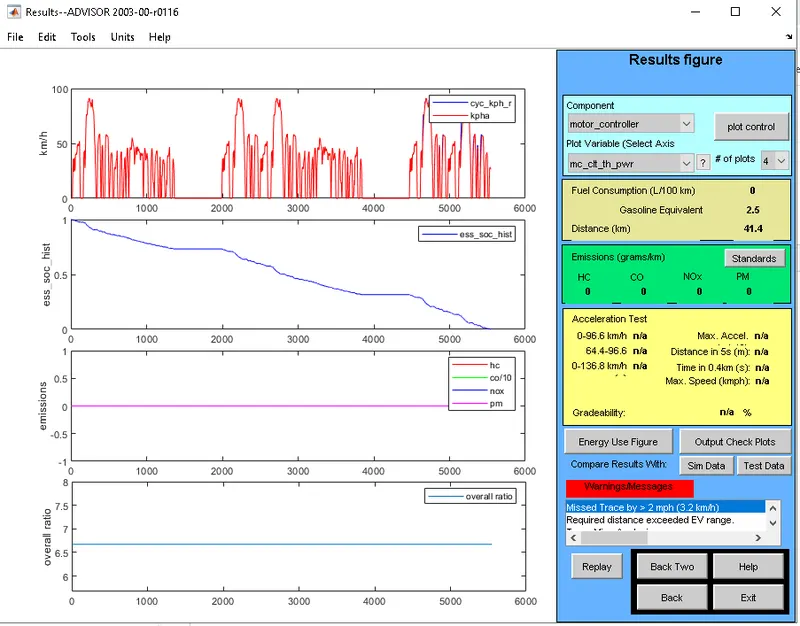
A warning message appeared as the destination is not reaching 45 Km.
Simulation is done with the default ratings of the motor and battery. and the vehicle reaching only 41.4 km with the default battery capacity.
2. In the above case, try changing the battery capacity and repeat the simulation.
Changing the battery capacity from 25 to 45 made the vehicle cover 53.3 km.
3. Perform gradeability test with PRIUS_Jpn_defaults_in file
Compare your results in a table and conclude.
Solution:
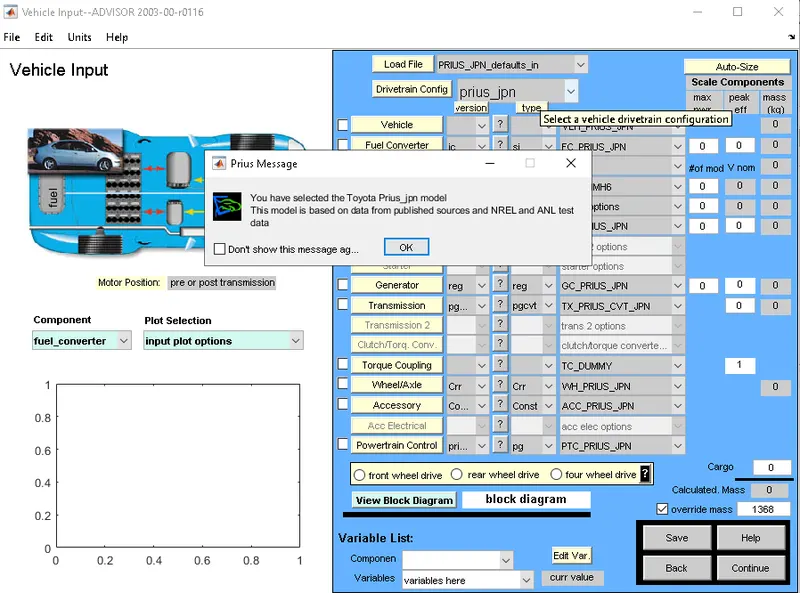
The test is done on PRIUS_Jpn_defaults_in : Changed the file to PRIUS_Jpn_defaults_in
The test message popped out is to be accepted by hitting OK.
Then Press on Continue
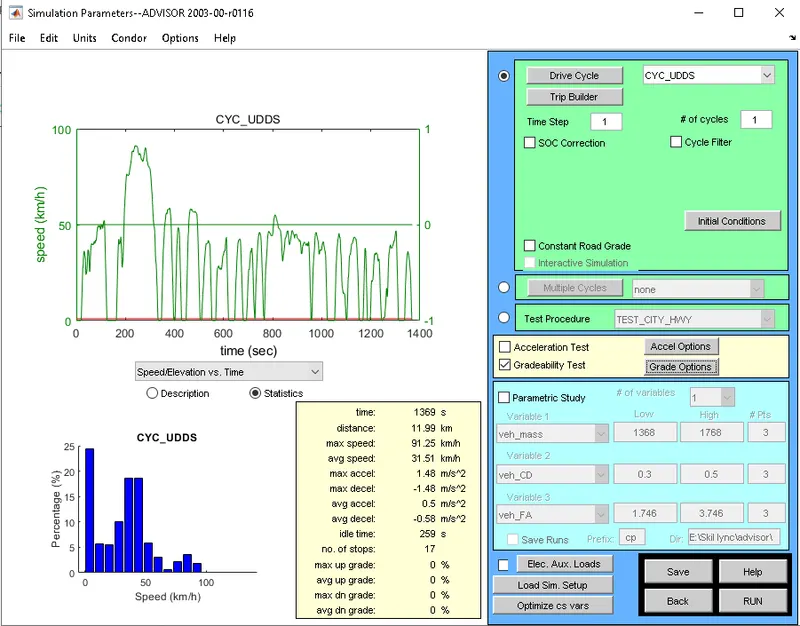
In the above figure, to perform the gradability test at different speeds, Checked the Gradeability check box and clicked on Grade options tab.
Below window is popped out in which the speed option is chosen from 35mph to 55 mph
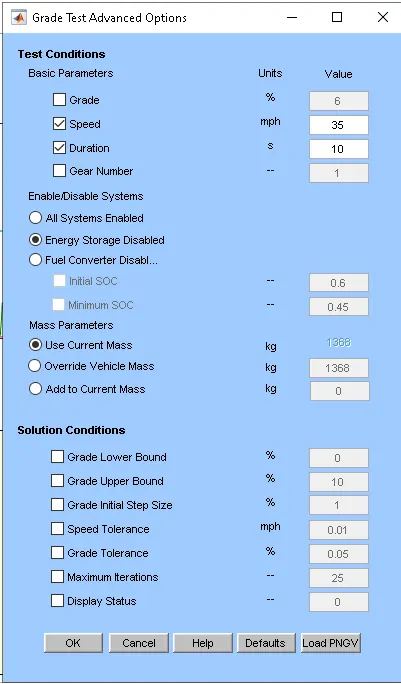
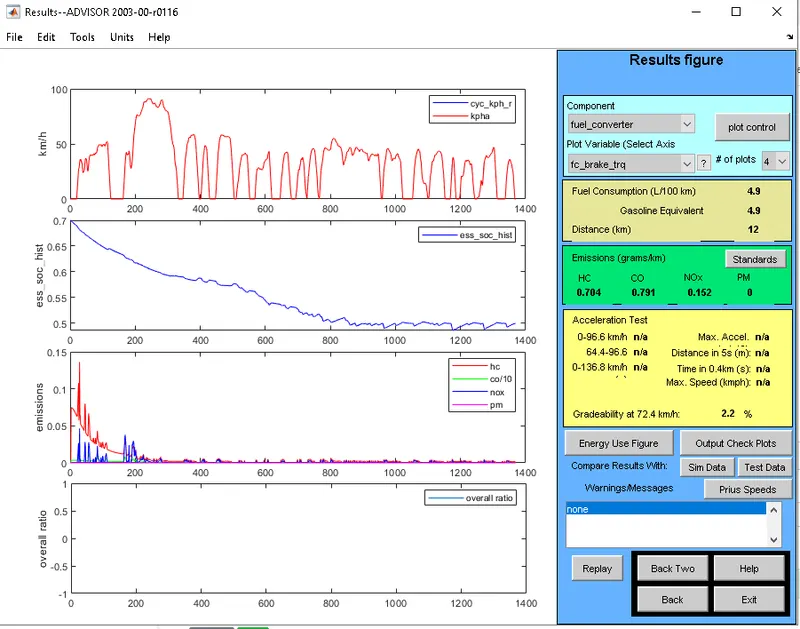
After pressing OK tab in the popped window and Click on RUN, The below results appeared.
In this window, it is shown that the gradeability percentage at different speeds are noted in the table listed below.
| Speed (kmph) | Speed (mph) |
Gradability |
| 48.3 | 30 mph | 2.5% |
| 56.3 | 35 mph | 2.4 % |
| 64.4 | 40 mph | 2.5 % |
| 72.4 | 45 mph | 2.2 % |
| 80.5 | 50 | 2 % |
| 88.5 | 55 mph | 1.7 % |
The tabulated values tell that as the speed increasing from 30mph to 55 mph, grade ability is decreasing.
The result of grade ability is not seen for the speeds below 30 mph so they are not listed in the above table.