Week-4 Challenge WOT Condition Part-2
AIM:
To answer the following questions:
- What is the difference between mapped and dynamic model of engine, motor and generator? How can you change model type?
- How does the model calculate miles per gallon? Which factors are considered to model fuel flow?
- Run the HEV ReferenceApplication with WOT drive cycle. Change the grade and wind velocity in the environment block. Comment on the results.
- Keeping all other parameters same, compare the simulated results of hybrid and pure electric powertrains.
THEORY AND SOLUTIONS:
1) Differences between mapped and dynamic models:
a) THE MAPPED MODEL
- The simulation of the powertrain block set model consists of data that is prebuilt in the lookup table is dealing with mapped data or mapped model. The table provides overall engine characteristics including actual torque, fuel flow rate, exhaust emissions and fuel consumptions. It is used for quasi steady state simulations. The model calculations are very fast.
b) THE DYNAMIC MODEL
- The simulation of the powertrain block set model consists of data that is not prebuilt but it takes the real-time data by calculating every small individual like the movement of vehicle, drag, speed, velocity, wheel braking, etc. which is dynamic data or dynamic model for engine system or motor system or generator system. It uses to analyze the impact of individual engine components on the overall performance.
- The dynamic model calculation is a time taken for a very long time for calculating every data.
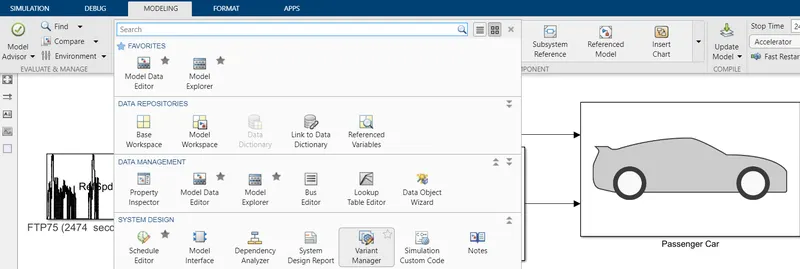
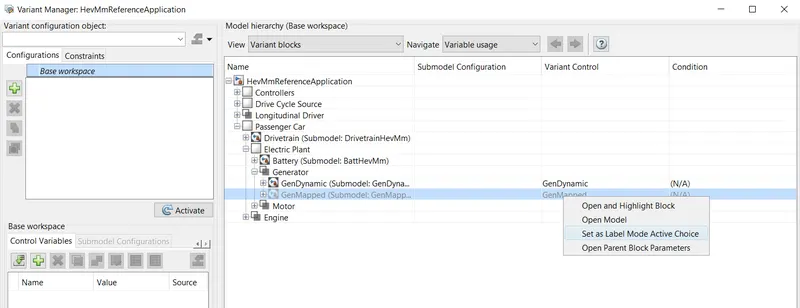
During simulation, we can change the type of model by selecting the variant manager option. The representation is given below.
Under any motor/generator model, select the option of either mapped or dynamic by right clicking on the model and clicking 'set as label mode active choice'.
2) Calculation of miles per galloon by the model:
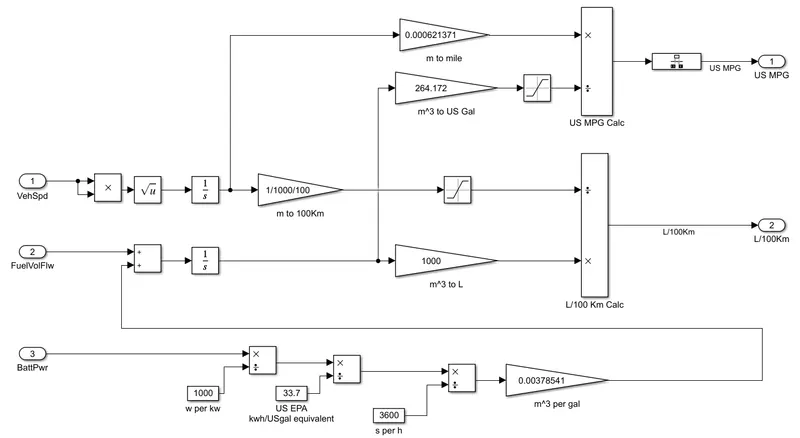
Miles per gallon (MPG) is the unit of measurement for cars to find out the fuel efficiency. In electric vehicle it is replaced with a unit named miles per gallon equivalent (MPGe). One gallon gas is equivalent to 33.7 kilowatt hours of electricity.
The calculation is done by factors such as vehicle speed, fuel volume flow and battery power as inputs. Battery power is taken in kilowatt hour and it is converted to miles per gallon by dividing 33.7. So an electric or hybrid vehicle that uses 29 KWh per 100 miles would get a combined 115 MPGe rating. The model is represented as shown below:
3) HEV reference application:
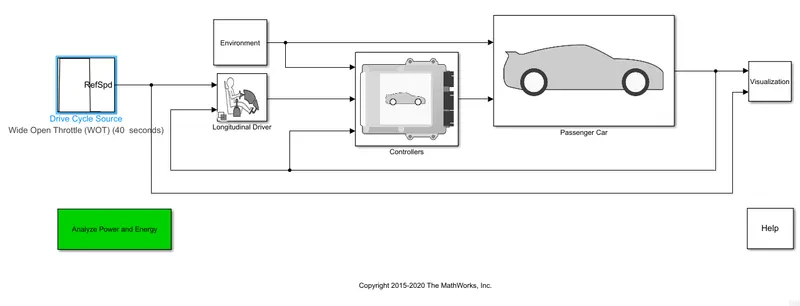
The drive cycle source block is used to generate a specified drive cycle. Here we give the input as wide open throttle (WOT) drive cycle. The representation is shown below.
The wide open throttle drive cycle is run for 100 seconds and the results are visualized with the default input conditions.
case 1) Grade: 0 degrees; Wind velocity:0 m/s
The plots obtained are shown below:
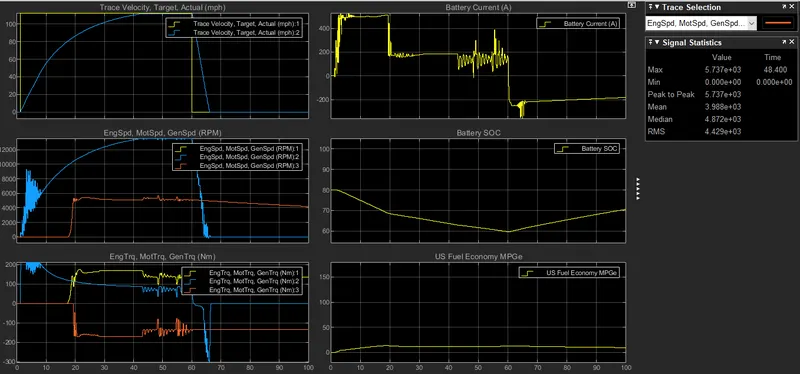
Notice that the actual maximum velocity achieved is 111.7 mph. Velocity tracing plot shows the targeted velocity and actual velocity. Targeted velocity is similar to WOT drive cycle but the actual velocity reacts little slower because the motor cannot generate instant velocity in real. Battery current plot shows that it is increased initially and when deceleration occurs, it is dropped to negetive value because of the regenerative braking. The SOC of the battery increases when regenerative breaking starts. From the speed plot, notice that initially the motor value is high indicating its usage and then generator value increases when SOC value start to decrease. Torque plot shows the values for engine, motor and generator torque. Motor torque will be high initially and then engine value will increase. Motor torque goes to negetive value when breaks are applied due to regenerative braking.
Case 2) Grade: 5 degrees; Wind velocity: 10 m/s
The environment block has the environment variables. It includes the wind velocity, coefficient of friction and grade. The environment substem is represented as shown below:
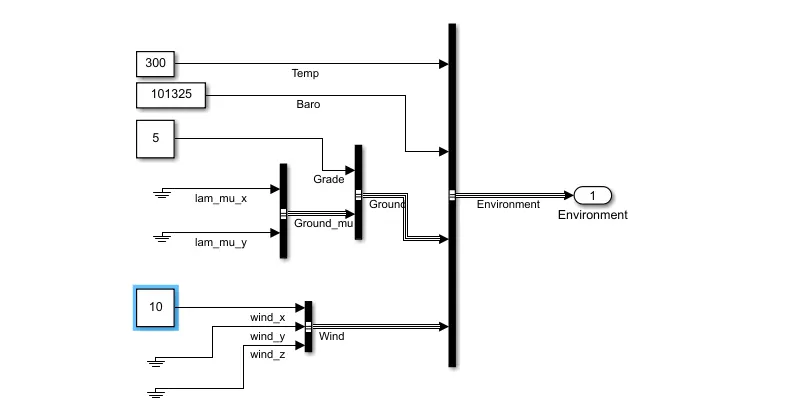
The grade value is changed to 5 degrees and the wind velocity is changed to 10 m/s as shown above. The model is simulated with the changed variables. The plots are shown below:
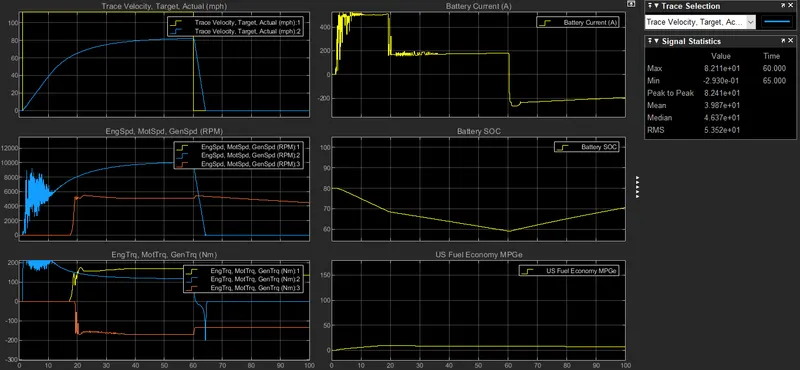
Due to the the wind resistance and the grade, the maximum velocity reached by the vehicle is now 82.1 mph.
Comparision of results and observations :
| Case 1 | Case 2 | |
| Grade | 0 | 5 |
| Wind velocity | 0 | 10 m/s |
| Max velocity achieved | 111.7 mph | 82.1 mph |
| Max engine torque | 174 Nm | 174 Nm |
| Batter SOC % | 80 % to 62% | 80% to 59% |
- The maximum velocity achieved in the second case is lower because of the wind resistance and grade.
- The battery SOC in the second case is lower because more power is required to over come these resistances.
4) Comparision of results for pure electric and HEV powertrain:
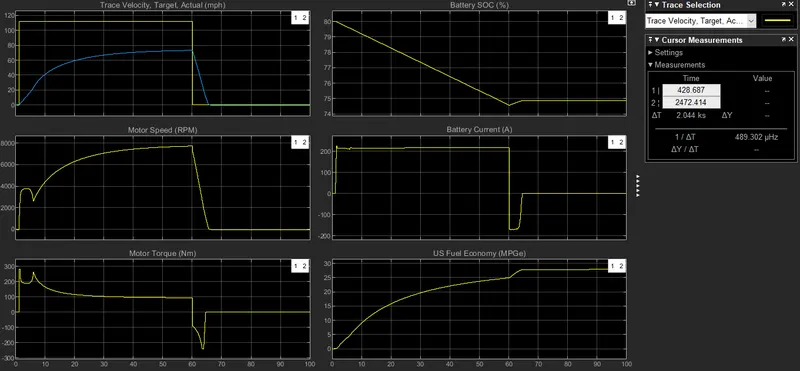
| HEV | Pure EV | |
| Grade | 5 | 5 |
| Wind velocity | 10 m/s | 10 m/s |
| Max velocity achieved | 82.1 mph | 74 mph |
| Max engine torque | 174 Nm | NA |
| Batter SOC % | 80% to 59% | 80% to 74.5% |
Observations:
- The pure EV achieves a lower top speed compared to HEV for the same operating conditions.
- Since the electric motor is the only power source for pure EV, the motor needs higher power rating and torque to propel the vehicle instantaneously.
- Notice that the fuel economy of pure EV is greater than that of HEV.