Week-4 Challenge WOT Condition Part-2
AIM:
- What is the difference between mapped and dynamic model of engine, motor and generator? How can you change model type?
- How does the model calculate miles per gallon? Which factors are considered to model fuel flow?
- Run the HEV ReferenceApplication with WOT drive cycle. Change the grade and wind velocity in the environment block. Comment on the results.
- Keeping all other parameters same, compare the simulated results of hybrid and pure electric powertrains.
AIM 1: What is the difference between mapped and dynamic model of engine, motor and generator? How can you change model type?
There is a explaination on mapped and dynamic SI & CI engine in MATLAB documentation but apart from it we will also try to explain with our own explaination.
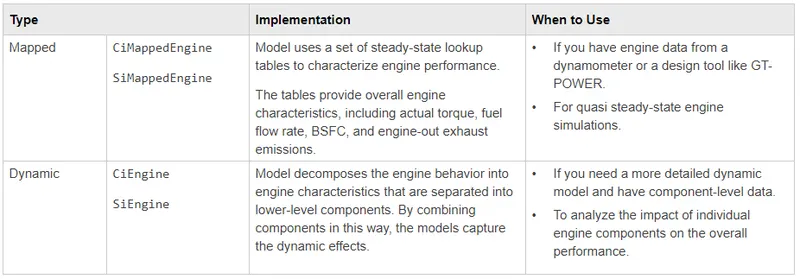
Mapped model basically refers to a model with a precalculated dataset for which the output values are readily available for the corresponding inputs. This basically means we get a fixed output value for a fixed input value. The values here are mapped and stored as data points that are calculated using an actual dynamic model in practice.
A dynamic model performs a real-time simulation of components that actually takes place in an original system to generate an output, depending upon random input situations. In short, both the mapped and dynamic models take in the same input variables and give out the same output variables, but the only difference lies in the way how the output data is generated in each case. A mapped model functions similar to lookup tables as the outputs are stored for corresponding inputs. But the dynamic model uses real-time simulations of various subsystems to generate the outputs.
Changing model variant
The Powertrain Blockset provides reference application projects assembled from blocks and subsystems. Use the reference applications as a starting point to create your own powertrain models.
In this model we get both mapped and duynamic components of engine, motor or generator. It is up to us which variant we want to use. If mapped model is selected already we have the option change it to dunamic model. That option is labelled as VARIANT.
Below pictorial presentation makes it clear how to do so.
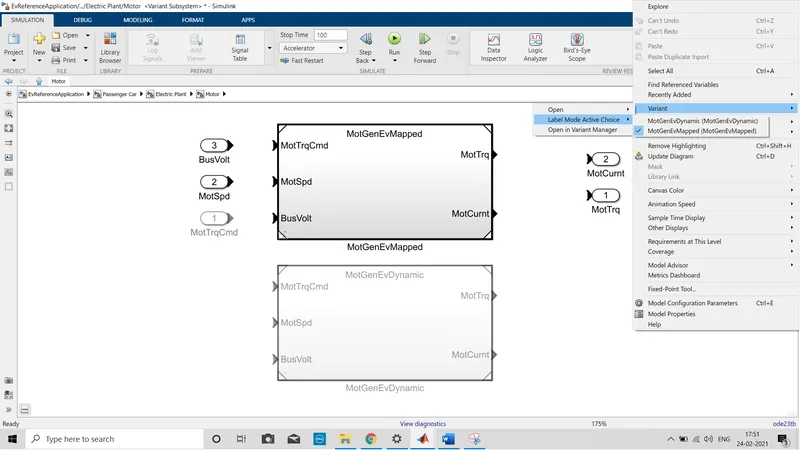
You can see as MotgenEvDynamic is not selected it is light in color because it is not active. Once you make it active using variant option the model will be behave dynamically.
=========================================================================
AIM 2: How does the model calculate miles per gallon? Which factors are considered to model fuel flow?
We have taken HEV input power-split reference application to know how model is calculationg miles/gallon.
Directory to miles/gallon block :

Calculation of miles/gallon block:
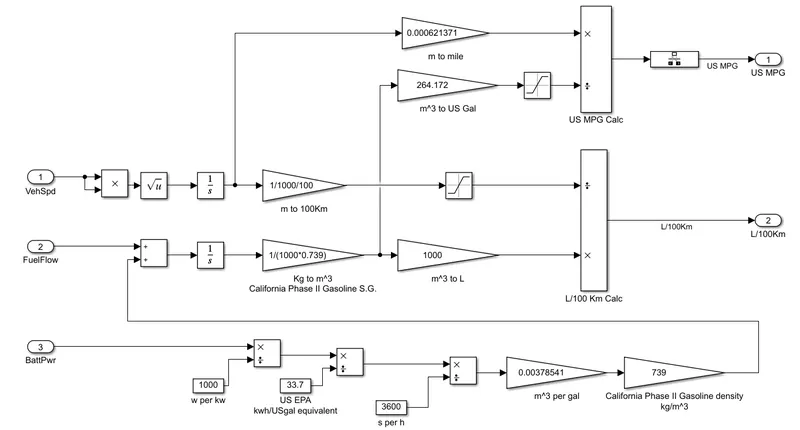
As it is a HEV it is adding both fuel energy and batt. energy to caculate miles/gallon. Batt. energy is converted to its gasoline equvivalent.
Vehicle speed, fuel flow, battpwr are three main parameters to calculate miles/gallon. Rest all block are from conversions.
Below pictorial view gives you idea about conversions that goes on in cal. of miles/gallon
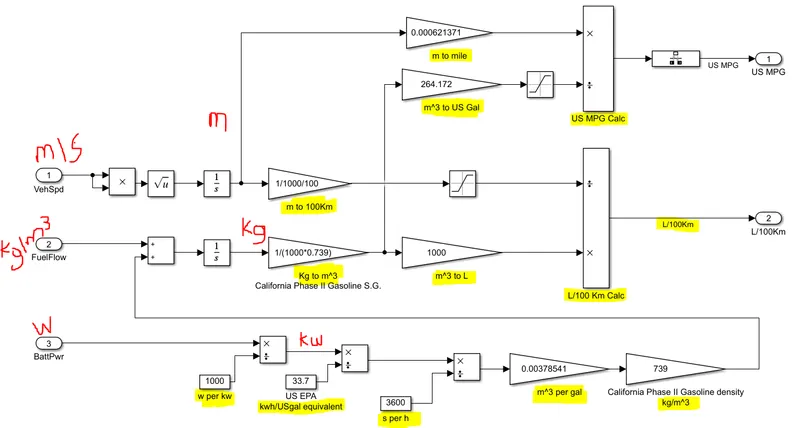
First we get distance by velocity input which is then converted to miles.
Fuel flow is added to its batt power Equvivalent where 1 USgal = 33.7 kwh.
L/100 Km is mostly used by european countries whereas miles/gallon is US standard unit.
Factors considered to model flue flow:
Fuel flow is given as:
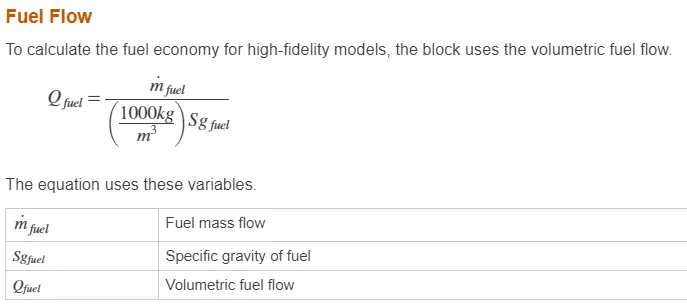
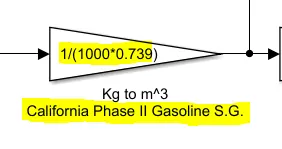
From fig. where we have explained miles/gallon calcultaion, we can see the factors considered while calculating or modelling fuel flow:
1) Acc. California Phase II gasoline S.G specific gravity was assumed as 0.739.
2) Fuel mass flow was assumed to be 1.
3) Eqvivalent batt. power was also added in calculation of fuel flow.
=============================================================================
AIM 3: Run the HEV ReferenceApplication with WOT drive cycle. Change the grade and wind velocity in the environment block. Comment on the results.
HEV — Input power-split model is selected to study the wind velocity and grade effect.
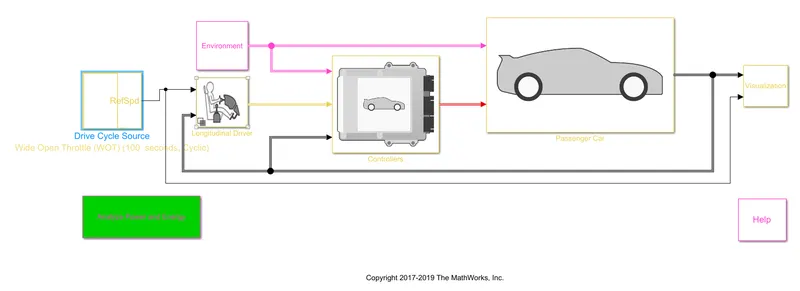
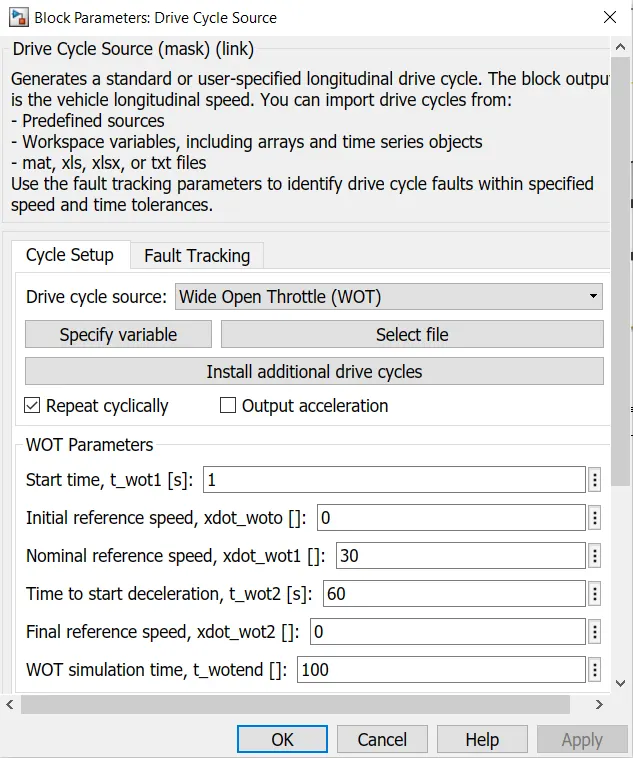
WOT cycle: (speed in m/s)
Location of grade and wind velocity parameter:
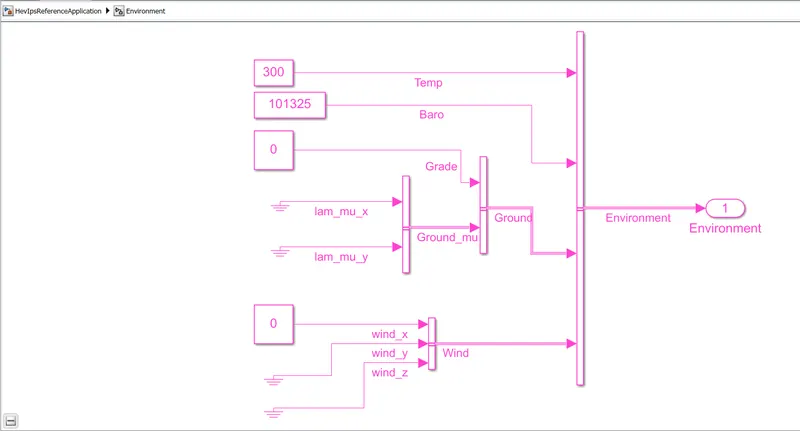
We all know about grade and its effect as it increases. More the grade more the power is required to achieve it.
Now about wind velocity it depends on the speed of the wind where you are driving, if the speed of the wind in your area is 5 kilometers per hour, and you are driving at a speed of 30 kp/h, the speed of wind is 40 kilometers per hour if you are driving against the wind.
Simply putting if you are going against the speed vehicle would feel some resistance and if you are going with it vehicle wont feel any resistance so velocity will have 2 values here positive (Against) negative (with it) as per the design of this model.
Here are the simulation results:
a) Grade=0 & Wind velocity=0
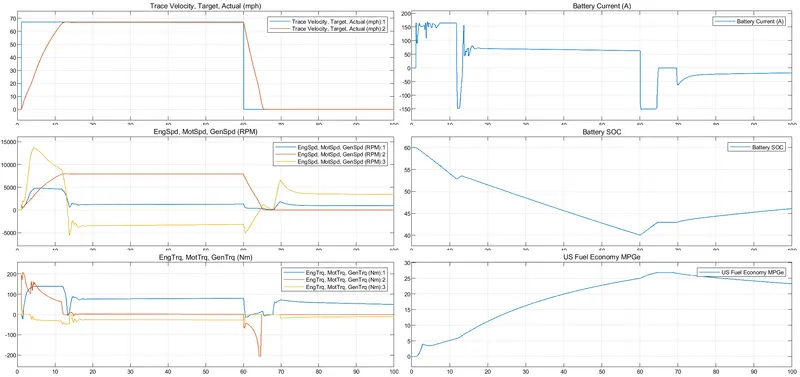
b) Grade= 8 & Wind velocity= 0
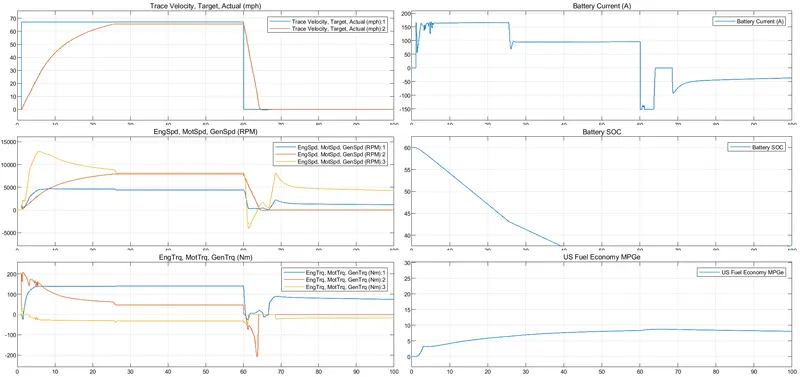
c) Grade= 0 & Wind velocity= 10
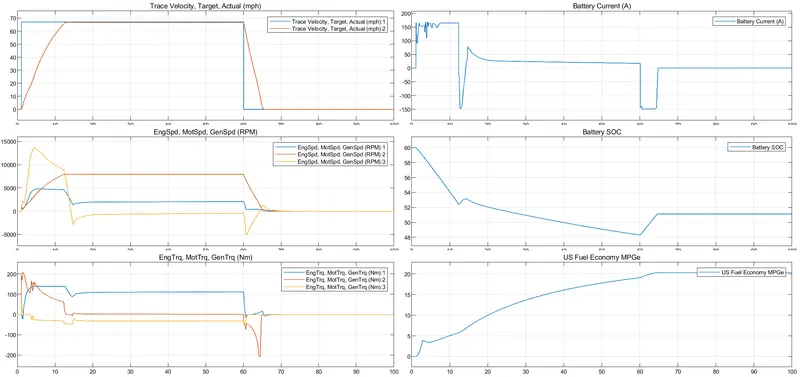
d) Grade= 8 & Wind velocity= 10
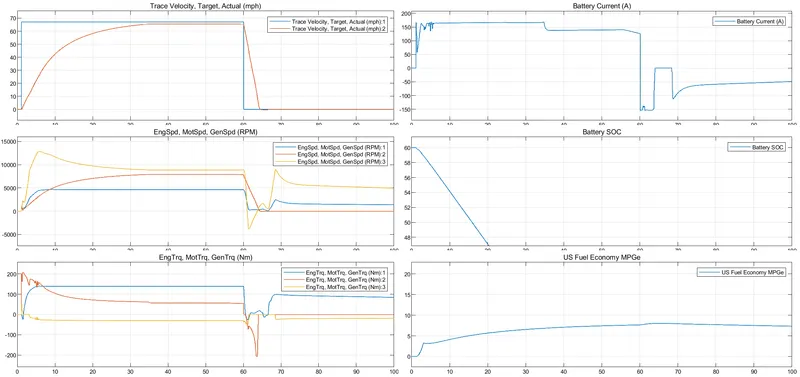
e) Grade= 8 & Wind velocity= -10
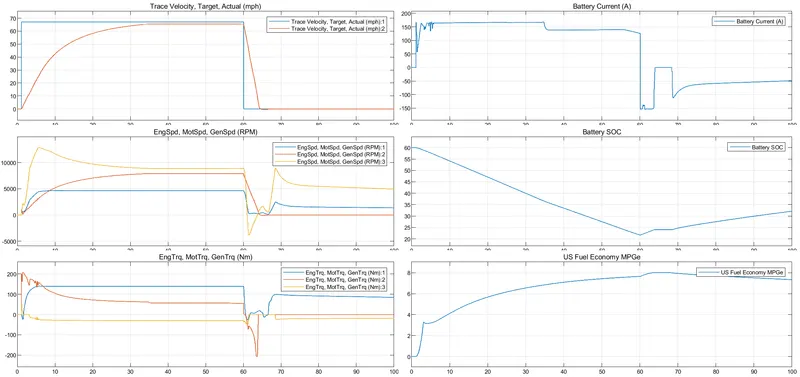
f) Grade=0 & wind velocity=50
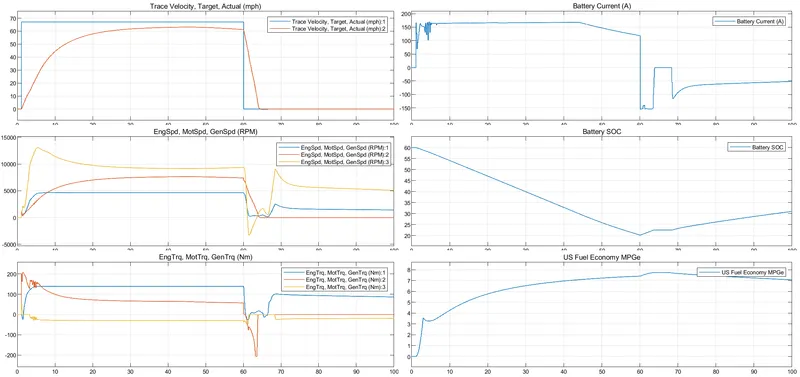
OBSERVATIONS:
1. When grade alone was acting on vehicle acceleration time increased and vehicle achieved speed of 66.7 mph though input was 67.1 mph
2. When wind velocity was acting alone acceleration was fine but there was a minute difference in input speed from drive cycle and actual vehicle speed.
3. When both grade and wind vel. where acting the speed achieved was low and the acceleration time got increased.
4. We gave -10 as wind velocity input and grade=8 to observe what if vehicle was moving with wind velocity and we found that with Grade=8 and velocity=-10 the speed achieved was 65.8 and with Grade=8 and velocity=10 the speed achieved was 65.6. But it is a very minute difference.
5. To make conclusive statment for effect of wind velocity on vehicle we chose wind vel. = 55 and we observed that vehicle was only able to achieve max speed of 63.1 mph though input speed was 67.1 mph.
6. Intially when vehicle needed to reach 67 mph the total power was split between battery(dark orange line) and engine (blue line). After reaching max speed vehicle checked batt. SOC and from fig we can see SOC was sufficient to enough to run vehicle on batt. alone.
We can also conlcude that for low value of wind velocity vehicle speed doesn't get affected much.
=========================================================================
AIM 4: Keeping all other parameters same, compare the simulated results of hybrid and pure electric powertrains.
EV powertrain configuration:
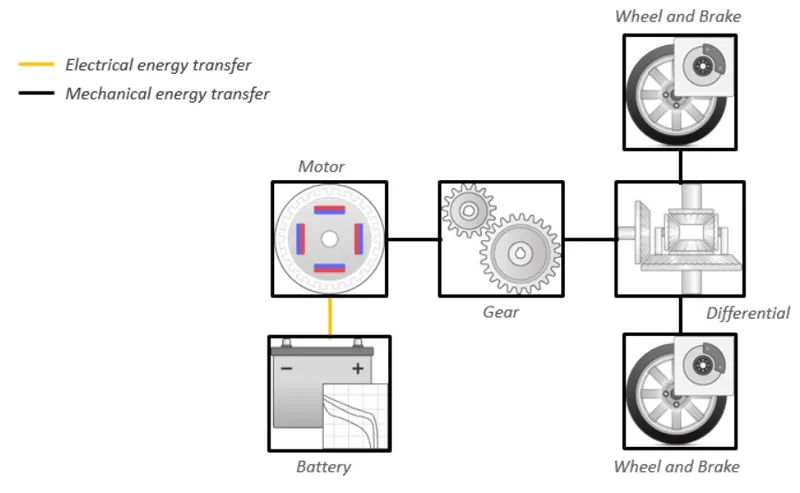
HEV P2 powertrain configuration:
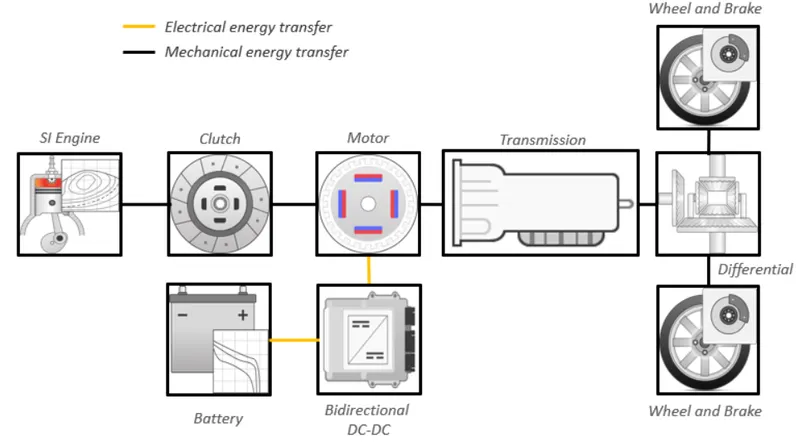
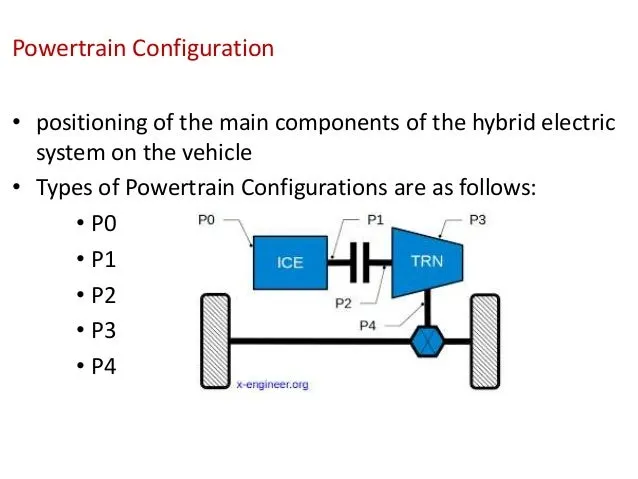
HEV are also classified on the basis of motor placement. In P2 type HEV P2 motors can either be side-attached, using a belt, or integrated between the ICE and transmission. Why P2? - Becuase its config. is almost similar to that of EV.
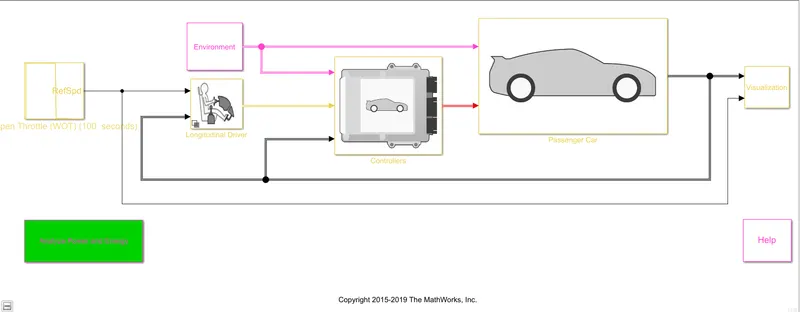
Simulink model:
We will compare both powertrains on the basis of WOT drive cycle where max speed is 40 m/s, run time is 100 sec and decceleration happens after 70 secs.
Simulated results:
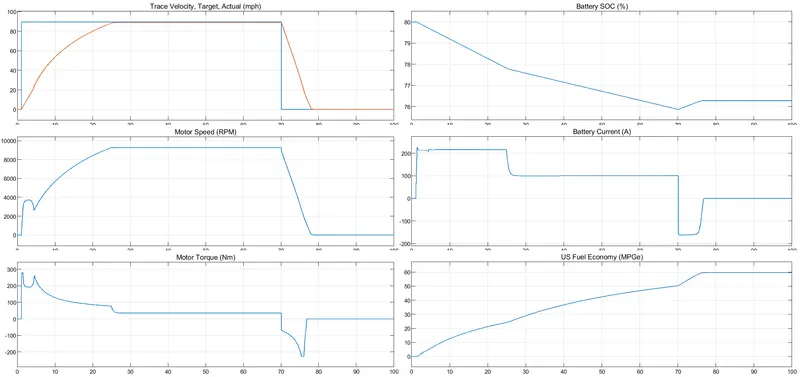
EV:
HEV P2:
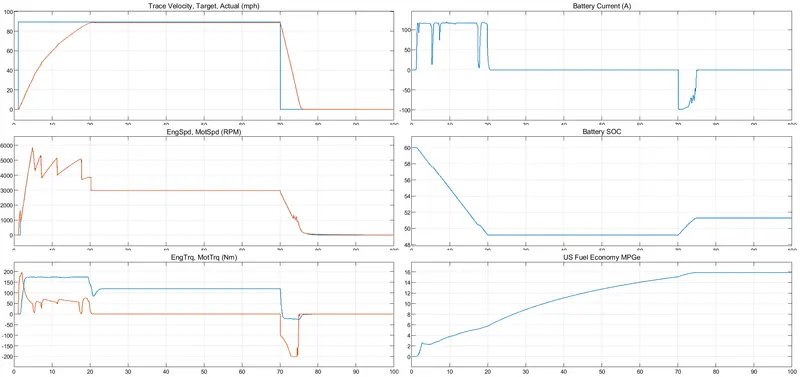
Comparisons/Observations:
1) Acceleration: Acceleration is high in HEV P2 due to combine effort of both engine and motor. EV achieved max speed at 25 sec whereas HEP P2 max speed at 20 sec.
2) Motor rpm went upto almost 9500 where as in HEV it went upto 5800 only as power is shared in HEV. Same goes with torque. Extra torque was provided by motor to achieve high acceleration.
3) SOC got down from 60 to 50 in HEV P2 and 80 to 76 in EV.
4) Fuel economy of EV was better than that of HEV P2.