Week-4 Challenge WOT Condition Part-2
WIde Open Throttle (W.O.T) Condition Part -2
Questions To Solve:
1.What is the difference between mapped and dynamic model of engine, motor and generator? How can you change model type?
Solution:
The mapped and dynamic model of engine, motor and generator are the vehicle components obtained from powertrain blockset.
what is power train blockset?
Power train blockset is actually used for modelling,design & analysis of hybrid electric vehicle(HEV), electric vehicle(EV). Here all components llike various mechanical & electrical individual parts of both HEV & EV vehicles are available. Power train blockset provides fully assembled reference application models of automotive powertrains, including gasoline, diesel, hybrid, and electric systems. It includes a component library for simulating engine subsystems, transmission assemblies, traction motors, battery packs, and controller models. By using the blockset of components we can simply connect different components by giving the parameter values to get the results of final vehicle model and this vehicle model is simulated to analyse the output which resembles the actual behaviour of vehicle. If more realistic, practical and real life data is given as an input to the vehicle then there is a chance of getting the actual realistic vehicle performance known after simulating the model by matlab simulink software.
Motor generator mapped model of engine is a static model which is going to work faster and it is based on the data given as input.This mapped model is used for fast system level simulations when u dont know detailed motor parameters.
Here is the way to change the model type by considering the EV reference application from the HELP of simulink.
Procedure : open EV reference application model, then go to passenger car subsystem block from there open electric plant there we get both of the mapped and dynamic block systems.The below is the mapped model considered as default for EV vehicle application along with dynamic model which is comment out.
If we want to change the model we need to right click and select the variant, select label mode active choice then select MotGenEvDynamic.
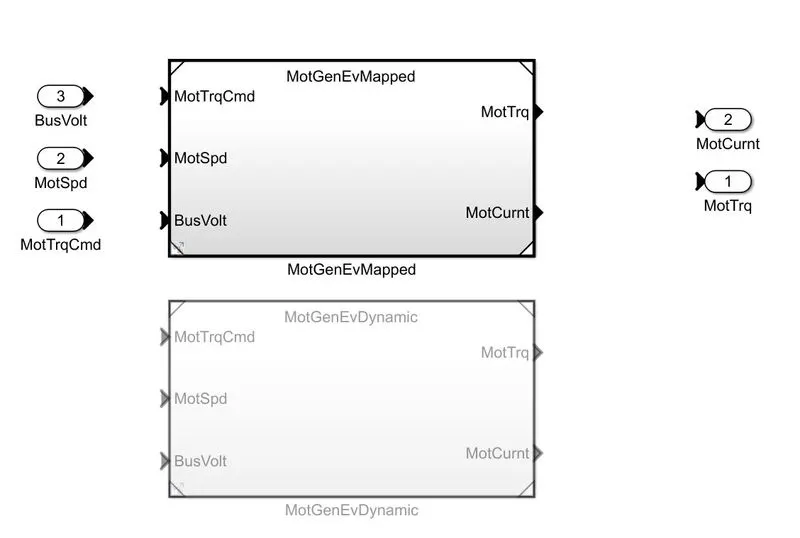
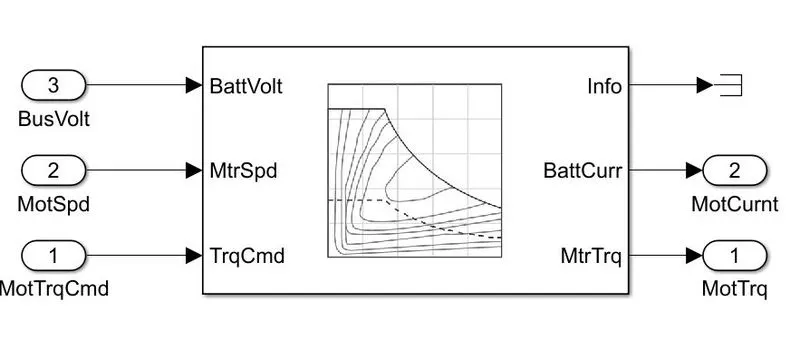
Actual mapped model uses a mapped motor and inputs from the controller which gives output as battery currrent and motor torque.
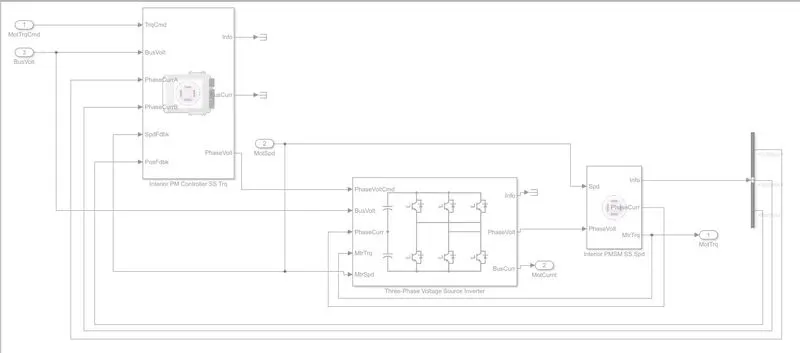
Dynamic model is an actual model going to represent the actual components of system . we can use any of the two models for vehicle design and modelling. It contains the Interior PM controller, three phase voltage source inverter and internal permanent magnet synchronous machine(PMSM).
Conclusion: so the difference between both the models and changing one model to another is explained.
2.How does the model calculate miles per gallon? Which factors are considered to model fuel flow?
Solution
Miles per gallon is generally the miles covered by the vehicle per 1 gallon(3.8 lts) of fuel this will be the case in conventional IC engine vehicles. Coming to the electrical vehicles the no of miles covered is equivalent to the range of the vehicle which depends on the battery capacity. But the HEV uses both engine and battery so the vehicle can run on the battery as well as the engine depends on the torque and power requirement.
From the visual simulation block we can see the performance calculations block the model calculates miles per gallon for EV vehicle.

Miles per gallon(MPG) calculated by using differrent simulink blocks: From the battery power input in kw is converted to m^3 per gallon this is integrated and the ouput .
The integrated output from battery power in US Gallon along with vehicle speed in miles are taken as inputs and the final result in US MPG is obtained.
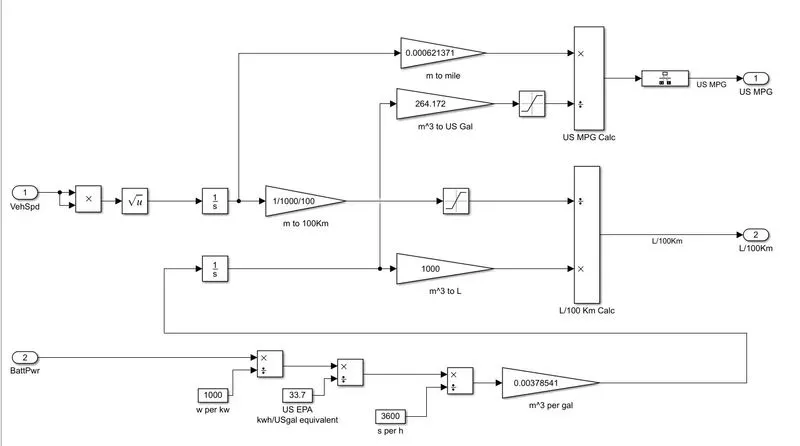
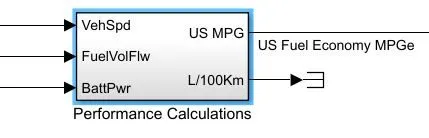
The procedure to know the factors considered to model fuel flow is obtained from HEV vehicle reference application with multimode case. From the visual simulation block we can see the performance calculations block the model calculates miles per gallon for HEV vehicle.
STEP 1:
STEP 2:
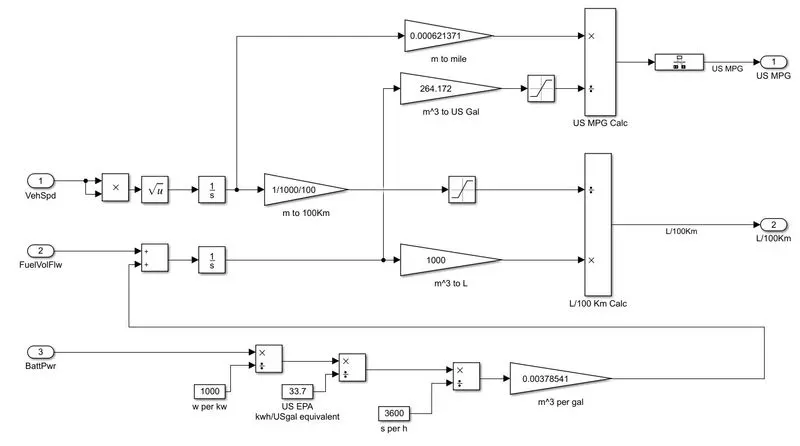
From the performance calculations block the model calculates miles per gallon and fuel volume flow for HEV vehicle. The model calculates miles per gallon and fuel flow with the input data from 1)vehicle speed 2)fuel flow 3)battery power.The integration of speed w.r.t time gives the distance travelled by the vehicle is taken in miles along with the fuel flow rate in m^3 to litres. The fuel flow input is obtained from the battery power from kw conversion done by using different mathematical and gain blocks from Simulink which gives the final ouput in miles per gallon can be viewed and known from the performance calculations block.
According to the model VEHICLE SPEED & BATTERY POWER are the main factors considered to model fuel flow as per the calculations of model
BATTERY POWER: Battery power in kw is converted to m^3 per gallon this is fed as input to the fuel flow. Both the fuel flow and vehicle speed used the input data and obtained the result in (L/100Km) means the amount of fuel required to run the vehicle for 100km.
VEHICLE SPEED: speed of the vehicle is the major deciding factor for both the battery power and the amount of fuel consumption. High vehicle speed can drain the battery and fuel where as average or medium vehicle speed can consume less fuel and save battery power aswell.
Conclusion: From both the EV AND HEV vehicles the miles per gallon calculation done as per the reference application and the factors affecting the fuel flow are well known to us .
3.Run the HEV ReferenceApplication with WOT drive cycle. Change the grade and wind velocity in the environment block. Comment on the results.
Solution:
Drive cycle source block: This block generates standard or user specified drive cycles i.e velocity vs time, WOT drive cycle is kept as the vehicle input drive cycle from the default drive cycle keeping all the other parameters same and the output result is obtained after simulation is explained below.
wot drive cycle: It is the open throttle condition of the vehicle with in no time from initial acceleartion of zero speed to the highest speed with full open throttle.
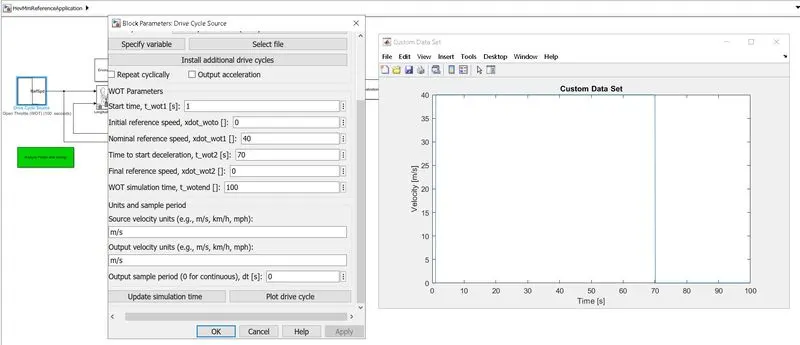
step 1 : wot drive cycle taken with nominal reference speed of 40 mph and at 70 sec time the vehicle starts decelarating to zero speed at 100 th sec taken as total time considered for the vehicle. The drive cycle plot obtained as per the input data given.
Result obtained with wot drive cycle:
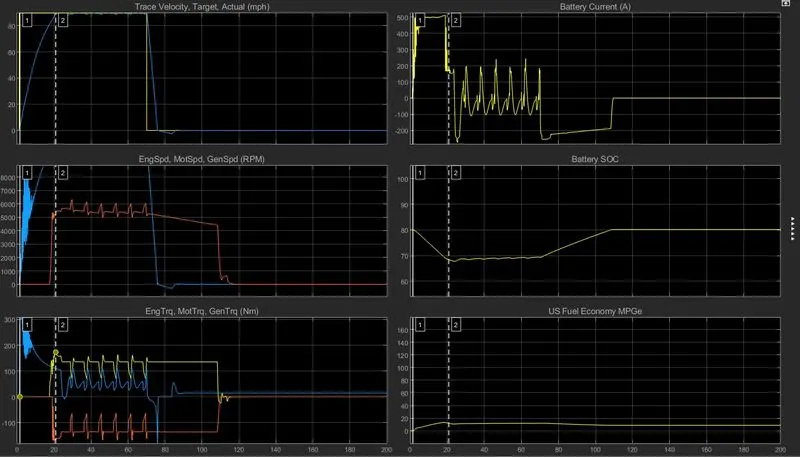
1)Trace velocity: The velocity of the vehicle is matching with the wot drive cycle input and took approximate 20 sec to reach the highest speed and then started decelerating at 70sec.
2)Motor speed(RPM): speed is high when the vehicle is in acceleration and less when the vehicel starts deceleration.
3)Motor torque (Nm): Maximum at 300 nm when the vehicle initial starting condition decreased when the vehicel is in full acceleration at this stage the motor speed is high then to zero and to negative value of (-200) in the deceleration and again reaches to positive value of more than 1 when the vehicle reaches to starting zero speed.
4)Battery SOC (%):The battery state of charge (soc) has come down from 80% to 68% this means the vehicle run by the battery while acceleration and dicharged the battery to 12% and while in regerative braking mode the battery recharges to 80% again.
5)Battery current (A): The vehicle draws a current of 500 amp to accelerate the vehicle as wot condition and the current value has come down after the vehicle decelerates and again starts building from a negative 250 amps to zero value in the regenerative braking mode.
6)US fuel economy (MPG): The fuel economy incresed from 0 to 15 when the vehicle reaches the top speed then after there will be a decrease in the level beacuse the vehicle is decelerating.
Environment block: This block is a subsystem created to input the different parameters to the vehicle like road grade, atmospheric temperature & pressure, wind velocity.
Procedure to change grade and wind velocity in the environment block to 15 each.
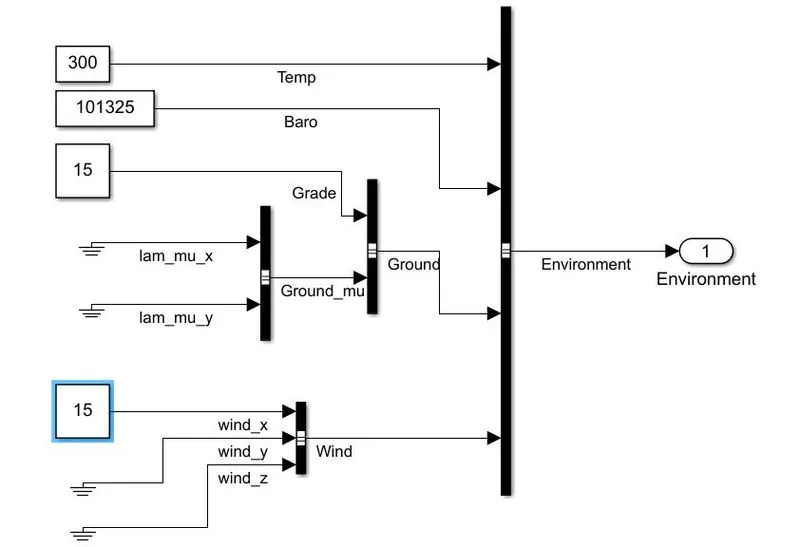
Result after simulation with wot drive cycle with grade and wind velocity changed to 15 each:
comparision of results obtained with only wot drive cycle and another result with wot ,grade and wind velocity involved:
1)Trace velocity: The velocity of the vehicle is not matching with the wot drive cycle input and able to reach only 30mph because the forces acting on the vehicle is more due to the affect of gradeability and wind velocity.
2)Motor speed(RPM): The motor maximum speed of 9000rpm is not sufficient to accelerate the vehicle to its maximum speed because to ovecome the opposing forces of grade and wind the vehicle speed is compromised till the end of 70sec. so from 9000rpm the speed decreases to 5800rpm even before the decelerating time of 70sec and continued with 5800rpm till 70sec and then decelerated to zero.
3)Motor torque (Nm): started with Maximum at 300 nm but not able to generate the acecelearting force required by the vehicle because of grade and wind velocity. Here the motor torque and motor speed are used mostly to overcome the opposing forces of grade and wind velocity because of this vehicle is not able to match the speed of wot drive cycle.
4)Battery SOC (%):The battery state of charge (soc) has come down from 80% to 55% at the end of 70sec from here the vehicle starts decelerating and with regerative braking mode the battery recharges to 80% again.
5)Battery current (A): The vehicle draws a current of 500 amp to accelerate the vehicle as wot condition and the current value has come down to 180 ampere before the vehicle decelerates and again starts building from a negative 250 amps to zero value in the regenerative braking mode.
6)US fuel economy (MPG): The fuel economy is almost close to zero and never increased through out the time period.
Conclusion: The vehicle performance has decreased from no grade and wind velocity involved to grade and wind velocity involved and taken as 15 each as part of environment conditions. Here the vehicel is not able to acheive its highest speed because of the forces acting like a) Aero dynamic drag force b)Rolling resistance force.so these forces made the vehicle power and fuel economy compromised.so based on the results obtained the vehicle speed is more in the case of no grade and wind velocity considered.
4.Keeping all other parameters same, compare the simulated results of hybrid and pure electric powertrains.
solution:
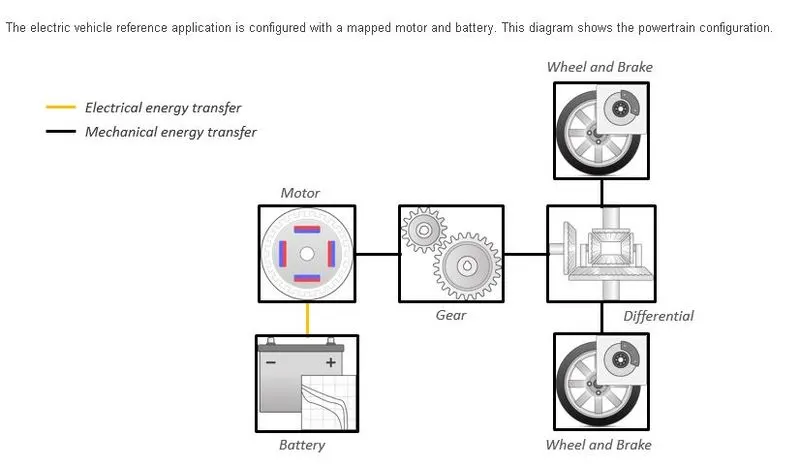
EV image showing vehicle components involved:
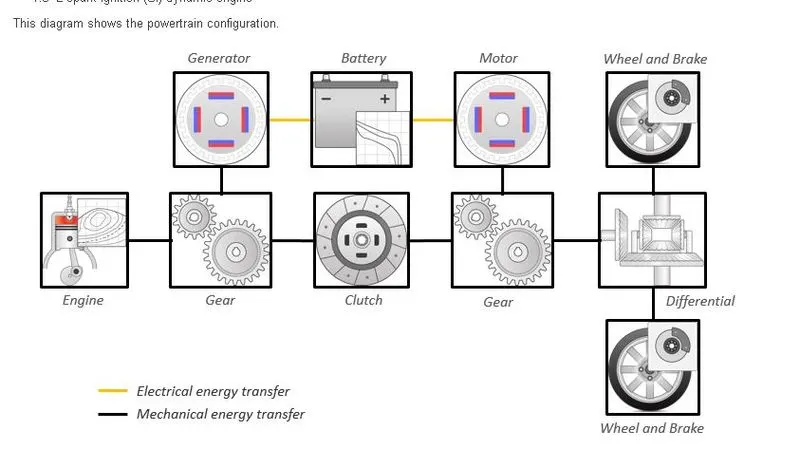
HEV image showing vehicle components involved:
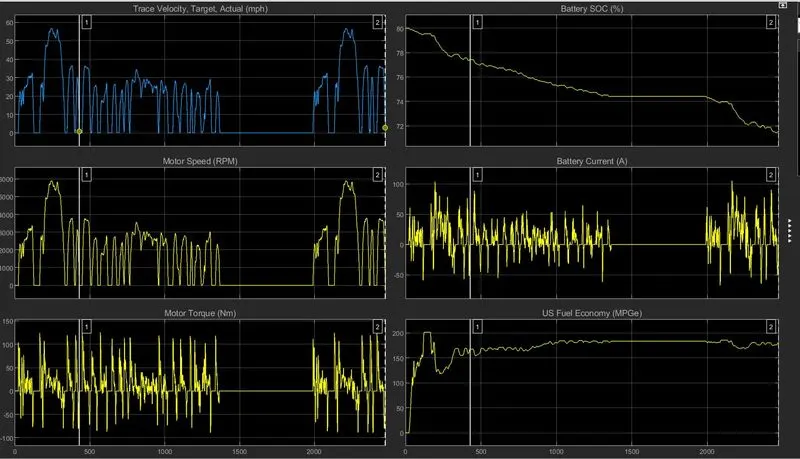
Output simulation result of EV vehicle with FTP 75 drive cycle as default keeping all the other parameters same:
Output simulation result of HEV vehicle with FTP 75 drive cycle as default keeping all the other parameters same:
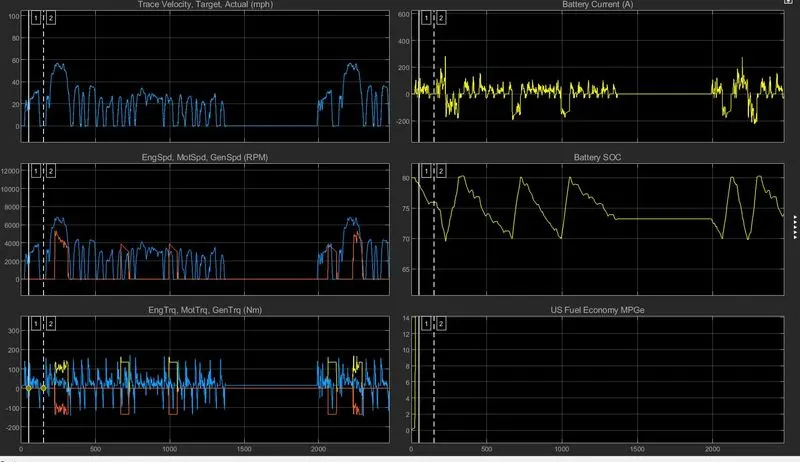
Comparision of results of HEV & EV with FTP Drive cycle keeping all the parameters same as default :
1)(A)Trace velocity of EV: Both the trace & target velocities are overlapping each other following the FTP 75 drive cycle
(B)Trace velocity of HEV: Both the trace & target velocities are overlapping each other following the FTP 75 drive cycle
2)(A)Motor speed of EV(RPM): The motor maximum speed is 5800 rpm following the FTP 75 drive cycle .
(B)Motor speed of HEV(RPM): The motor maximum speed is 7000 rpm following the FTP 75 drive cycle where as the engine & generator speeds are overlapping each other with the maximum value of 5500rpm might be used less to operate the vehicle compared to motor.
3)(A)Motor torque of EV(Nm): Torque reached to a maximum value of 130Nm when the vehicel is at initial starting condition at speed zero as per the input drive cycle of FTP 75 . Following the drive cycle the torque is less when the vehicle reaches to the maximum speed where ever in the drive cycle and with the decelearation of vehicle the torque is reduced to zero and reaches to negative value from there it has again able to reach its maximum value with the vehicle coming to zero speed or at vehicle intial standstill condition.
(B)Motor torque of HEV(Nm): Motor torque maximum at vehicle starting condition will be reduced as the vehicle speed increases following the drive cycle. Here in HEV apart from the motor, engine with generator is also operated to drive the vehicle as per the torque and power requirement of vehicle but both torques values are positve and negative always in all the instants where it is required to run the vehicle.
4)(A)Battery SOC of EV (%):The battery state of charge (soc) will decrease as long as the vehicle is running using the battery power but whenever the vehicle is decelerating the battery will be recharged again upto an extent which depends on the deceleration time of the vehicle called regenerative braking mode.
(B)Battery SOC of HEV (%) : Here the battery operating regions are set between 80% -70% and may be useda thermistor control method to operate the battery charging and discharging limits. Here the vehicle can use both the battery power and fuel at a time according to the power requirement. According to the vehicle operating mode either the battery state of charge or the fuel is going to get consumed by the vehicle. But whenever the vehicle is decelerating the battery will be recharged again upto an extent which depends on the deceleration time called regenerative braking mode of the vehicle and also the battery charging power is supplied by the vehicle when it is running with the engine mode from the generator so the battery can be recharged in both ways either in regenerative braking mode or in engine mode.
5)Battery current of both EV & HEV in (Amp): The vehicle draws a less, moderate to high current according to the acceleration requirement of vehicle at any instant in the drive cycle when the vehicle is operated in EV mode but the battery current is increased again when the battery is recharged either by the regenerative mode or by the engine generator. But the vehicle consumes fuel when it is operated in engine mode. of 500 amp to accelerate the vehicle as wot condition and the current value has come down to 180 ampere before the vehicle decelerates and again starts building from a negative 250 amps to zero value in the regenerative braking mode.6)US fuel economy (MPG): The fuel economy is almost close to zero and never increased through out the time period.
Note: In HEV vehicle as per the battery operating regions set by the controller the battery charging and discharging currents are inbetween (-250 amp to 300 amp) maintained through out the drive cycle.
6)(A)Fuel Economy of EV (Miles per gallon) : Fuel economy initially started from zero and reached to a maximum 200 after it is continued inbetween 150 to 180 as per the drive cycle pattern. so any where the fuel economy depends on the driving cycle.
(B)Fuel Economy of HEV (Miles per gallon) : Fuel economy only able to reach 14(MpEG) and maintained from initial zero condition because the vehicle operated with both battery mode and engine mode simultaneously and alternatively.
Conclusion:
1)Velocity of the vehicle is attained in both EV and HEV modes according to the input drive cycle.
2)Maximum power and torque requirement of vehicle is satisfied only when the vehicle operated in HEV mode where both motor and engine can operate at the same time which is not the case with EV vehicle.
3)Battery Soc and Battery current is well maintained by implementing the suitable cotroller method and also the drive cycle pattern of the vehicle.
4)Fuel economy is maximum when the vehicel operated in EV mode only and less when operated either with engine mode or by using both engine and battery modes simultaneously.