Week-4 Challenge WOT Condition Part-2
1. To find the difference between mapped and dynamic model of engine, motor and generator?
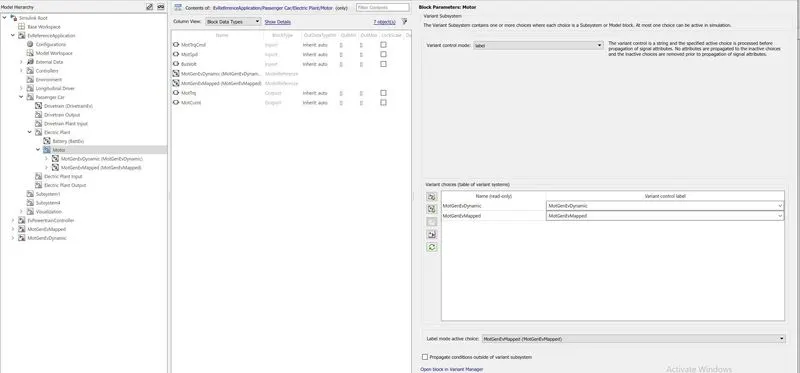
Steps to change mapped or dynamic models,
- Open the model explorer
- Select motor from the model hierarchy
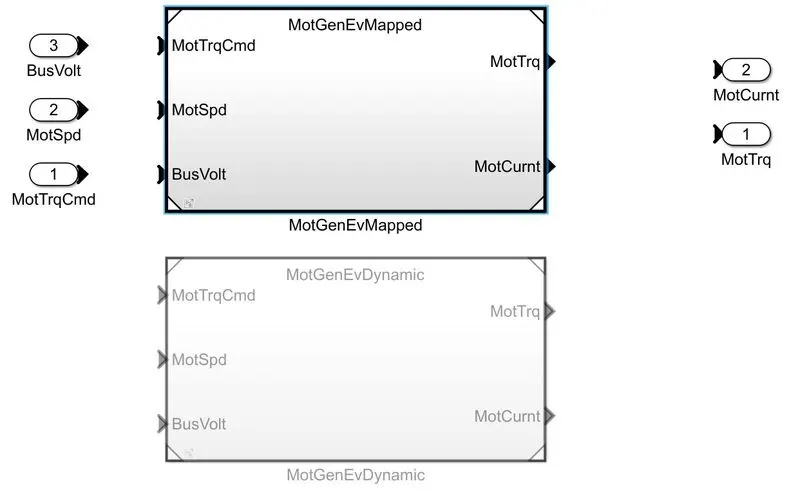
- Select the mapped /dynamic motor from the label mode active choice
Mapped model:
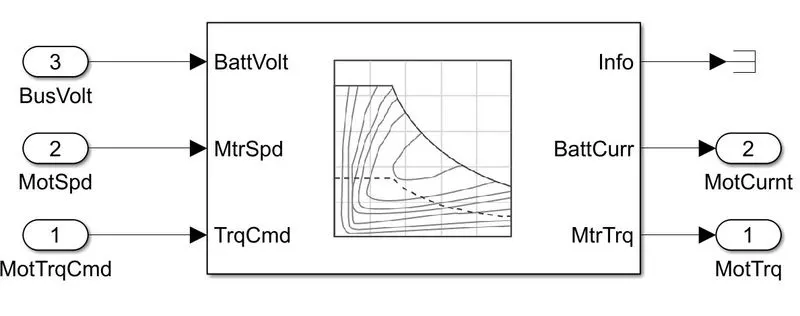
- The mapped model works with the available mapped data (torque, speed, power) of the motor, generator and engine.
- Works with the lookup table data
- No Need of controllers
- Works faster than dynamic model
- Mapped model are suitable for analyse and design work.
Dynamic model:
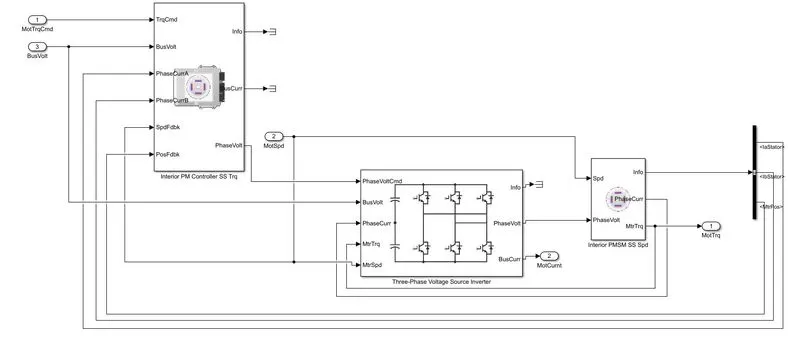
- The dynamic model works with the dynamic input of data (torque, speed, power) of the motor, generator and engine.
- works with the other individual subsystem model
- Need controllers
- Works slower than mapped model
- Dynamic models are suitable for designing, estimation and diagnosis.
____________________________________________________________________________________________________
2. To find how the model calculates miles per gallon?
MPG is used to indicate the fuel economy of the car, 10 MPG indicates the 10 miles range of the vehicle.
The formula for MPG =(distance covered /fuel used)
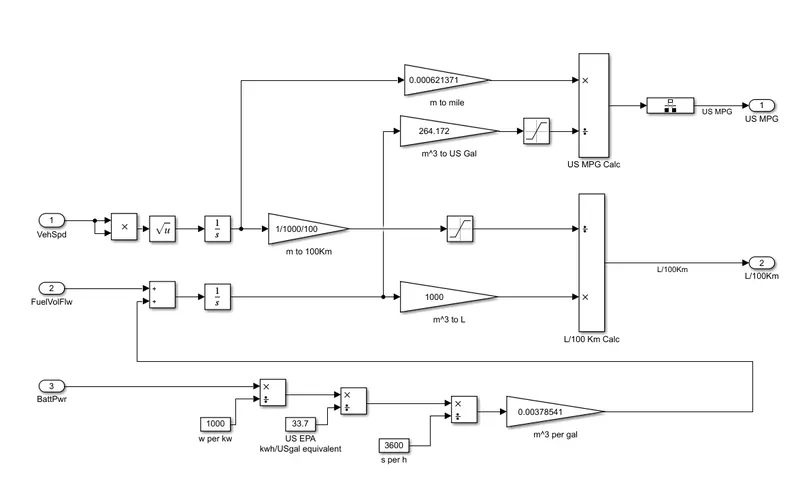
The diagram clearly shows the MPG calculation
- The speed is taken as the positive value and integrated.
- After integrating it becomes a distance.
- The distance in meters is converted to miles.
- On the other side, the battery consumption power is taken and converted as kilowatt-hour.
- Again the power is converted as the gallon of fuel.
- Then the gallon per second is converted to the gallon per hour.
- Gallon is again converted for the meter cube
- Then converted for the US gallon std.
- Then by dividing the distance covered by the fuel used gives the miles per gallon.
____________________________________________________________________________________________________
3. To Run the HEV ReferenceApplication with WOT drive cycle & Change the grade and wind velocity in the environment block.
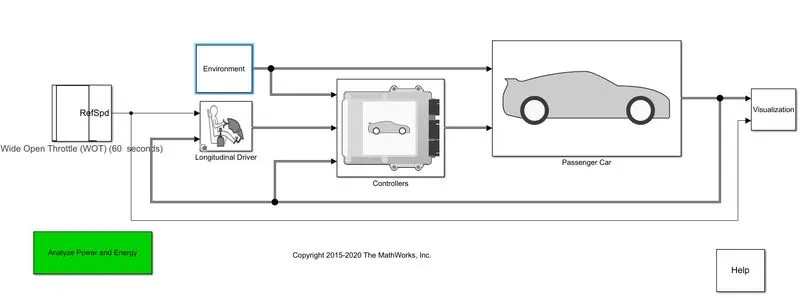
The HEV ReferenceApplication is opened.
The WOT drive cycle is changed.
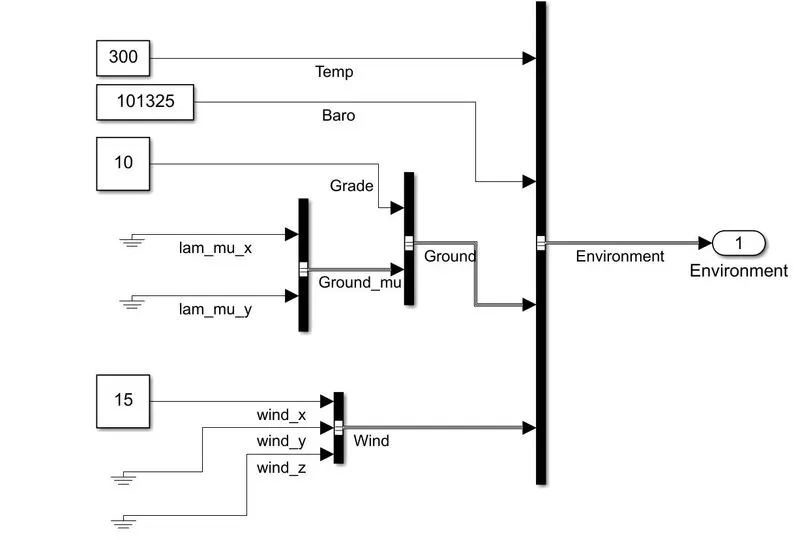
As per the question objective, the value of grade and wind speed is changed.
Grade value is changed to 10
The wind speed value is changed to 15
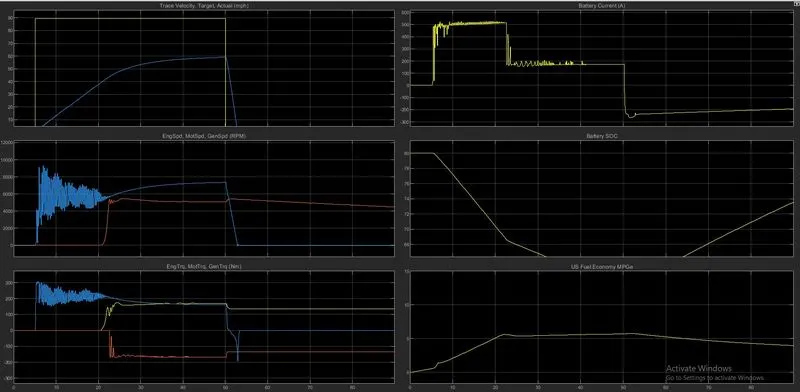
As we know the vehicle performance will change when grade and wind speed applied.
From the above graph, we can conclude that the grade and wind speed many factors like trace velocity, battery performance, etc. changes.
____________________________________________________________________________________________________
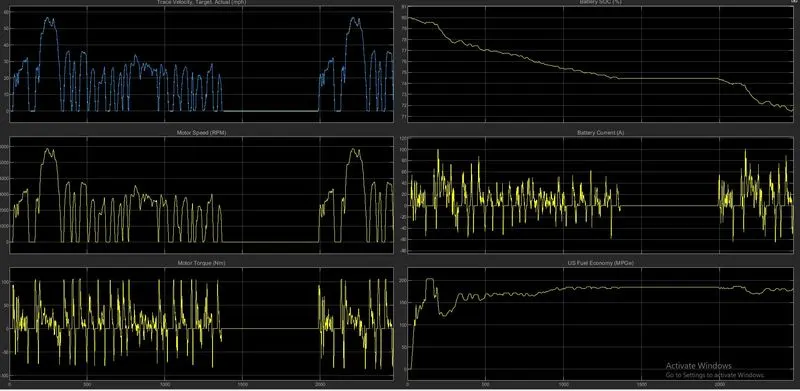
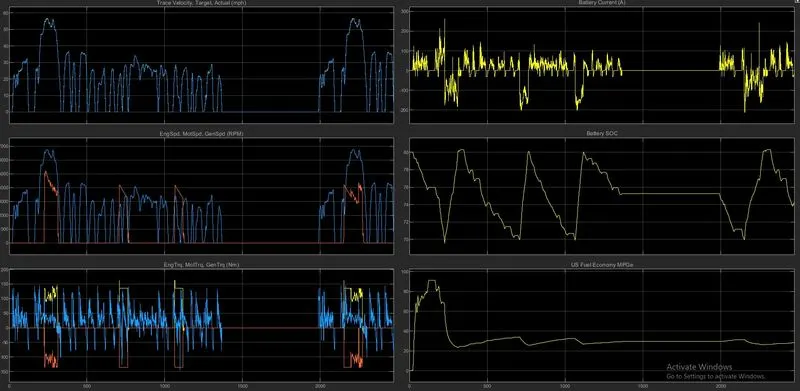
4. To Keep all other parameters the same, compare the simulated results of hybrid and pure electric powertrains.
EV Graph:
HEV Graph:
Conclusion:
By comparing the EV and HEV,
The pure electric vehicle is having the advantage over hybrid vehicle like the system of pure EV is not complex as hybrid and hybrid vehicle efficiency is comparatively less than pure electric. The EV does not emit any harmful gases.
____________________________________________________________________________________________________